Embed Size (px)
Citation preview

1
Retail for Business Analysts and Management Consultants
Practical guide how to improve retail business

2
Retail has become extremely competitive. Therefore, you have to become very analytical and innovative to survive and develop your business

3
Thanks to this presentation you will learn how in practice to
improve the profits of a Retailer

4
How the presentation is organized?
5
This presentation is organized into 7 sections that will show you different aspect of Retail business. You will also find movies with examples.
Basic analyses that you should perform
Modeling Retail Business in Excel
Optimization of in-store processes –
case study
Business Hacks used by Retailers
In-store engagement and productivity
analysis
MultichannelExpansion Strategy

6
This is part of my on-line course where I show step by step improve results of a Retailer. You will find there additional Excels with calculations
Retail for Business Analysts and Management Consultants
$90$15
Click to check my course
7
Basic analyzes that you should perform

8
Introduction to Basic Analyses

9
In this section I will show you the basic analyses that you should perform during your first week in a new retail business. You should start with creating issue tree
Issue tree for retail
Analyses by cohorts
Product Range Analysis
Sales and margin efficiency of
retailStore checks
Inventory analysis

10
Issue tree

11
Issue tree is an interesting concept that helps you go from a suspected problem to potential resasons and analyses that you have to carry out
Area of analysis
Area 1
Problem 1
Problem 2
Possible Reason 1
Possible Reason 2
Possible Reason 3
Possible Reason 4
Possible reasonsSuspected problemsAnalysis to be performed
Analysis 1
Analysis 2
Analysis 3
Analysis 4

12
Have a look at an issue tree of a chicken meat producer
Area of analysis
Transport
High costs of transport per ton of goods
Big level of waste and breakage in transport
Possible reasonsSuspected problemsAnalysis to be performed
Analysis of correlation between type of packaging and percentage of damaged
Analysis of time spent on the way and kilometers covered in that time
Analysis of designed routes, their length and the influence of possible changes
Analysis of fuel usage and kilometers covered by vehicles
Analysis of load carried on the way back
Badly designed routes
Too big fuel usage
No shipments on the way back
Low usage of resources
Badly designed method of packaging which makes the product prone to damage
Speed not adjusted to the product
Badly organized work and schedule of deliveries
Limitation on delivery time of finished goods
Analysis of level of overtime, daily organization of drivers work
Analysis of Clients’ preferences on delivery time

13
Issue tree in Retail -examples

14
When you are talking about retail you should have a look a the following areas
Retail chain development
Product Range / Category Range Management
Pricing
Logistic / Supply Chain
Expansion model
In-store process
HR especially trainings

15
Below you can see example of issue tree in Retail Chain Development
Area of analysis
Retail chain development
Low growth in sales
Decreasing EBITDA of new stores
Possible reasonsSuspected problemsAnalysis to be performed
Analysis of rents vs comparable competition
Salaries growth vs rotation – comparison with competition
Analyze the change in sales after opening new stores / on-line introduction
Analysis of number of openings vs availability of new places
Low LFL due to cannibalization (on-line, new stores in old locations)
Few new openings in locations
Increasing rents due not proper usage of purchasing power
Growing salaries to keep low rotation
High cost of building new stores
No support from the shopping malls
Not optimized formats, expensive fixtures
Analysis of contracts with shopping malls
Analysis of cost per 1 sq. m, number of fixtures, cost per fixtures

16
Areas you should pay attention to in Retail

17
There are number of areas of Retailer activities you should look at during consulting projects
Value Proposition and formats of the
stores
Retail business model logic
Product Range Management
Private Labels
MultichannelExpansion Model
Supply ChainIn-store Processes
In-store engagement and productivity
analysis
Automation Pricing

18
Analyses of stores by cohorts - Introduction

19
You can analyze a retail chain by following cohorts / segments
Vintage (which year it was open)
Format type
Format evolution phases
Location
Type of city
Type of traffic
Others

20
You usually show for specific cohort / segment the following metrics
Sales density (Sales per sq. m)
Margin density (Sales per sq. m)
Number of stores
Total sales generated by the cohort
Total margin generated by the cohort
% in total sales generated
% in total margin generated

21
Product range analyses -Introduction

22
In Retail you have space that you divide among different product groups
Group A
Group B
Group E
Group C
Group D
Group F

23
For every group you should calculate the total margin using sales density, % Gross Margin and space allocated to specific group
% Gross Margin
Sales density
Margin density Space in sq. mx
Total margin
x

24
You have to analyze their performance and decide how to split the space
4 250
3 0002 500
2 0002 400
4 000
Group A Group B Group C Group D Group E Group F
Sales densityIn USD/ sq. m
40%
55%44%
60%
40%
60%
Group A Group B Group C Group D Group E Group F
% MarginIn %
1 700 1 650
1 100 1 200960
2 400
Group A Group B Group C Group D Group E Group F
Margin densityIn USD/ sq. m
400
200
50
300
200
100
Group A Group B Group C Group D Group E Group F
Space allocationIn sq. m
Total margin generated by the store
25
Product range analyses -Example

26
Let see how we can allocate the space differently for our example
4 250
3 0002 500
2 0002 400
4 000
Group A Group B Group C Group D Group E Group F
Sales densityIn USD/ sq. m
40%
55%44%
60%
40%
60%
Group A Group B Group C Group D Group E Group F
% MarginIn %
1 700 1 650
1 100 1 200960
2 400
Group A Group B Group C Group D Group E Group F
Margin densityIn USD/ sq. m
400
200
50
300
200
100
Group A Group B Group C Group D Group E Group F
Space allocationIn sq. m
Total margin generated by the store

27
Different split of space among categories enabled us to increase the Gross Margin by USD 227 K
680 744
330413
360 210
192120
240570
Margin generated Basic OptionIn thousands of USD
Margin generated - Modified OptionIn thousands of USD
Group A Group B Group C Group D Group E Group F
Total margin generated by the shopIn sq. m
1 857 2 084

28
Sales and margin efficiency of retail
29
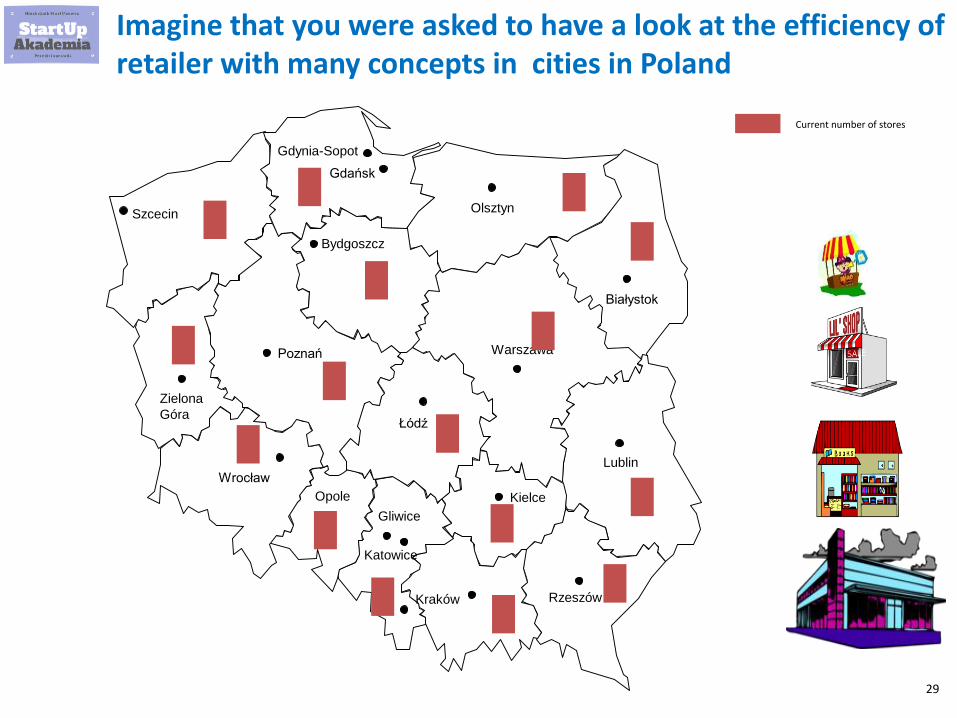
Imagine that you were asked to have a look at the efficiency of retailer with many concepts in cities in Poland
Gdańsk
Szcecin
Bydgoszcz
Poznań
Wrocław
Katowice
Łódź
Kraków Rzeszów
Kielce
Lublin
Warszawa
Białystok
Gdynia-Sopot
Gliwice
Olsztyn
Opole
Zielona
Góra
Current number of stores

30
In the case of efficiency there are to main KPIs retailers use
Sales density Margin density

31
You want to see which format and city are the most efficient
Formants / Concepts City
▪ What is the sales density per format? Which one is the best
▪ What is the margin density per format? Which one is the best
▪ What is the sales density per city? Which one is the best
▪ What is the margin density per city? Which one is the best
32
Inventory analysis
33
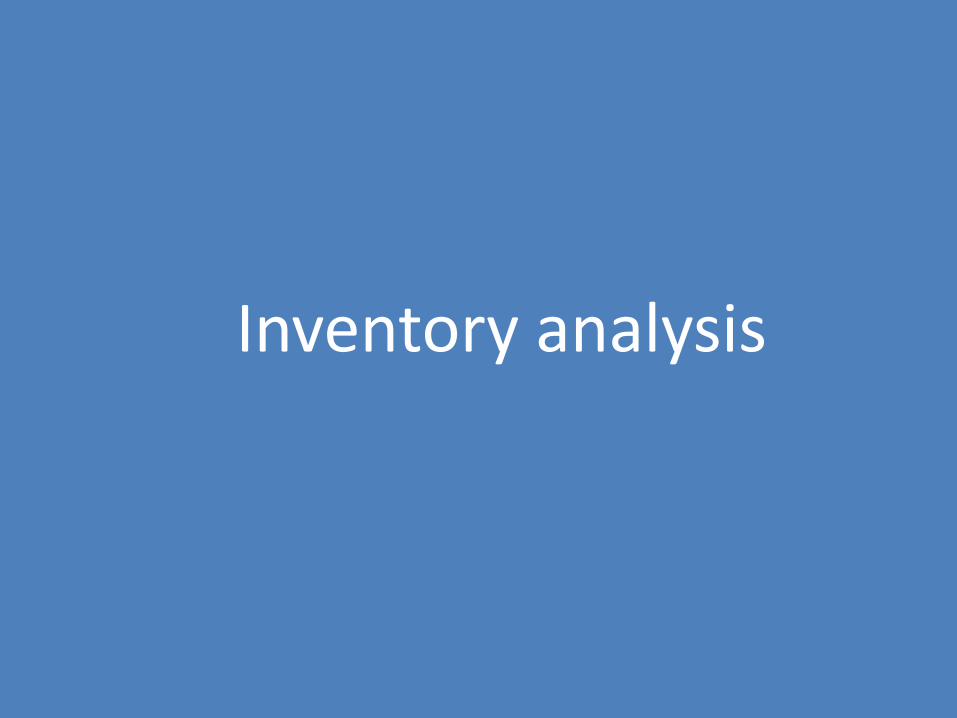
In our example of single store when we look at the sales and inventory level it is clear that there is too much stock
1 700
600
125
600480 400
Group A Group B Group C Group D Group E Group F
Sales in the storeIn thousands of USD
200
300
50
150200
100
Group A Group B Group C Group D Group E Group F
Inventory level in retail pricesIn thousands of USD
42
180
144
90
150
90
Group A Group B Group C Group D Group E Group F
Inventory turnoverIn Days of Sales

34
There could be plenty of reason for the inventory too be so high in Days of Sales
High share of push vs pull
Low responsiveness of supply chain
Bad allocation
Bad segmentation of the store –wrong customer profile
High level of dead stock that does not rotate
Problems with the format / layout
Problems with execution (i.e. Not right VM of goods, keeping
the stock in the backroom)

35
For every store you can present the potential to reduce the inventory using the waterfall
Inventory level in a store AIn thousands USD
1 000
304
696
Inventory before Potential Reduction Inventory after

36
If you have more stores than you can also show how you get to the total inventory reduction by showing contribution of specific stores
Inventory reduction potential by storesIn thousands USD
304
400
200
500
900
100200
200100
200
3 104
Store 1 Store 2 Store 3 Store 4 Store 5 Store 6 Store 7 Store 8 Store 9 Store 10 Total

37
This is part of my on-line course where. To see how to carry out all analyses in Excel and get ready-made Excels use the discount offered below
Retail for Business Analysts and Management Consultants
$90$15
Click to check my course

38
Store checks in Retail -examples

39
5 10 15 5 35
Number of SKU
Location:
Number of salesmen:
Competition: Saturn, Karen Notebook, iSpot
Size:
Number of SKU
Presented products
Structure of the exposition (%)
=100
PC Laptop Printers Phones Monitors Photos Others
-
3
E
+
Knowledge of
the product
offer
Sales skills
How active
salesmen are
Behavior
Usage of
marketing
materials
Level of service
• Salesman was able to respond to the request placed by the customer and it seemed that he had deep
knowledge of the products
• Salesman did not try to figure out what price level I was interested in. Surprisingly was proposing always the
cheapest products
• Salesman did not show the full potential range of benefits coming from the purchase (price of the software was
for some models incl. in the price, possibility to buy in installment)
• Salesman was very enthusiastic during the talk
• Salesman did not try to convince that the price is good and did not try to understand why I leave without the
purchase
• Salesmen did not try to do some cross selling or up-selling to other customers who purchased the base
products
Shopping mall
70 sq m
2
Other observations
Here you can see an example of store check for B2C – a shop selling computers
Laptops:
Pendrives: Firm No. of pieces
Cool drive
Kingston
Toshiba
6
1
1
Brand No. of pieces
HP
Toshiba
Asus
Sony
Samsung
Lenovo
Fujitsu
10
11
5
3
2
1
1
40
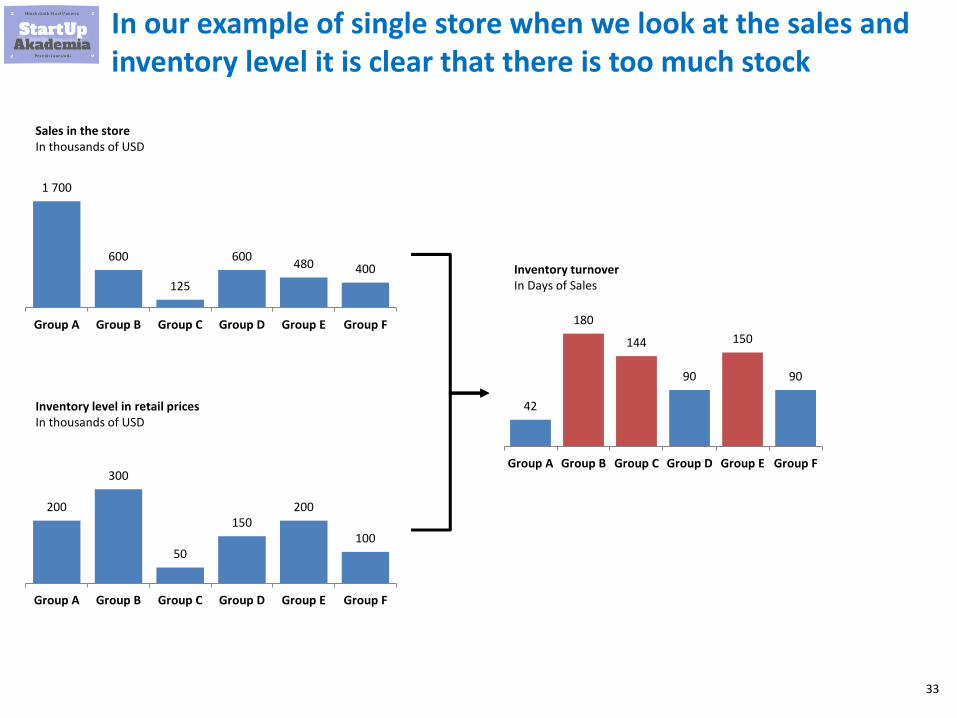
10 5 85 00000
Store profile
Location:
Rating of the location:
No. of salesmen
Competition level:
Size:
Number of SKU
Presented products
Structure of the exposition (%)
OSB Others
=100
-
3
E
+
Ability to adjust the product to the customerTechnical knowledge and knowledge
on the application of the products
Ocena pracowników składu
Center
1
500 m2
4
Service level
3
Plywood
Chipboard
MDF i HDF
OSB
Plank
Veneer
Countertops
Furniture fronts
Fittings
Other
0
0
0
2
0
0
0
0
1
1
Number of competitors in
radius of 3 km
3
Fittings
No. of SKU
Lead time
Home delivery
Other services offered
Shop with fittings
Limit on receivables
Payment terms
Other non standard products
immediate
n/a
no
Yes
n/a
n/a
Building materials
Here you can see an example of store check in B2B sector for a company selling wooden semi-products
Sales skills
How active
salesmen are
Knowledge of the
product offer

41
Store checks - examples in restaurants

42
Let’s have a look at the store check done at a Bobby Burger – a slow burger concept
Country of origin ▪ Poland
Typical sizeIn sq m
▪ 60-120
Investment needed In thousands of USD
▪ 50
Average priceIn USD
▪ 6.5
Production of food ▪ Produce to order
StaffIn people per shift
▪ 1+ 2 cook
Monthly revenues In thousands of USD
▪ 45
Number of open restaurantsIn pieces
▪ 38
Food Main competitors
Basic Data

43
Let’s have a look at the store check done at a Café Vincent – a french cafe and bakery
Country of origin ▪ Poland
Typical sizeIn sq m
▪ 130
Investment needed In thousands of USD
▪ 200
Average priceIn USD
▪ 3.5
Production of food ▪ Produce to shelf
StaffIn people per shift
▪ 2+3 baker
Monthly revenues In thousands of USD
▪ 100
Number of open restaurantsIn pieces
▪ 4
Food Main competitors
Basic Data

44
How to use store checks to check a specific location?
45
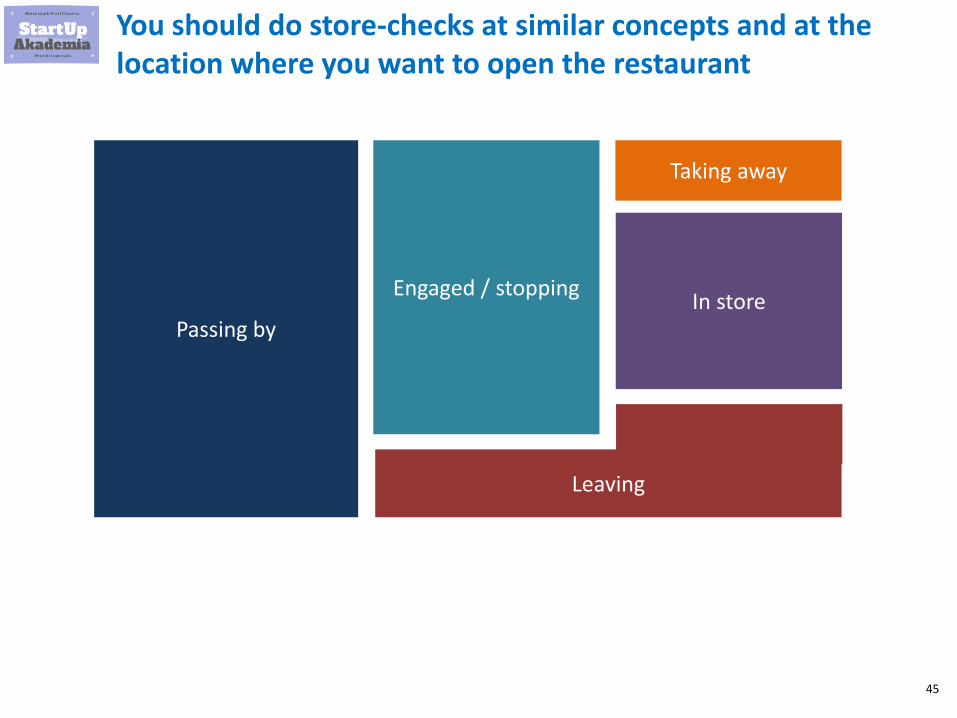
You should do store-checks at similar concepts and at the location where you want to open the restaurant
Passing by
Engaged / stopping
Leaving
Taking away
In store
46
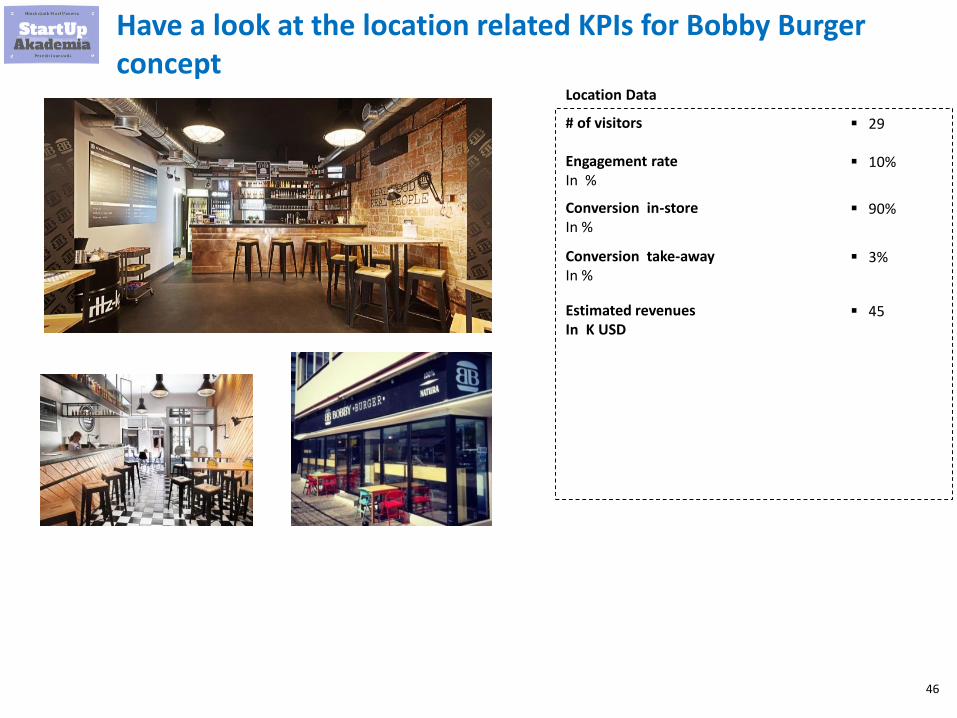
Have a look at the location related KPIs for Bobby Burger concept
# of visitors ▪ 29
Conversion in-storeIn %
▪ 90%
Conversion take-awayIn %
▪ 3%
Engagement rateIn %
▪ 10%
Estimated revenuesIn K USD
▪ 45
Location Data

47
Have a look at the location related KPIs for Vincent concept
# of visitors ▪ 44
Conversion in-storeIn %
▪ 7%
Conversion take-awayIn %
▪ 73%
Engagement rateIn %
▪ 3%
Estimated revenuesIn K USD
▪ 100
Location Data
48
Retail business model

49
Introduction to retailer business model

50
Retail sounds very simple. You have to get the right stock in front of the right customers at the right moment

51
Yet there are some issues that simple make it difficult in execution
You have many segments of customers
Their come with different missions
Product Range is huge
Demand is very erratic / seasonal
Your supply chain is very complex

52
Let’s have a look at the example of a home improvement /DIY store
You have many segments of customers
Their come with different missions
Product Range is huge
Demand is very erratic / seasonal
Your supply chain is very complex
▪ Regular people that do renovation infrequently
▪ Fans of renovation you are constantly doing something
▪ B2B customers
▪ Building new house
▪ Preparing the apartment to move in
▪ Renovation
▪ Small improvements
▪ Small refill purchases
▪ 60 K SKUs regular
▪ 15 K SKUs seasonal
▪ Peaks in the Spring and summer
▪ Low season in winter
▪ You have local suppliers of heavy things (i.e. bricks),
▪ National suppliers
▪ Foreign regional suppliers (i.e. European)
▪ Asian suppliers (especially China)

53
Let’s have a look at another example of a kids’ ware retail chain
You have many segments of customers
Their come with different missions
Product Range is huge
Demand is very erratic / seasonal
Your supply chain is very complex
▪ Parents
▪ Non-parents
▪ Pre-born purchase
▪ Regular purchases
▪ Gifting
▪ Education and Development
▪ 40 K SKUs regular
▪ 10 K SKUs seasonal
▪ Short life of SKUs – Toys last in most cases up to 1 year; Fashion –6 months
▪ Peaks in the Christmas and around special gifting days
▪ Low season in Summer and after Christmas
▪ Regional brand suppliers
▪ Asian suppliers (especially China, India, Bandgladesh)

54
Main challenges in Retail

55
Let’s have a look at the main challenges in Retail
Margin ManagementStock / Inventory
ManagementMultichannel
Strategy
Managing price across channels
Expansion to new markets
Saturation of existing markets
New product development
Managing customer experience across
channels
Format evolution (possible death)
People rotation and knowledge
management
Disruption esp. from external forces / business models
Automation
56
Business model of Retailer in Excel

57
We start by estimating the total sales of Stores. That depend on average transaction value (ATV) and the number of transactions
# Transactions
Average Value Transaction
Total store revenue
x

58
We can estimate the number of transaction using the number of visits and conversion rate
# Transactions
Average Value Transaction
Total store revenue
x
# of Visitors % Conversion
x

59
Average Transaction Value depends on the average value of basic purchase as well as some suggested purchases (i.e. suggested products)
# Transactions
Average Value Transaction
Total store revenue
x
Average Value Transaction of basic purchase
Average Value Transaction of additional purchase
# of Visitors % Conversion
+
x
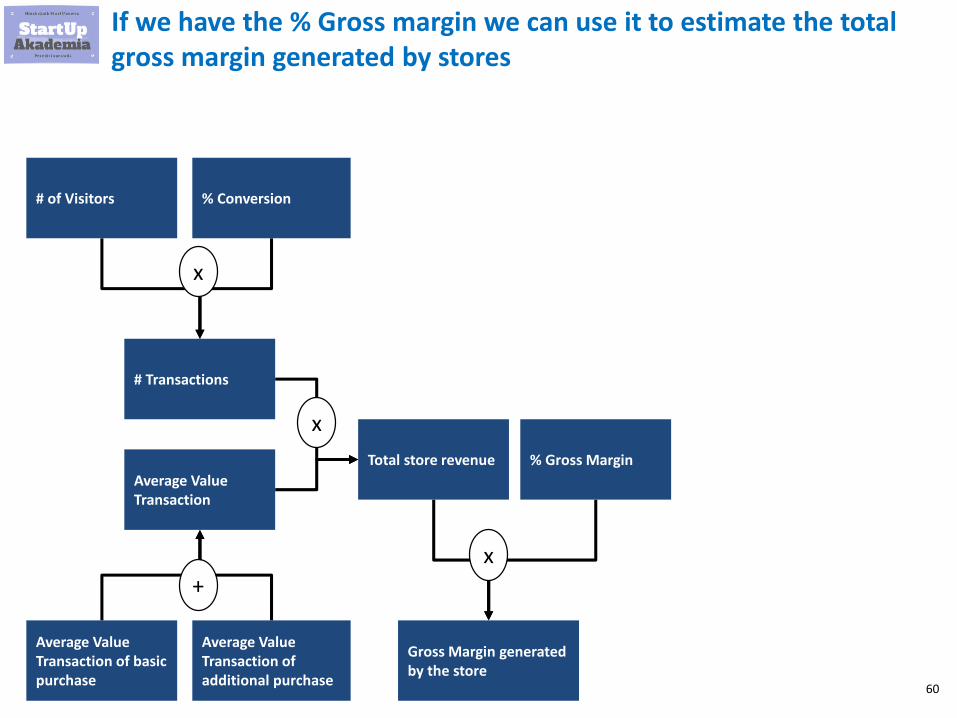
60
If we have the % Gross margin we can use it to estimate the total gross margin generated by stores
# Transactions
Average Value Transaction
Total store revenue
x
Average Value Transaction of basic purchase
Average Value Transaction of additional purchase
# of Visitors % Conversion
+
x
% Gross Margin
Gross Margin generated by the store
x
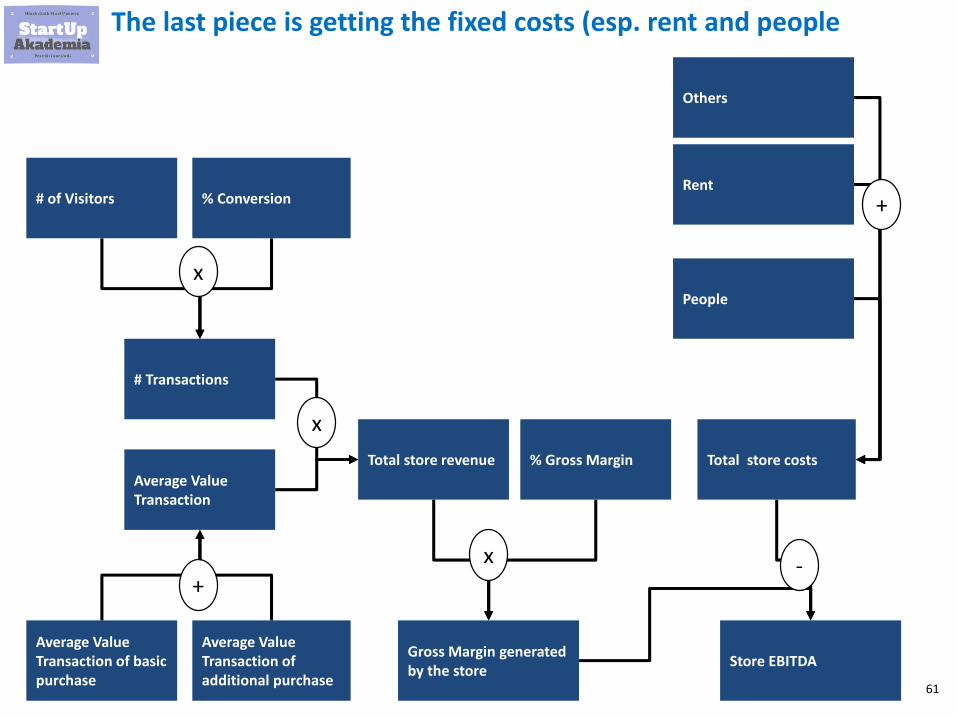
61
The last piece is getting the fixed costs (esp. rent and people
# Transactions
Average Value Transaction
Total store revenue Total store costs
x
Store EBITDAAverage Value Transaction of basic purchase
Average Value Transaction of additional purchase
# of Visitors % ConversionRent
People
+
x
Others
+
% Gross Margin
Gross Margin generated by the store
x -

62
We can also show what drives rent and salaries costs
# Transactions
Average Value Transaction
Total store revenue Total store costs
x
Store EBITDAAverage Value Transaction of basic purchase
Average Value Transaction of additional purchase
# of Visitors % ConversionRent
People
# of People
Average wages
+
xx
Others
+
# of sq. m
Fee per sq. m x
% Gross Margin
Gross Margin generated by the store
x -
63
To see how to transfer it into Excel go to my on-line course. Below link with great discount
Retail for Business Analysts and Management Consultants
$90$15
Click to check my course

64
Introduction to e-commerce

65
In e-commerce you will have 3 types of players depending on their presence in off-line and their approach to both channels
E-commerce
Pure players
Off-line players with separate on-line presence
Multichannel /Omni players

66
Customer behaviors has huge impact on the business model and on what the e-commerce should concentrate on
▪ Less than 40% of the buyers will buy this year
▪ Focus is on customer acquisition
▪ Loyalty program are not good investment
▪ 70% of e-commerce businesses are in this modelAcquisition mode
Description of the business model Examples
▪ E-commerce selling only 1 type of Slow Moving Consumer Goods (SMCG) bought infrequently i.e. vacuum cleaner, scuba diving, furniture
▪ E-commerce for 1-time in the life event: strollers,
▪ 40%-60% of the buyers will buy this year
▪ You have a nice mix of new and returning customers
▪ Focus is on customer acquisition as well increasing the value of the customer (increased frequency and increased purchase per visit)
Hybrid mode
▪ E-commerce that sells SMCG with relatively big frequency of purchase(1.0-2.5 times a year ) i.e. shoes (Zappos)
▪ More than 60% of the buyers will buy this year
▪ Focus is on increasing the value of the customer (increased frequency and increased purchase per visit)
▪ 10% of businesses are in this modelLoyalty mode
▪ Very strong brands with high frequency of purchase (i.e. Zara, Amazon)
▪ Marketplaces i.e. Udemy, Uber
Source: Lean Analytics: Use Data to Build a Better Startup Faster; A. Croll, B. Yoskovitz
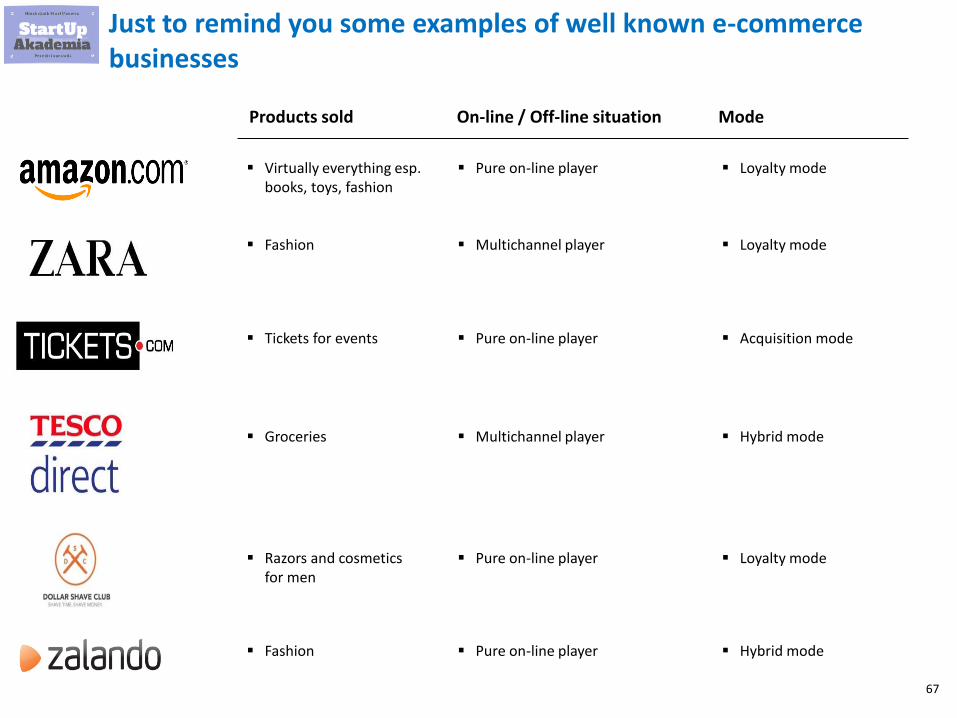
67
Just to remind you some examples of well known e-commerce businesses
Products sold On-line / Off-line situation
▪ Virtually everything esp. books, toys, fashion
Mode
▪ Pure on-line player ▪ Loyalty mode
▪ Fashion ▪ Multichannel player ▪ Loyalty mode
▪ Tickets for events ▪ Pure on-line player ▪ Acquisition mode
▪ Groceries ▪ Multichannel player ▪ Hybrid mode
▪ Razors and cosmetics for men
▪ Pure on-line player ▪ Loyalty mode
▪ Fashion ▪ Pure on-line player ▪ Hybrid mode

68
VISIT
PAID DIRECT SEARCH
To understand the logic of e-commerce business model have a look at the visualization of how it works
RECO ENGINENAVIGATION
BOUNCED
NOT INTERESTED
ABANDONED
UNSATISFIED
ONE-TIME BUYER UNSOCIAL BUYERCALL TO ACTION
OPEN RATE
SEARCH
CART
ADDITIONS
CONVERSION
LOGISTICS, DELAYS
VIRALRETURNING
CAC PageRank
Bounce rate
Sharing rateAbandonment, conversion rates
Ratings, delivery issues
Signups
Mail/RSS/TwitterReturning rate
Customer Lifetime Value Transaction size
Emphasis on repurchase rate, frequency, click-through rate, lifetime value
Emphasis on maximizing cart value, minimizing acquisition costs
DELIVERY
SHARINGENROLLMENT
Source: Lean Analytics: Use Data to Build a Better Startup Faster; A. Croll, B. Yoskovitz

69
Business model of e-commerce in Excel

70
Before we go to Excel let’s talk about the logic we used to build the e-commerce Excel model
▪ Conversion rate
Visits# of
transactionsRevenues
Gross Margin
Net MarginOperating
Profit
▪ ATV
▪ Cost of traffic
▪ Cost of logistics
▪ Transaction fees
▪ Fixed Costs
▪ % Gross Margin

71
Optimization of in-store processes – case study

72
1,8
6,0
3,9
1,5
3,8
3,3
8,4
28,8
In Retail you can achieve a lot by optimizing the operations in the store. Below example of a store were we carried out optimization and the saving we achieved per 1 store
12,7
17,3
6,1
2,6
6,2
15,7
27,1
87,7
Direct deliveries
Deliveries from Central Warehouse (CW)
Price change
Price monitoring
Cash till operations
Advices at the selling store area
Total monthly costsIn ‘000 USD
Potential savingsIn ‘000 USD
Total
▪ Potential savings are USD 29K (32% of all addressable costs)
▪ We assume that 50% of those savings can be achieved we can reduce the number of FTE in the store by 4
Others

73
You will see an example of optimizing 1 process. It was carried out in home improvement store. The test store was 4 000 sq. m big (43 000 sq. ft.)
Warehouse
Offices
Warehouse /store racks (shelving)
Cash Till
Employee
Customer

74
Price change – example of how we optimized 1 process
in the store

75
Price change is the process of changing the price tags. It generated for our customer 7% of costs in the test store but generated 16% of all savings
CC: Wikimedia

76
Let’s have a look how the price change process looks
Printing and preparation of new price tags
Price tag distribution Change of price tags
▪ Done by an Office Specialist
▪ Around 300-400 changes per day
▪ Office Specialist calls 4-7 Sales Reps to the Office and hands them over the price tags
▪ Sales Reps change prices in their departments
▪ A lot of problems were caused by lack of tools and infrastructure (scissors, ladder, pallet truck, dustbin etc.)
CC: Wikimedia

77
We have increased the number of tools an infrastructure
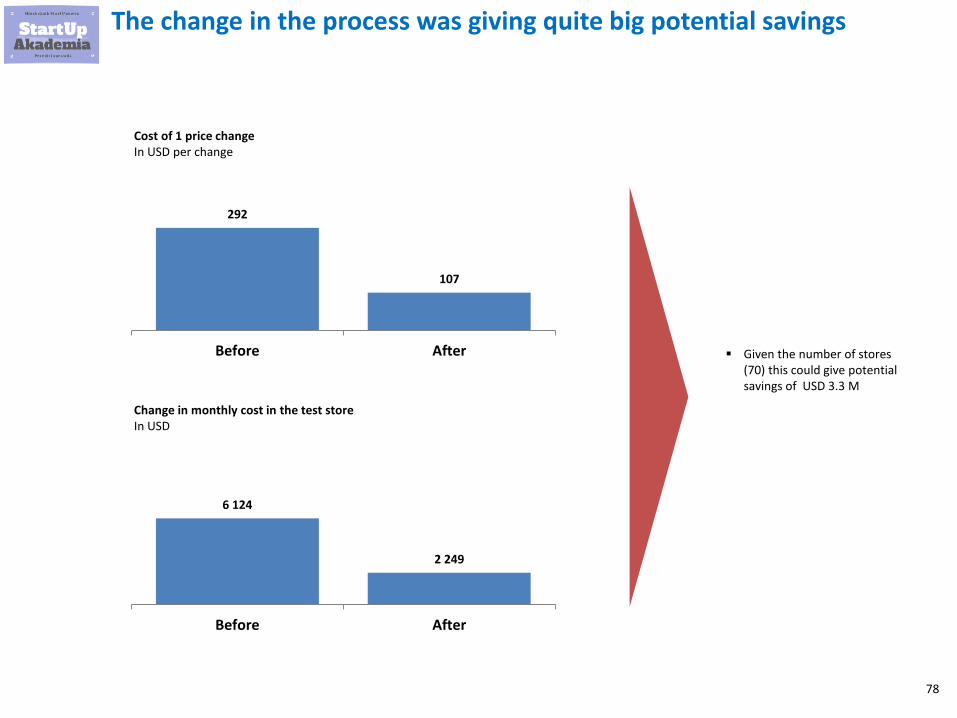
78
292
107
Before After
The change in the process was giving quite big potential savings
Cost of 1 price changeIn USD per change
6 124
2 249
Before After
Change in monthly cost in the test storeIn USD
▪ Given the number of stores (70) this could give potential savings of USD 3.3 M

79
How to optimize all other processes and to get downloadable Excels go to my on-line course
Retail for Business Analysts and Management Consultants
$90$15
Click to check my course

80
Business Hacks used by retailers

81
IKEA

82
IKEA has been very successful in implementing low cost model in furniture
Model „big box” built outside the city center
Design
Consistent message
Diversified revenue streams
Operational excellence
Business scale
Retail
Acquisition
Activation
Retention
Revenue
Referral

83
Model „big box” built outside the city center
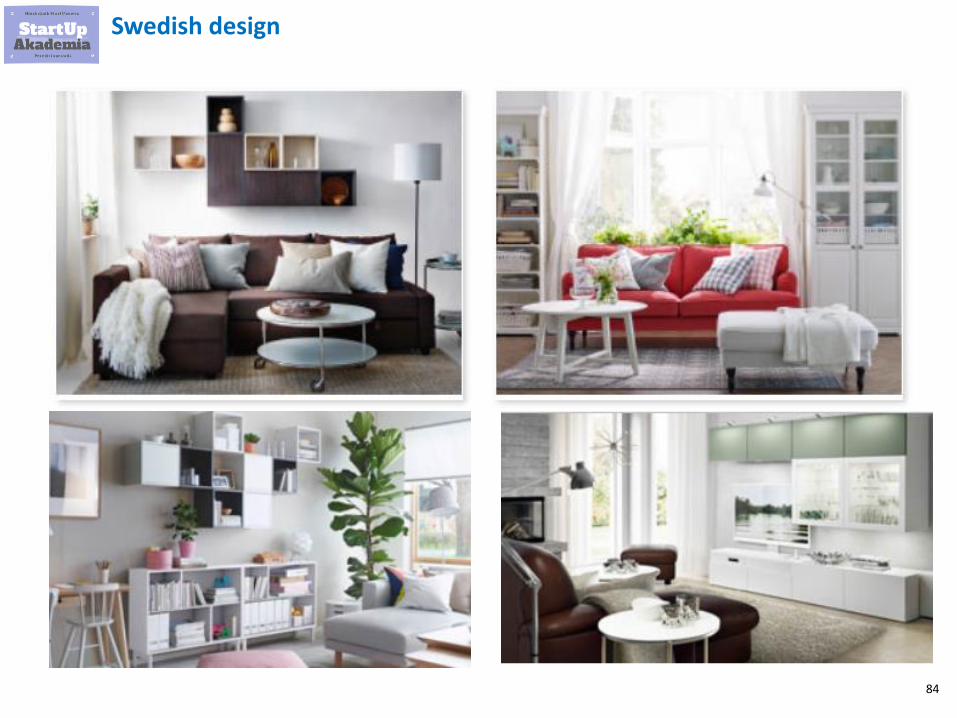
84
Swedish design

85
Communication cheap, convenient solutions
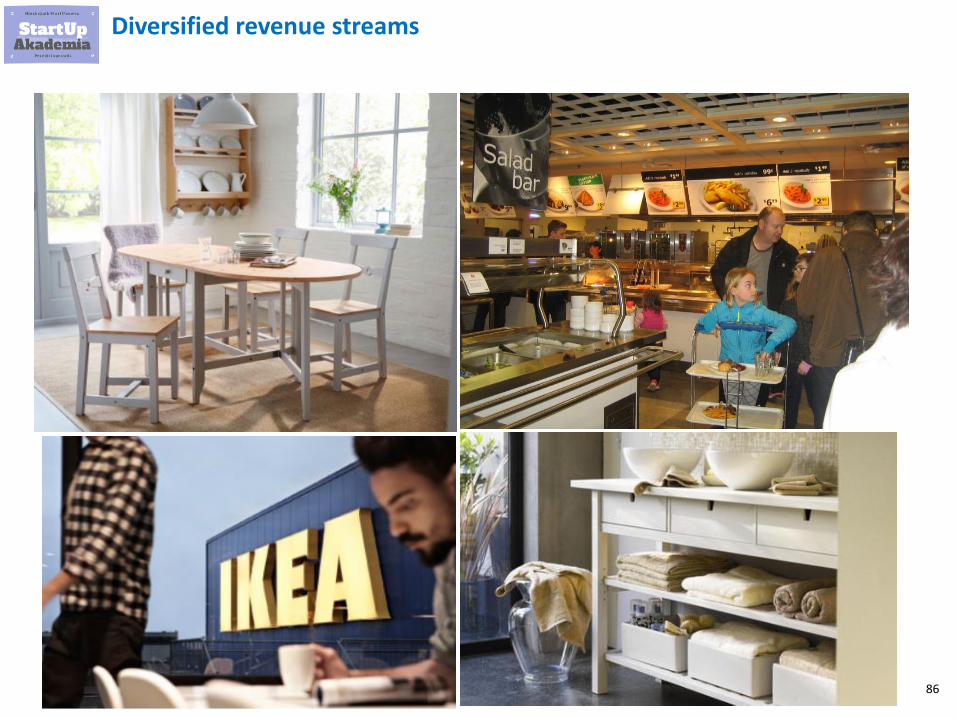
86
Diversified revenue streams

87
Very efficient operations management at every level

88
The scale of activity is so high that orders for the same chair are apportioned between the various production plants, because one would not be able to execute orders

89
Biedronka

90
Biedronka keeps it simple on the operational side
Retail
Acquisition
Activation
Retention
Revenue
Referral
Narrow range – they used to have just 1000 SKUs
1 retail format
Optimize supply chain and in-store process
Scale
Expansion model similar to Walmart and Starbucks

91
They went deep into product management
Retail
Acquisition
Activation
Retention
Revenue
Referral
Gradual move from discounter to supermarket
Quality and origin obsessed
Own brands & selected premium brands (often powered by)
No e-commerce
For long time excepting only cash

92
Cinema City

93
Cinema City has used number of techniques to sell the unused space
Acquisition
Activation
Retention
Revenue
ReferralB2B
Ladies night
Unlimited Card Every Wednesday half price
Halloween party
Birthday party
Lower price in the low season
Group events
New needs
Getting the heavy users to visit more

94
Expansion

95
Introduction to Expansion

96
Once your business model is right you will want to expand and grow. There are some options to do that
Increase size in current locations
Enter new locations but still the cities were you are
already
Enter new cities in your country
Enter new countries
Add new brands but within the same concept
Create new concepts in Retail
Enter totally new business models

97
Expansion of current model -options
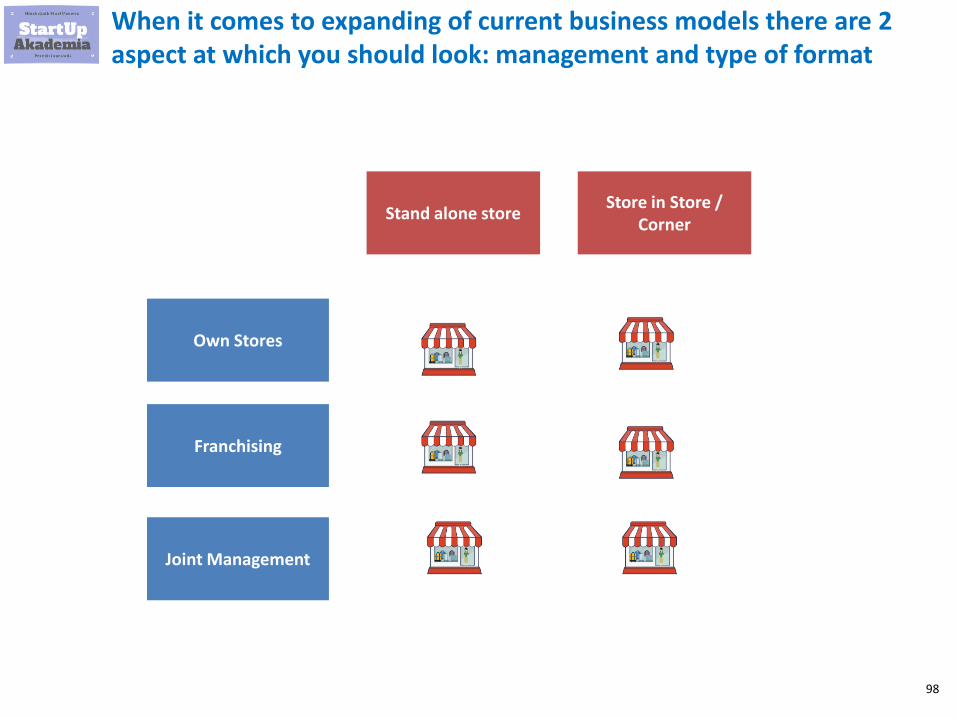
98
When it comes to expanding of current business models there are 2 aspect at which you should look: management and type of format
Own Stores
Franchising
Joint Management
Stand alone storeStore in Store /
Corner

99
Saturating existing markets -intro

100
If you are present on specific market you want to know when you will reach a saturation market – the maximal number of shops that will not cause much cannibalization
1 000
1 500
800
2 000
# of stores Saturation 1 Saturation 2 Saturation 3
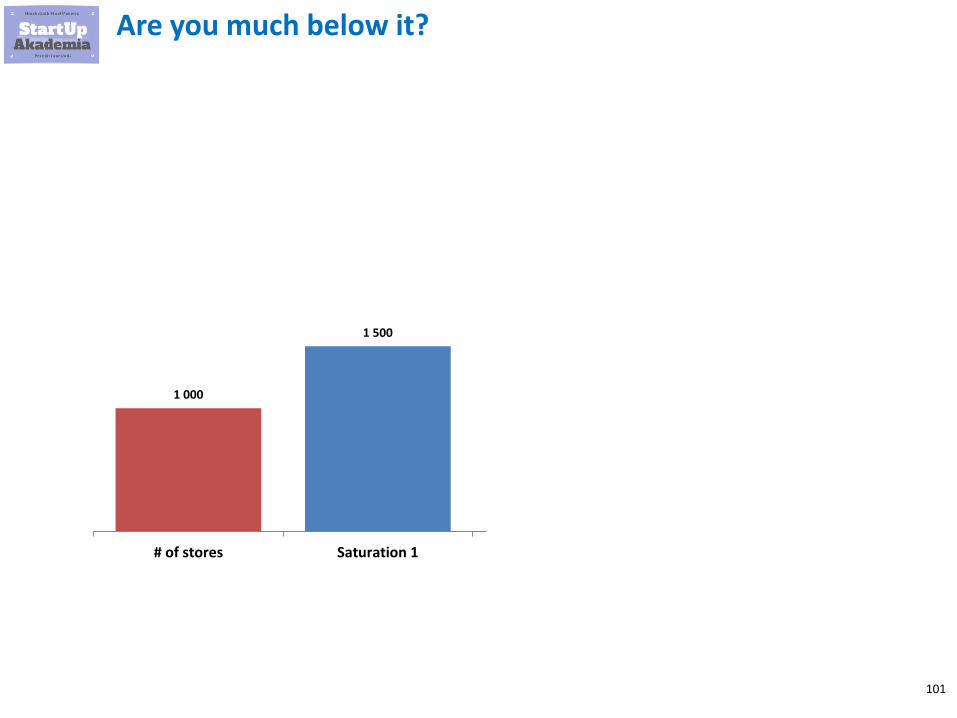
101
Are you much below it?
1 000
1 500
800
2 000
# of stores Saturation 1 Saturation 2 Saturation 3
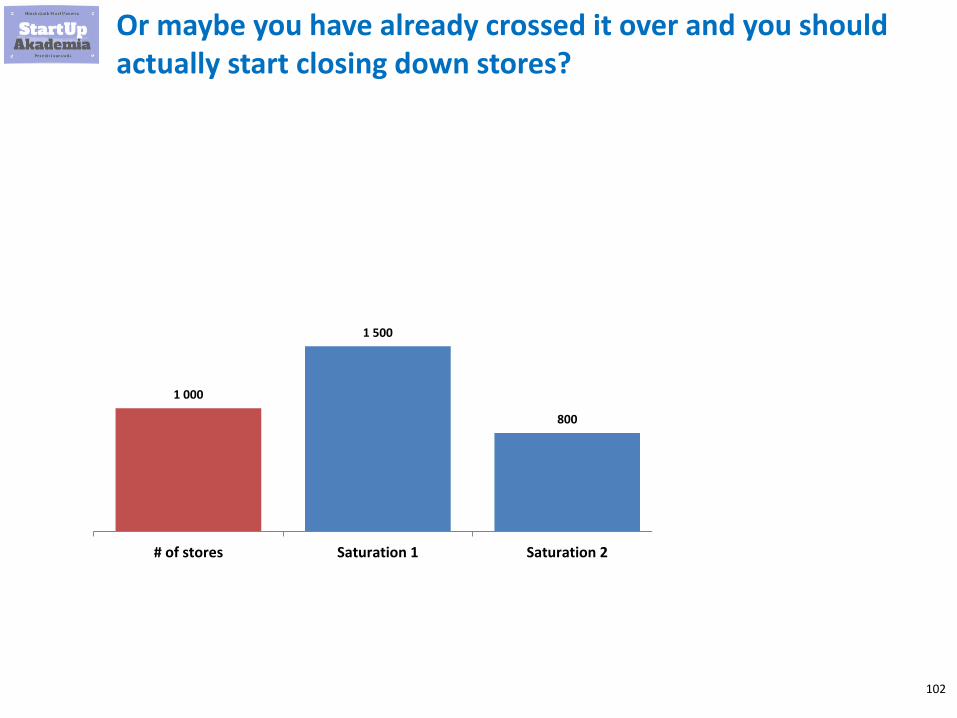
102
Or maybe you have already crossed it over and you should actually start closing down stores?
1 000
1 500
800
2 000
# of stores Saturation 1 Saturation 2 Saturation 3

103
You may also discover that the saturation point is far away and you have nothing to worry about
1 000
1 500
800
2 000
# of stores Saturation 1 Saturation 2 Saturation 3
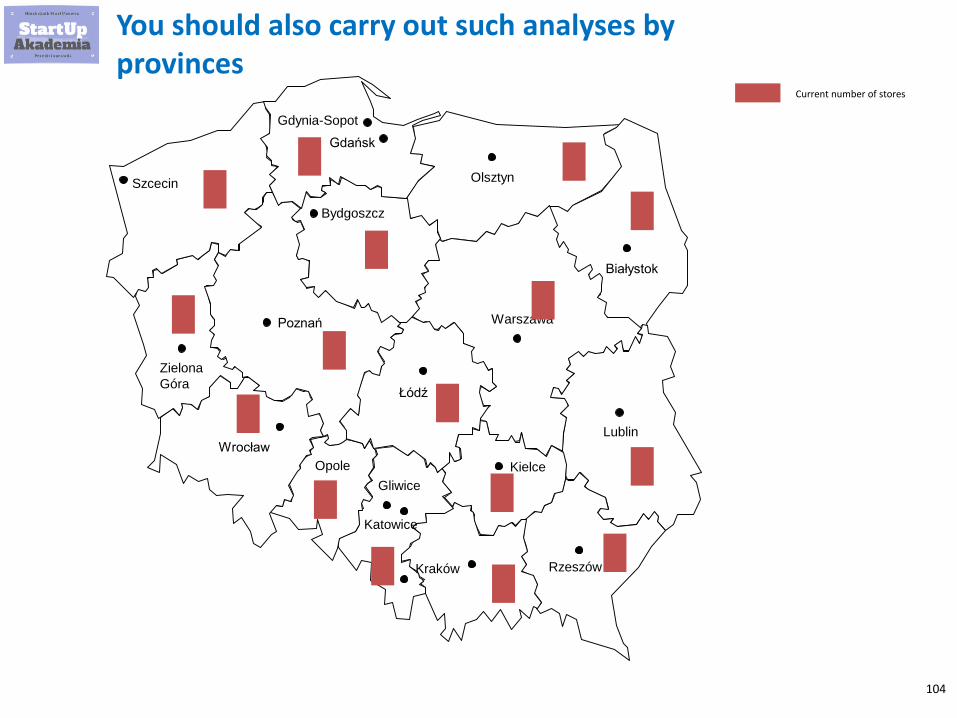
104
You should also carry out such analyses by provinces
Gdańsk
Szcecin
Bydgoszcz
Poznań
Wrocław
Katowice
Łódź
Kraków Rzeszów
Kielce
Lublin
Warszawa
Białystok
Gdynia-Sopot
Gliwice
Olsztyn
Opole
Zielona
Góra
Current number of stores
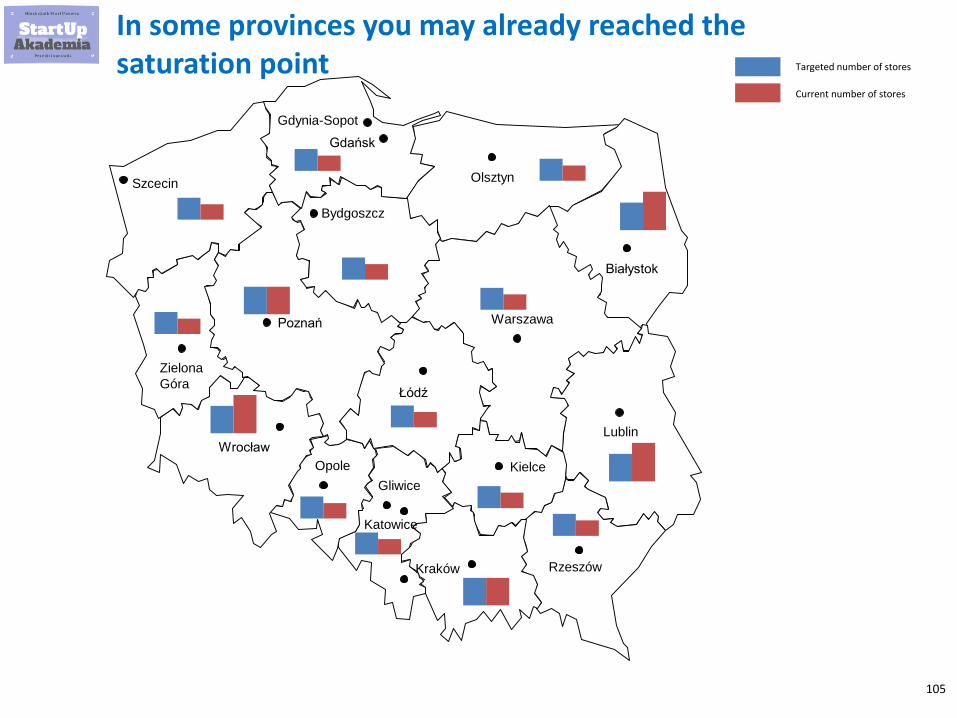
105
In some provinces you may already reached the saturation point
Gdańsk
Szcecin
Bydgoszcz
Poznań
Wrocław
Katowice
Łódź
Kraków Rzeszów
Kielce
Lublin
Warszawa
Białystok
Gdynia-Sopot
Gliwice
Olsztyn
Opole
Zielona
Góra
Targeted number of stores
Current number of stores

106
Expansion strategy into other countries - Introduction

107
Creating an expansion strategy requires you to do a number of things
Define criteria and weights for the criteria
Gather data on the markets
Create the ranking of markets to enter
Define limits that you have
Set priorities
▪ 4-6 criteria on the basis of which you will value specific markets
▪ Ranking on the basis of criteria and weights created
▪ Money for expansion
▪ People for expansion
▪ Logistics
▪ Lead time due to your supply chain
▪ Limitation in stock

108
Expansion strategy into other countries - Example

109
Let’s imagine that you were to create an expansion plan for expansion into new countries for a fashion brand

110
As you remember we have create a ranking of countries
Define criteria and weights for the criteria
Gather data on the markets
Create the ranking of markets to enter
Define limits that you have
Set priorities
▪ 4-6 criteria on the basis of which you will value specific markets
▪ Ranking on the basis of criteria and weights created
▪ Money for expansion
▪ People for expansion
▪ Logistics
▪ Lead time due to your supply chain
▪ Limitation in stock
111
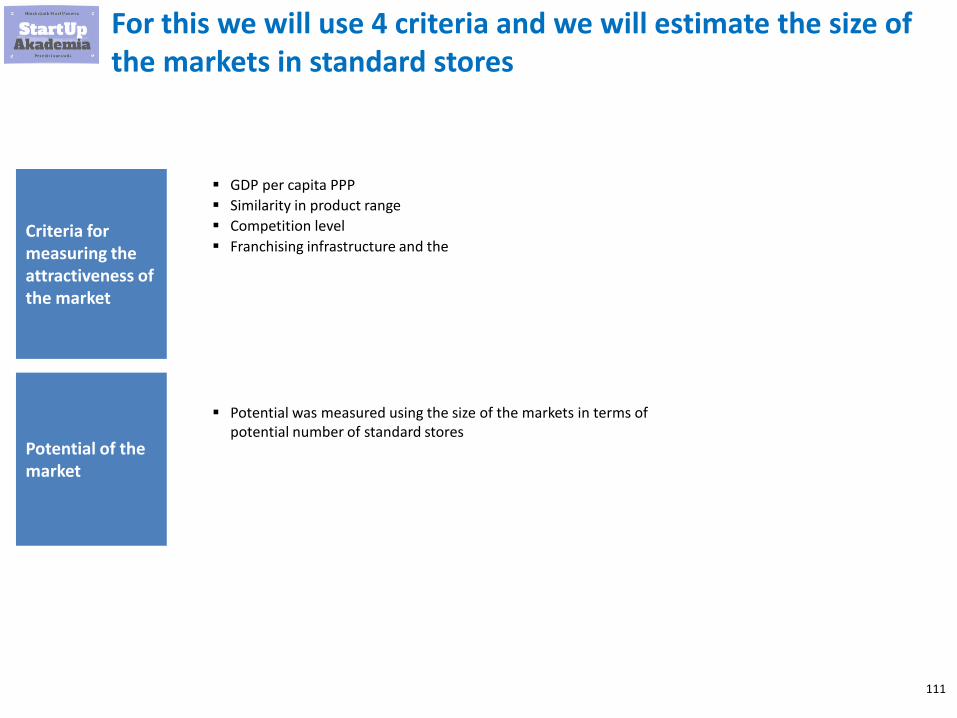
For this we will use 4 criteria and we will estimate the size of the markets in standard stores
▪ GDP per capita PPP
▪ Similarity in product range
▪ Competition level
▪ Franchising infrastructure and theCriteria for measuring the attractiveness of the market
Potential of the market
▪ Potential was measured using the size of the markets in terms of potential number of standard stores

112
Potential markets for expansion – Ranking vs Potential – region
2,2
2,3
2,5
2,6
2,7
2,7
2,9
3,0
3,3
3,3
3,4
3,4
3,5
3,6
3,9
4,3
Philipines
North America
Australia
Turkey
South America
Indonesia
China
Africa
ex USRR
Western Europe
India
Middle East
Malaysia
Thailand
Eastern Europe
Poland
Ranking of market attractiveness(1-low; 6-High)
Potential of countries / regions to capture assuming achieving share like in PolandIn standard stores
579
2 215
76
324
1 870
1 255
4 287
4 944
534
1 136
6 288
208
134
209
215
100
Philipines
North America
Australia
Turkey
South America
Indonesia
China
Africa
ex USRR
Western Europe
India
Middle East
Malaysia
Thailand
Eastern Europe
Poland
113
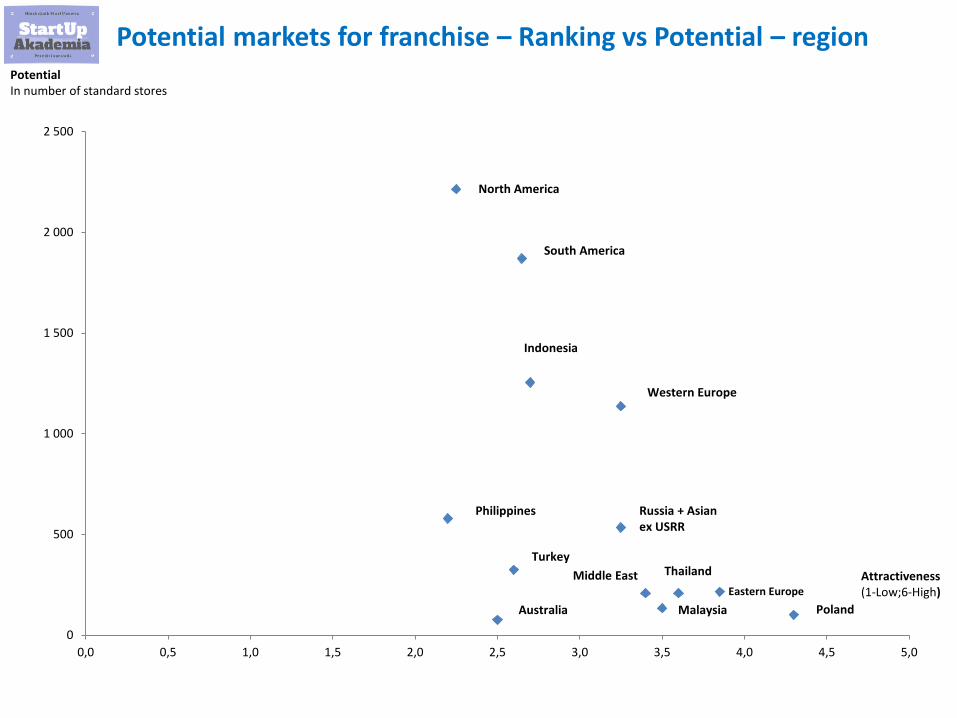
Potential markets for franchise – Ranking vs Potential – region
0
500
1 000
1 500
2 000
2 500
0,0 0,5 1,0 1,5 2,0 2,5 3,0 3,5 4,0 4,5 5,0
Poland
Middle East
Philippines
Eastern Europe
Russia + Asian ex USRR
Thailand
Malaysia
Indonesia
Australia
North America
South America
Turkey
Western Europe
PotentialIn number of standard stores
Attractiveness(1-Low;6-High)

114
This is part of my on-line course where. To see how to carry out all analyses in Excel and get ready-made Excels use the discount offered below
Retail for Business Analysts and Management Consultants
$90$15
Click to check my course

115
Example of expansion into other business models

116
There are 12 business models that you can consider. Some Retailers enter other business models
SaaS
E-commerce
Media site
2-sided market
User Generated Content
Mobile Applications
B2B Service
Retail
B2C Service
B2C Products
B2B Products
Freelancing

117
Interesting examples is Amazon that started as e-commerce and entered many different business models including Retail
SaaS
E-commerce Media site2-sided market
UGC
B2B Service
B2C ServiceRetailer

118
Multichannel
119
What is multichannel?

120
For the customer your off-line and on-line presence are the same brand and he expect the on-line experience to be at least as good as off-line
On-line belonging to retail chain
Off-line retail chain
One brand

121
This means that certain things should be managed across both channels
Products
Price
Customer Data
Relations with the customers
Customer Experience
Marketing communication

122
Main problems with multichannel

123
Let’s have a look at the main problems with multichannel
Cannibalization with off-line
Different customer experience
Operational problems coming
from on-line
Pricing Management
Competition with pure players
Big data unified approach
SegmentationMarketing
communication
People and firms take advantage of lower
on-line pricing
Falling traffic in off-line

124
Pricing dilemma - case study

125
Imagine that you have a chain of physical stores and on-line store. What pricing would you use
On-line belonging to retail chain
Off-line retail chain
?$ 100 $ 90
On-line market
126
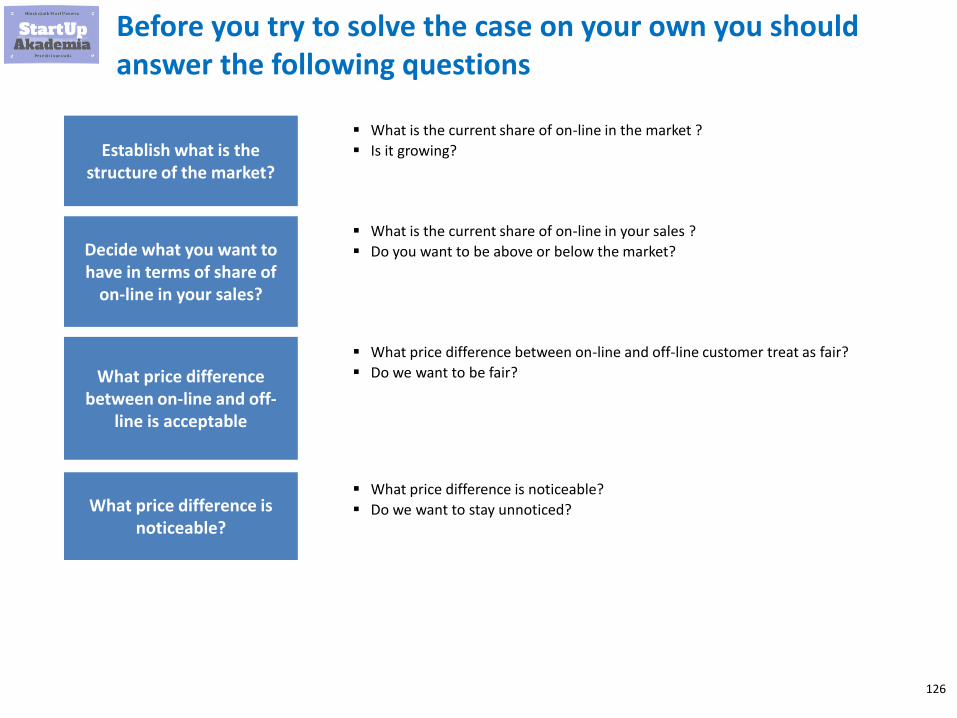
Before you try to solve the case on your own you should answer the following questions
Establish what is the structure of the market?
▪ What is the current share of on-line in the market ?
▪ Is it growing?
Decide what you want to have in terms of share of
on-line in your sales?
What price difference between on-line and off-
line is acceptable
What price difference is noticeable?
▪ What is the current share of on-line in your sales ?
▪ Do you want to be above or below the market?
▪ What price difference between on-line and off-line customer treat as fair?
▪ Do we want to be fair?
▪ What price difference is noticeable?
▪ Do we want to stay unnoticed?

127
The prices we want to set for the on-line business that belongs to Retailer should be considered and still competitive for on-line market
On-line belonging to retail chain
Off-line retail chain
?$ 100 $ 90
On-line market
▪ The difference in prices is fair it is not bigger than 6%
▪ The customer notices / cares if the difference in prices is up to 3%

128
Out of this we get the following brackets that we can consider
$ 90 $ 100$ 93
Fair prices
$ 97
Practically the same prices Practically the same prices
Here you are not on-line competitive
$ 94

129
If you have the answer to the questions from the beginning you can decide on the set of prices to use in online and offline
$ 93
Do you want the on-line to have bigger share in your sales than it has in the whole market?
Yes
No
Do you want the difference between on-line and off-line to be fair?
Do you want the difference between on-line and off-line to be fair?
Yes
No
Yes
No
$ 93<
> $ 94
$ 98
$ 100
$ 100
$ 93- $ 100 $ 100

130
Cannibalization of sales -Introduction

131
When you start building more stores you are bound to cause a lot of cannibalization

132
You can minimize the cannibalization by picking the right locations. Just remember that cannibalization may be there by design

133
There are plenty of reasons why you could be still ok with cannibalization
You are reaching new customers
You are taking away more from competitors than your
own chain
You are killing competition
More visibility = equivalent on marketing money
Increased purchasing power especially when it comes to
rent

134
Cannibalization of sales by on-line

135
On-line is a different story as it can cannibalize any store at your chain and it is beyond your control. You actually more likely to hurt yourself than your competition

136
Still there are some reasons why as a multichannel you would be ok with some level of cannibalization
Market is going on-line – if you don’t have on-line customer
they may altogether leave you
Some customers will pick-up the things at the store and buy
additional products
You may start managing your stock differently – i.e. long tail
only on-line
You can improve the customer experience without hiring a lot
of people

137
Cannibalization of sales - case study

138
Imagine that you have to estimate the impact of cannibalization of off-line channel by on-line on margins.
139
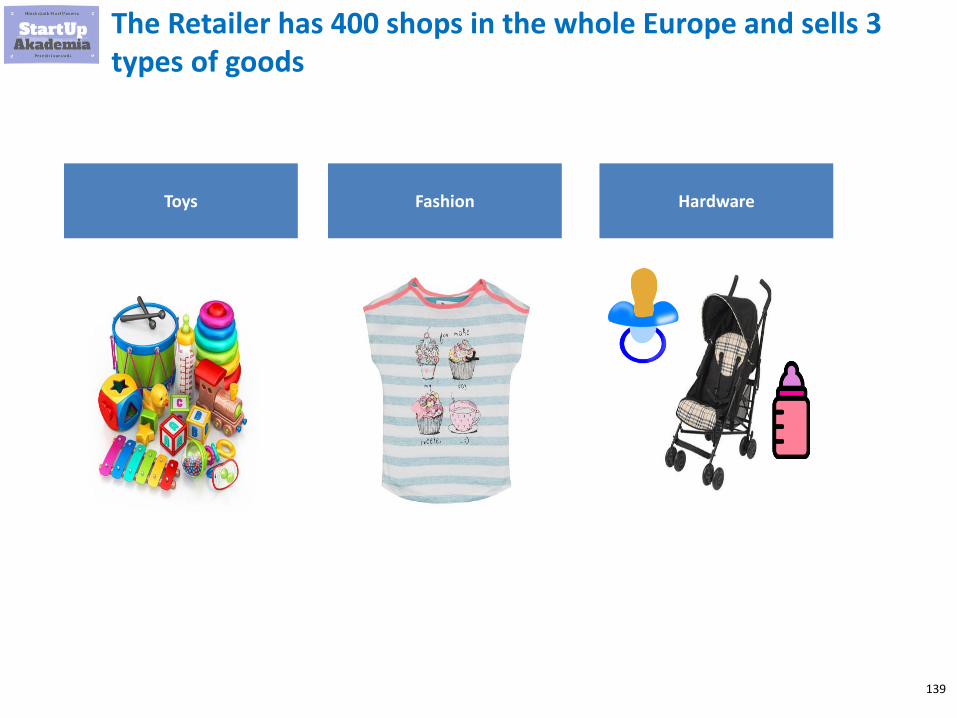
The Retailer has 400 shops in the whole Europe and sells 3 types of goods
Toys Fashion Hardware

140
You have to check which effect is bigger
Margin loss due to cannibalization
▪ For most products you will have lower margins for the same products in on-line sales than in off-line
▪ Difference in margin will be different for different groups
Margin gain from additional purchases generated by on-line
▪ If the product is picked-up at the off-line store you can sell additional products to some of the customers
141
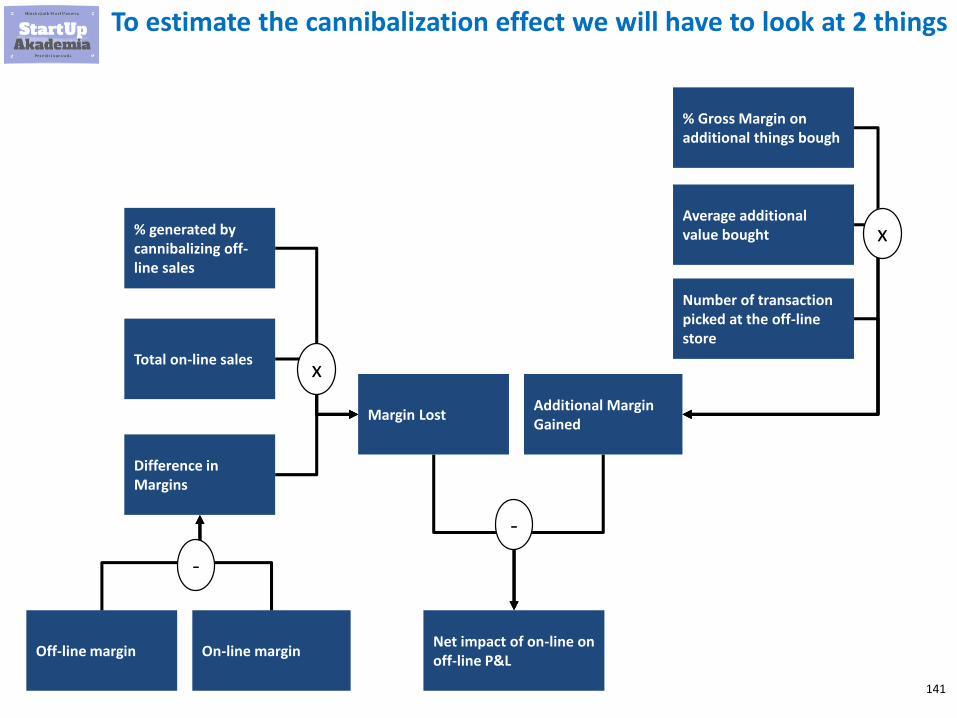
To estimate the cannibalization effect we will have to look at 2 things
Total on-line sales
Difference in Margins
Margin LostAdditional Margin Gained
Net impact of on-line on off-line P&L
-
Off-line margin On-line margin
Average additional value bought
Number of transaction picked at the off-line store
-
% generated by cannibalizing off-line sales
x
% Gross Margin on additional things bough
x
142
This is part of my on-line course where. To see how to carry out all analyses in Excel and get ready-made Excels use the discount offered below
Retail for Business Analysts and Management Consultants
$90$15
Click to check my course

143
Private labels - introduction
144
Private labels are products created for the Retailer and sold under a brand belonging to him (can be named different than Retailer brand)
Retailer brand

145
There are plenty of reasons why it makes sense for retailer to have private labels
You can use it to kill low price brands
Unique products – no way to compare with other channels
Higher margins
Bigger influence on product
Shorter lead time

146
How to analyze private labels?
147
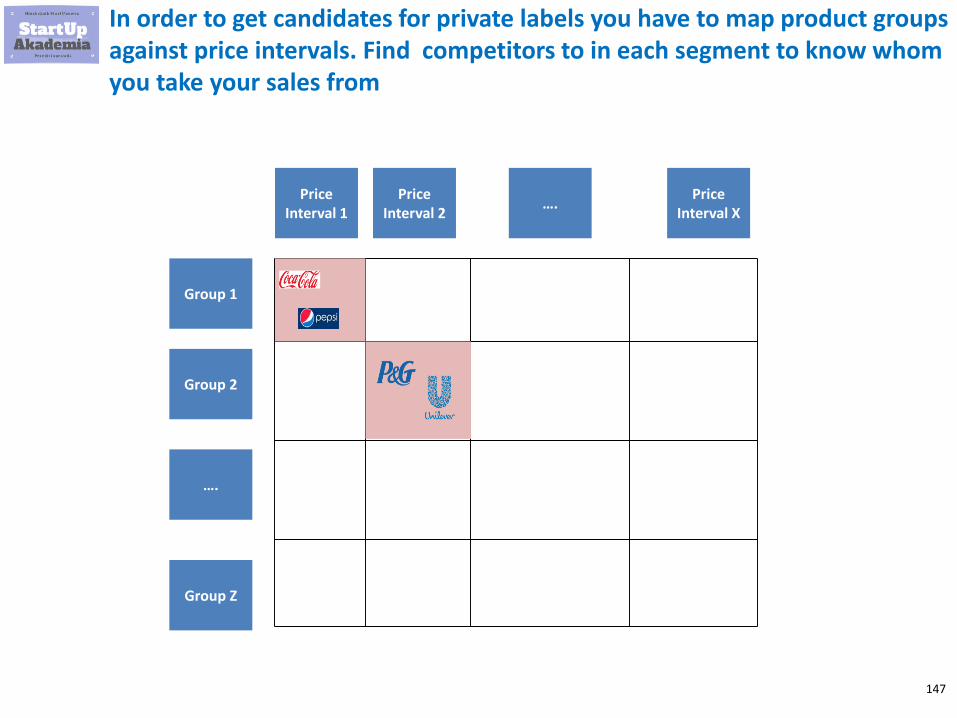
In order to get candidates for private labels you have to map product groups against price intervals. Find competitors to in each segment to know whom you take your sales from
Group 1
Group 2
Group Z
Price Interval 1
Price Interval 2
Price Interval X
….
….
148
In-store engagement and productivity analysis

149
Introduction to in-store engagement
150
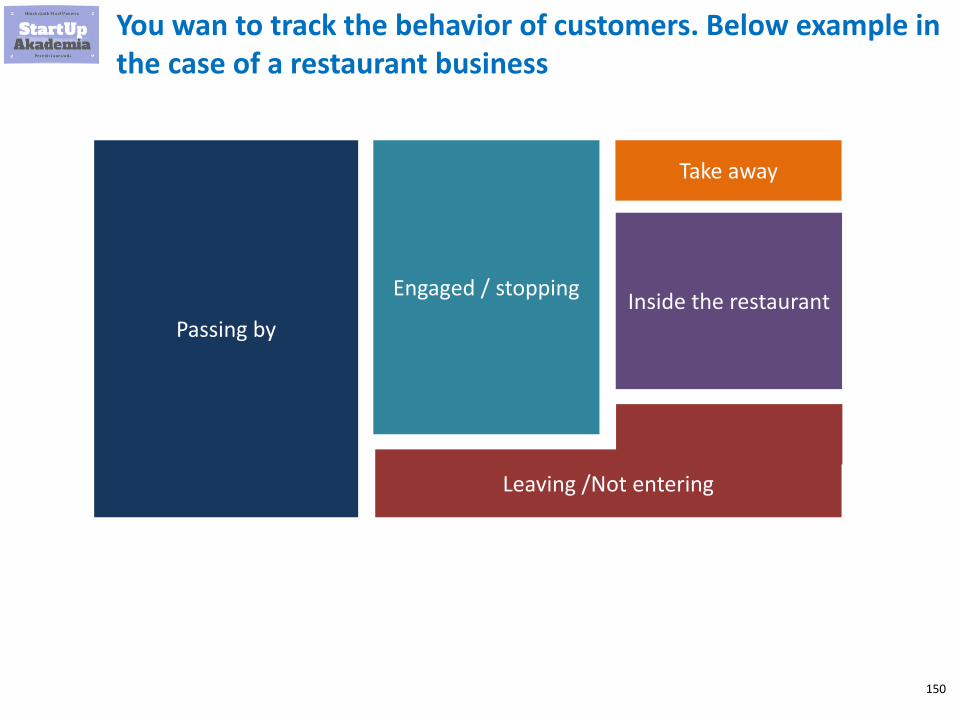
You wan to track the behavior of customers. Below example in the case of a restaurant business
Passing by
Engaged / stopping
Leaving /Not entering
Take away
Inside the restaurant
151
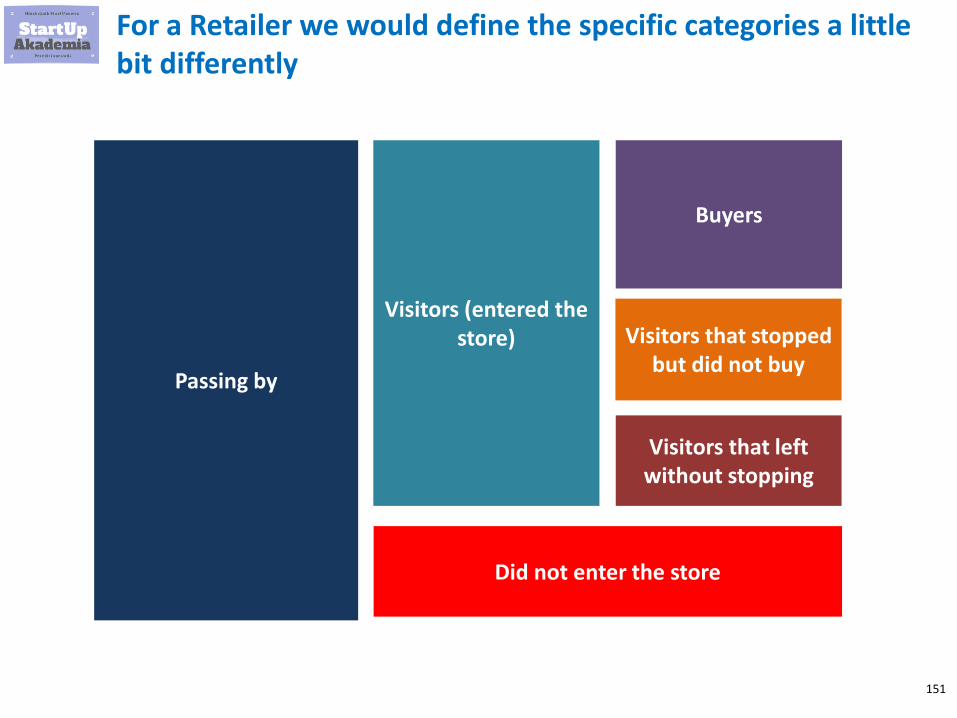
For a Retailer we would define the specific categories a little bit differently
Passing by
Visitors (entered the store)
Visitors that left without stopping
Buyers
Visitors that stopped but did not buy
Did not enter the store

152
You want to do it on the level of specific department so you have to define the physical boundaries of departments
Warehouse
Offices
Warehouse /store racks (shelving)
Cash Till
Employee
Customer

153
Main rules according to which people behave
154
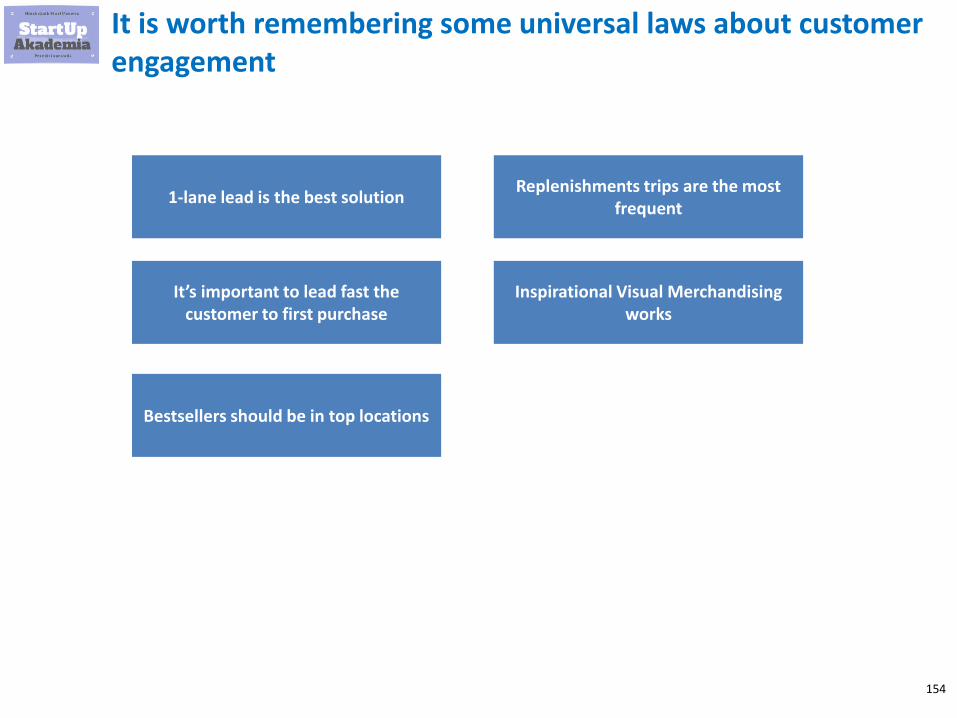
It is worth remembering some universal laws about customer engagement
1-lane lead is the best solution
It’s important to lead fast the customer to first purchase
Bestsellers should be in top locations
Replenishments trips are the most frequent
Inspirational Visual Merchandising works

155
KPIs that you should follow

156
Dwells shows you want attracts customer to enter the store
Number of dwells per department =
▪ number of shoppers who stop in a given zone for longer than defined time

157
Engagement shows you whether specific department has the stopping power
Engagement Rate by departments =
▪ percentage of shoppers walking by a location who stopped at that location
40,0%38,0%
36,0%34,0%
32,0%30,0%
28,0%26,0%
24,0%22,0%
20,0%18,0%
16,0%14,0%
A B C D E F G H I J K L M N
158
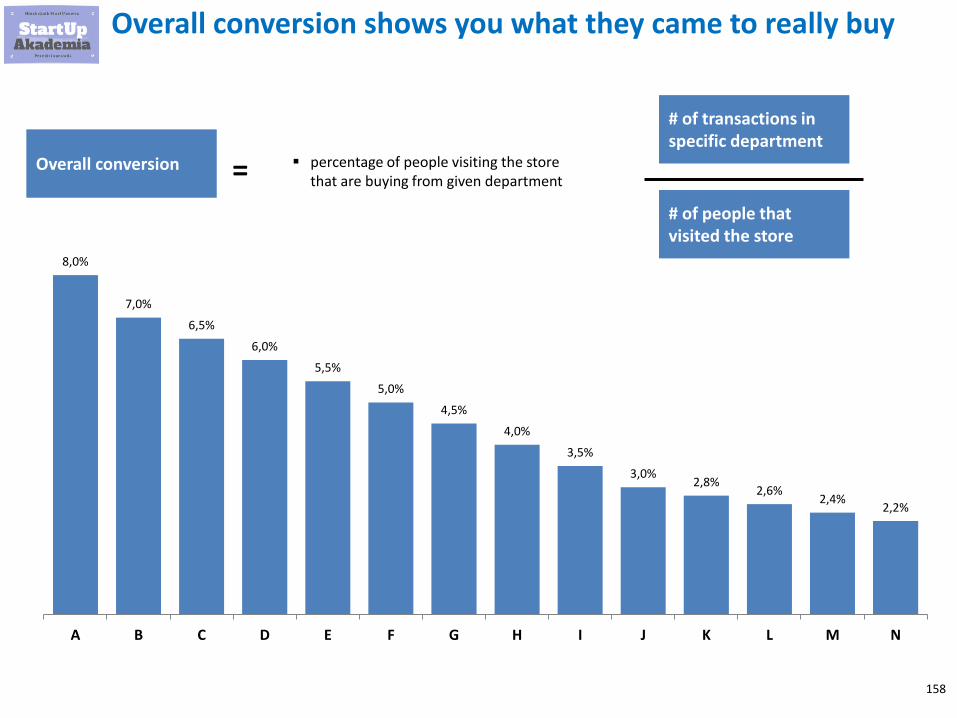
Overall conversion shows you what they came to really buy
Overall conversion = ▪ percentage of people visiting the store that are buying from given department
8,0%
7,0%
6,5%
6,0%
5,5%
5,0%
4,5%
4,0%
3,5%
3,0%2,8%
2,6%2,4%
2,2%
A B C D E F G H I J K L M N
# of transactions in specific department
# of people that visited the store

159
Exposure rate shows you to what extent they reach the product
Exposure Rate by departments =
▪ percentage of shoppers who reach specific location as compared to the total store traffic
# Entries to specific department
# of people that visited the store
=

160
Local conversion tell you how good you are in closing the deal
Local conversion =▪ Number of people that bought from a
specific department divided by the number o people who stopped there
# of transactions in specific department
# of dwells in a specific departments
25,0%
23,0%
21,0%
19,0%
17,0%
15,0%
13,0%
11,0%
9,0%
7,0%
5,0%
3,0%
1,0%
A B C D E F G H I J K L M

161
Shopper Yield shows you the value of visitor expressed in sales
Shopper Yield =▪ Average sale amount for each shopper
visiting the store within a specified period
Total revenues
# of visitors
0,80 0,800,77 0,75 0,77
0,81 0,83 0,81
0,740,80 0,78
0,740,77 0,75
0,80 0,780,84 0,86
0,50
0,790,76 0,74
0,80 0,780,74 0,75 0,73
0,800,74
0,77 0,75
1 2 3 4 5 6 7 8 9 10 11 12 13 14 15 16 17 18 19 20 21 22 23 24 25 26 27 28 29 30 31
0,7

162
On top of that you should look at other interesting metrics
Average visit duration
Average Dwell Time
Structure of visitors by age groups
Breakdown of customers by gender
Number of transactions per sq. m by departments
Sales density departments
Average value of item by department
Number of products per 1 transaction by departments

163
Format - designing new ones

164
Format - introduction

165
When we talk about format there are plenty of issues that have to be set
Look & FeelBrandValue propositionCustomer Experience
Product range
Push vs PullReplenishment
Service Level
Pricing
Customer Experience
Customer Groups
Mission served
Capex Capacity Inventory level

166
This is part of my on-line course where. To see how to carry out all analyses in Excel and get ready-made Excels use the discount offered below
Retail for Business Analysts and Management Consultants
$90$15
Click to check my course

167
You can also find useful some tips on Excel
Essential Excel for Business Analysts and Consultants
A practical guide
presentation
168
Check my presentation other presentations
Essential Lean Manufacturing for Management Consultants
Practical guide how to cut costs
presentation

169
Check my presentation that will help you get into consulting
How to get into consultingPractical guide how to pass the case part
presentation

170
I recommend also looking at some techniques to improve your business. Click on the cover below to go to the presentation
How to become world class analyst
A practical guide
presentation

171
Check also my other presentaions
Management Consulting Presentations
Practical guide how to prepare a great presentation
presentation

172
Check also my other presentations
Production for Management Consultants
Practical guide
presentation

173
Check also business modeling in Excel
Business modelsPractical guide for startups and entrepreneurs
presentation

174
Subscribe to our channels:
www

175
….and how to perform market research
Market researchPractical guide for startups and entrepreneurs
presentation

176
Check my presentation on starting and running consulting company
How to create management consulting presentations?
A practical guide
presentation

177
Check my extensive presentation on productivity hacks to see how you can me 10x more productive
Management consultant productivity hacks
How to be lazy and still get things done
presentation

178
If you need more detailed version on productivity hacks you can check our course on productivity hacks
Click to check my course
Management ConsultingProductivity Hacks
$45$15

179
Check my presentation on restaurant business model to understand it properly
How to open a successful restaurantA practical guide
presentation

180
Check my presentation on on-line models to understand them properly
On-line Business ModeslA practical guide
presentation

181
For more check also my on-line course
Click to check my course
On-line Business Models in Excel –Practical Guide
$45$15
182
Check my presentation on starting and running consulting company
Start and run consulting companyA practical guide
presentation

183
There is an interesting summary of ways to test cheaply businesses
MVP – how to test your business idea without building the
productA practical guide
presentation