Embed Size (px)
Citation preview

REVIEW OF THE NATIONAL FREIGHT
LOGISTICS STRATEGY (NFLS) 2005
Introduction to the Review Process
2 July 2015Transport Forum
1

CONTENTS
1. Problem statement 2005
2. Background
3. Purpose of the NFLS 2005 review
4. Objectives of the Freight Transport Systems
5. Strategic issues
6. Current challenges
7. Status Quo Rail
Road
Rail Road Split
Maritime
Air Cargo
Pipeline
Corridors
8. Project process to date
2

In the executive summary of the NFLS document (2005), the overarchingdeficiencies in the freight logistics systems were identified as follows:
the freight system’s inability to fulfil the demand for cargo movements atprices, levels of service, quality of service and acceptable levels ofreliability in a manner that supports the National DevelopmentStrategies.
This failure stems from an inappropriate institutional and regulatorystructure that does not punish inefficiency and reward efficiency.
It is structural and incapable of appropriately allocating external costsand raising efficiency. Although elements of the system, such as thenational road network, are of a high standard and even surpass thosefound in some developed economies,
it is the system level performance and state of infrastructure that needsattention.
Improvement can only be achieved by an integrated system-levelapproach.
This strategy signals a shift toward demand-driven delivery of freightlogistics services rather than a supply approach”.
PROBLEM STATEMENT 2005
3

1. NFLS 2005 as adopted by Cabinet became the first nationalstrategy that took into cognisance the challenges of theSupply Chain System in its entirety and sort to rectify theshortcomings with strategic interventions which would cutacross the industry.
2. To date DOT together with Freight sub sector have attemptedto implement NFLS proposals, this was not withoutchallenges.
3. With all the unique challenges in the different modes oftransport, within government and in the sub sector ingeneral the DoT now seeks to review the NFLS 2005 in anattempt to achieve the objectives of the Freight industrywhich are the seamless movement of goods and services.
BACKGROUND
4

Analyse NFLS 2005 implementation, shortcomings and challenges Identify gaps with the NFLS 2005 Examine challenges with NFLS 2005 implementation Alignment with Government strategies, NDP2050 and National
Growth Path Develop an internationally appropriate NFLS (international best
practise) The potential of South to South movement (transhipment) Review the status quo of the different freight modes Develop an all- inclusive strategy taking into cognizance all modes
of transport, international bench marking, institutionalframeworks to cater for the industry, roles and responsibilities,intermodal interface, amongst others
Propose tangible strategic interventions Develop an implementation plan
PURPOSE OF THE NFLS 2005 REVIEW
5

Meet demands of industry and economy Optimised total cost-effectiveness Obviate cost distortions and optimise competition Reduce negative externalities, safety, pollution,
congestion and infrastructure damage. Promote national global industrial competitiveness Attract international investment Actively build skills and capacity at all levels Optimise use of resources – land, facilities, and
infrastructure Develop sustainable systems and operations Intermodal interface Intergovernmental spatial planning
OBJECTIVES OF THE FREIGHT TRANSPORT SYSTEMS
6

Institutional arrangements Regulatory framework Operations Environmental and safety issues Back to Rail Strategy Funding Cost of doing business Turn around times Access to the industry (new entries) Alignment to other government policies,
plans and strategies Training and skills development
STRATEGIC ISSUES
7

Road transport operators and operations quality
Lack of general rail freight capacity
Need for rail investment and competition
Need for integration of ports, cities and industry
Need for improved communication and planning with private sector
Need to restructure freight transport authorities
Need for system integration between authorities
Need for skills and capacity building institutions
Need for competent change management
Need for executive commitment to change
Need increased managerial accountability for results
Need to combat corruption and collusion
Flawed institutional arrangements within government
Regulatory framework not efficient
Lack of information
CURRENT CHALLENGES
8

RAIL
ROAD
RAIL ROAD SPLIT
MARITIME
AIRCARGO
PIPELINE
CORRIDOR
9
STATUS QUO

10

11

12
COALLINK LINE
13

OREX IRON ORE LINE
14

APPROXIMATE TONNAGE OF EXPORT AND GENERAL FREIGHT ON RAIL (Million tons)
0
10
20
30
40
50
60
70
80
RAIL
COALLINK 0REX GENERAL FREIGHT BUSINESS(GFB)
15

16

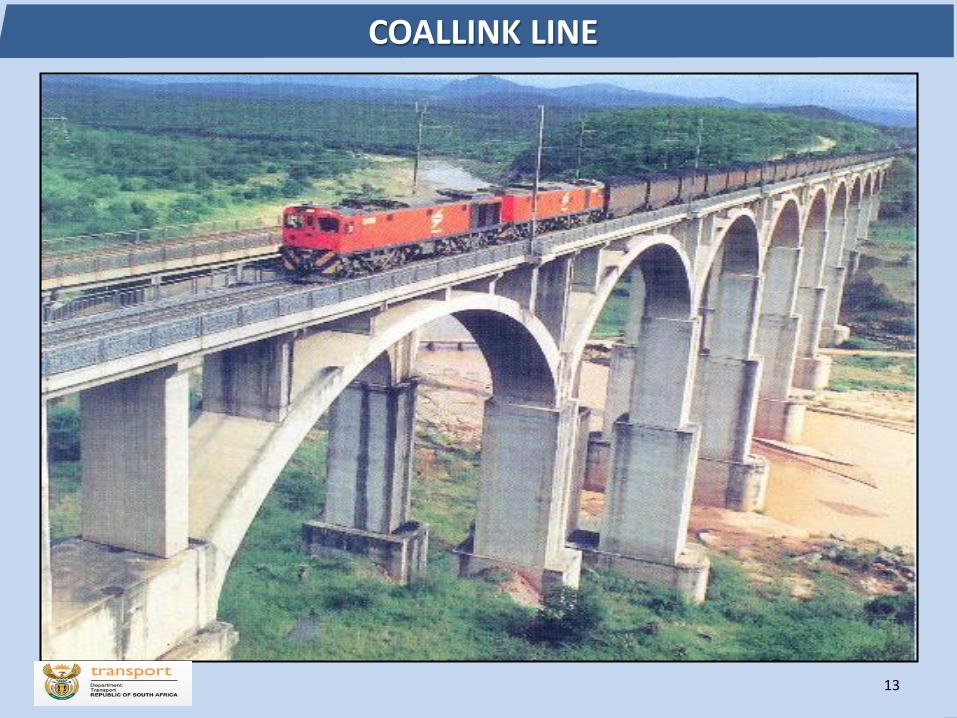
Economics Totally demand driven - demand drives growth – but also lowers quality
Operations: (30% Hire – 70% Own Account) Proportion owner-driver / truckers - proportion of “tied” truckers Total freight cost = Operations costs + public costs - roads/enforcement - emergency
services and other
Quality No entry qualification to industry - No operator licence No operator register and records No Responsible Competent Persons
- Skills deficiencies – Drivers, mechanics, enforcement, management- 65% of vehicles unroadworthy- Overloading- Environmental- Enforcement- Decriminalisation- PPP monitoring agencies- RTMS
Externalities Road user cost recovery - costs accrue to industry [not transporters]
Road usage - payments systems Accidents - safety, monitoring, investigation
RSA ROAD FREIGHT ISSUES
17
18

19

VEHICLE TEST
STATIONS/EQUIPMENT/P
ROCEDURES
ABNORMAL AND
AWKWARD LOADS
OPERATOR
REGISTRATION SYSTEM
DRIVER LICENCE
FORMAT
WEIGHBRIDGE STDS,
MANAGEMENT,
ASSIZING
1. LEGAL ENTITY
REGISTER
ABNORMAL LOAD
PERMIT2. VEHICLES REGISTER DRIVER VISA/CROSS-
WEIGHBRIDGE
OPERATIONS
3. DRIVERS REGISTER BORDER PERMITS MANAGEMENT
4. COMPETENT PERSONS
REGISTER
VEHICLE FITNESS ROAD
WORTHINESS STDS
HAZARDOUS AND
DANGEROUS
GOODS
5. OFFENCES REGISTER
PROFESSIONAL
DRIVER STDS :
ACCREDITATION
WEIGHBRIDGE
CERTIFICATE
6. ACCREDITATION
HAZMAT 7. VOLUNTARY TRAINING STRATEGIC
LICENCE COMPLIANCE COMPETENT NETWORK OF
PERSONS WEIGHBRIDGES
ROAD SIDE INSPECTIONS
STDS/PROCEDURES
THIRD PARTY MV
INSURANCE
RESPONSIBLE WEIGHING
ROAD SIDE INSPECTION
CERTIFICATE
ROAD USER &
CROSS-BORDER
CHARGES
COMPETENT PERSONS
RECORDS BY
TRANSPORT
OPERATOR
VEHICLE OVERLOAD
CONTROL
STANDARDS, AXLE
LOAD LIMITS,
BRIDGE FORMULA,
LAW ENFORCEMENT - STD OPERATING PROCEDURES - COMMON SCHEDULE
OF OFFENSES/FINES
VEHICLE REGULATIONS
AND STANDARDS
GUIDELINES
OPERATIONAL
REGULATIONS
DRIVER TRAINING:
TESTING & LICENCING
VEHICLE EXAMINERS
TRAINING AND
CERTIFICATION
CERTIFICATE OF
VEHICLE FITNESS/ROAD
WORTHINESS
ROAD TRANSPORT REGULATORY FRAMEWORK
20

21

0
100,000,000
200,000,000
300,000,000
400,000,000
500,000,000
600,000,000
700,000,000
800,000,000
MODES
FREIGHT TRANSPORT VOLUMES
ROAD-URBAN DISTRIBUTION
ROAD - RURAL AND PROVINCIAL
ROAD - CORRIDORS
RAIL FREIGHT
PORTS CARGOES
PIPELINES
AIR CARGO
22

ESTIMATED ANNUAL TONS OF FREIGHT TRANSPORTED ON CORRIDORS BY RAIL AND ROAD (2013)
23
Corridor CORRIDOR NAME
ROAD
TONS
RAIL
TONS ROAD % RAIL % FREIGHT COMMODITIES
N3 GAUTENG - DURBAN 44.0 24.0 64.7% 35.3% Containers, Steel, Cars, Coal, Manganese, Fuels, Perishables
N1 SOUTH GAUTENG - CAPE TOWN 17.0 14.0 54.8% 45.2% Cars, Grains, Containers, Perishables, Cement, Steel
N1 NORTH GAUTENG - MUSINA 11.0 4.5 71.0% 29.0% Foods, Fuels, Vehicles, Cement, Perishables, Beverages
N4 WEST GAUTENG - TLOKWENG 4.5 2.0 69.2% 30.8% Fuels, Cement, Containers, Vehicles, Foods
N4 EAST GAUTENG - RESSANO GARCIA 6.6 7.0 48.5% 51.5% Mineral ore, Fruit, Sugar, Timber, Cars, Paper
N7 CAPE TOWN - NAMIBIA 1.8 0.0 100.0% 0.0% Fish, Containers, Fertiliser, Cement, Machinery
N2 SOUTH CAPE TOWN - PORT ELIZABETH 7.0 0.3 95.9% 4.1% Cars, Fuels, Fruit, Perishables, Steel, Tyres
N2 NORTH EAST LONDON - DURBAN 8.1 0.0 100.0% 0.0% Beverages, Foods, Fuels, Cars
N2 NORTH DURBAN - PONGOLA 7.7 5.2 59.7% 40.3% Containers, Fuel, Chemicals, Timber
N5 WINBURG - HARRISMITH 6.5 0.0 100.0% 0.0% Maize, Livestock, Perishables, Steel, Containers
N14 GAUTENG - UPINGTON 3.0 0.7 81.1% 18.9% Foods, Cement, Steel, Machinery, Vehicles, Perishables
N6 EAST LONDON - BLOEMFONTEIN 3.1 1.6 66.0% 34.0% Vehicles, Steel, Grains
N9 GEORGE - COLESBURG 1.0 0.0 100.0% 0.0% Fuels, Grain, Perishables
N10 BRITSTOWN - NAKOP 0.8 0.7 53.3% 46.7% Foods, Cement, Steel, Machinery, Cars, Perishables
N11 LADYSMITH - GROBLERSBRUG 6.9 0.0 100.0% 0.0% Foods, Cement, Steel, Machinery, Vehicles, Perishables
N12 GAUTENG - BEAUFORT WEST 5.0 0.0 100.0% 0.0% Cars, Grains, Containers, Perishables, Cement, Steel
N17 GAUTENG - SWAZILAND 5.6 0.0 100.0% 0.0% Beverages, Cement, Coal, Cars, Grains, Sugar
N8 THABA NCHU - MASERU 1.3 0.0 100.0% 0.0% Containers, Fuels, Cement, Grains, Coal, Foods
COALLINK ERMELO - RICHARDS BAY 0.0 78.0 0.0% 100.0% Coal, Steel, Timber, Chrome
OREX SISHEN - SALDANHA 0.0 62.0 0.0% 100.0% Iron ore, Lead
140.9 200.0 41.3% 58.7%

24
Commodity
Characteristics Commodities
Annual
Volumes
(mill tons
p.a) Typical origins Typical destinations
Primary reason for
modal choice Rail Road
Rail Road mtpa mtpa
Bulk - Coallink export coal 78 Mines Ports 100 0 Full rail facilities 78 0
Bulk - Orex export iron ore 61 Mines Ports 100 0 Full rail facilities 61 0
Bulk - GFB local coal 20 Mines Powerstations 60 40 Some rail facilities 12 8
local iron ore 6 Mines Foundries 70 30 Some rail facilities 4.2 1.8
local coal 3 Mines Factories 50 50 Few rail facilities 1.5 1.5
other minerals 13 Mines Foundries/ports 60 40 Some rail facilities 7.8 5.2
other minerals 4 Quarries Smelters 60 40 Some rail facilities 2.4 1.6
other minerals 3 Smelters Ports 80 20 Some rail facilities 2.4 0.6
Clinker 4 Quarries Factories 80 20 Some rail facilities 3.2 0.8
fuel/chemicals 2 Plants Ports 60 40 Some rail facilities 1.2 0.8
fuel/chemicals 2 Plants Factories/retailers 0 100 Some rail facilities 0 2
steel 2 Foundries Ports 50 50 Some rail facilities 1 1
timber 10 Forest mills /ports 30 70 Some rail facilities 3 7
Other 10 Port/plants ports/plants 80 20 Some rail facilities 8 2
TOTAL BULK 218 Million tons p.a. 185.7 32.3
steel 1 Foundries Wholesaler 1 100 No rail facilities 0.01 1
cars 1 Ports/Plants Ports/ Plants 40 60 Few rail facilities 0.4 0.6
cars 1 Ports/Plants Retailers 20 80 No rail facilities 0.2 0.8
containers 6 Ports/Terminals Plants/terminals 30 70 Few rail facilities 1.8 4.2
containers 8 Ports/Terminals Factories 10 90 No rail facilities 0.8 7.2
chemicals 20 Factories Users 0 100 No rail facilities 0 20
fuel 30 Plant Retailers 0 100 No rail facilities 0 30
agric prods 140 Farms,silos Farms / Mills 20 80 No rail facilities 28 112
industrial goods 600 Ports/factories User industries 0 100 No rail facilities 0 600
FMCG 500 Processors Wholesale/retail 0 100 No rail facilities 0 500
beverages 120 Plants Wholesale/retail 0 100 No rail facilities 0 120
packaging 80 Plants factories/processors 0 100 No rail facilities 0 80
Construction 20 Suppiers Sites 0 100 No rail facilities 0 20
Building 20 Suppiers Sites 0 100 No rail facilities 0 20
Retail 20 distribution stores 0 100 No rail facilities 0 20
TOTAL BREAK BULK 1567 Million tons p.a. 31.21 1535.8
TOTAL LAND FREIGHT 1785 Million tons p.a. 216.91 1568.1
Modal Choice %
Mixed
Casual
Break bulk

25

0
500,000
1,000,000
1,500,000
2,000,000
2,500,000
2003 2004 2005 2006 2007 2008 2009 2010 2011 2012 2013
TE
Us
YEAR
CONTAINERS HANDLED ALL RSA PORTS (2003-2013)
TOTAL LANDED
TOTAL SHIPPED
TRANSHIPPED
TRANSHIPPED
26

27

28

0
20,000,000
40,000,000
60,000,000
80,000,000
100,000,000
120,000,000
140,000,000
160,000,000
180,000,000
2003 2004 2005 2006 2007 2008 2009 2010 2011 2012 2013
TO
NS
YEAR
ALL PORTS RSA - IMPORT AND EXPORT PACK CODE (2003 - 2013)
TOTAL BULK LANDED
TOTAL BULK SHIPPED
TOTAL BREAKBULK LANDED
TOTAL BREAKBULK SHIPPED
TOTAL CARGO LANDED
TOTAL CARGO SHIPPED
29
30

31

Domestic air cargo capacity was reduced when SAA changedto narrow bodied air craft in about 1993, and is now mainlyluggage carried in belly holds of passenger aircrafts.
Domestic airfreight for import and export is mainlytransported by road to OR Tambo.
The precise tonnage of air cargo is not known as there are noofficial records or sources of statistics
International air cargo has reduced significantly from about500,000 tons p.a. to the current estimate of about 300,000tons
The reduction has been due to reduction in manufacturing(and therefore the need for imported components); as wellthe severe reduction in exports of clothing, shoes, textiles,automotive components and electrical equipment due toimport competition.
CHANGES IN THE AIR CARGO MARKET FROM 2005 - 2015
32

33

NATIONAL MULTI-PRODUCT PIPELINE SYSTEM (NMPP)(FINAL CONFIGURATION WITH ALL 5 PHASES COMPLETED (2030)
34

35
Pipelines transport about 17 billion litres of petroleum fuelproducts p.a.
Equal to 850 road tankers per day or 8,5km long train of tankersper day.
Transnet pipeline transports about 50% of the SA refined productfuel requirements and 70% of the Gauteng requirements.
Transnet pipeline transports 100% of the inland Natref Refinery’scrude oil.
Approximately 80% of O.R. Tambo International Airport’s jet fuel.
Methane rich gas (MRG) supplied to industrial customers inNewcastle, Richards Bay and Durban areas.
PIPELINE VOLUMES

36

37
OVERVIEW OF THE SELECTED BORDER POSTS

ESTIMATED ANNUAL TONS TRANSPORTED BY ROAD ON SOUTH AFRICAN IMPORT-EXPORT
CORRIDORS
Beit Bridge 2,856,672
Lebombo 1,566,252
Kopfontein 1,647,720
Skilpadshek 1,051,812
Maseru Bridge 573,048
Oshoek 1,324,692
Groblersbrug 1,642,968
10,663,164
38

The project set up and the task team composition hasbeen defined
A preliminary identification of issues has been done
A process of engagement with transport users andindustries has been initiated
A broader stakeholder consultation will take place oncethe modal review has been completed
Presentation to Interdepartmental Task Team on FreightLogistics - 16 April 2015
PROJECT PROCESS TO DATE
39

40