Embed Size (px)
Citation preview

1
SALARY TRENDS IN SOUTH AFRICA Presentation to Durban Chamber
9 February 2017
Presented by: Lionel van Schalkwijk
Regional Manager KZN
PE Corporate Services [email protected]
031 700 1597
2
P E CORPORATE SERVICES

3
Discussion Points
1. Factors impacting salary increases
2. Actual & Predicted increase trends in SA
3. Possible impact of proposed Minimum Wage
Salary Trends

4
Ec
ono
mic
G
row
th
In
flatio
n
Exch
an
ge
R
ate
F
lu
ctu
atio
ns
Bu
sin
ess C
on
fid
en
ce
Pa
y D
iffe
re
ntia
ls /
In
co
me
In
eq
ua
lity
La
bo
ur L
eg
islatio
n
Un
io
nisatio
n
Me
rit (P
erfo
rm
an
ce
)
Bu
sin
ess S
trate
gie
s a
nd
grow
th
Economic Environment
Factors impacting salary increases
5
0.0%
2.0%
4.0%
6.0%
2010 2011 2012 2013 2014 2015
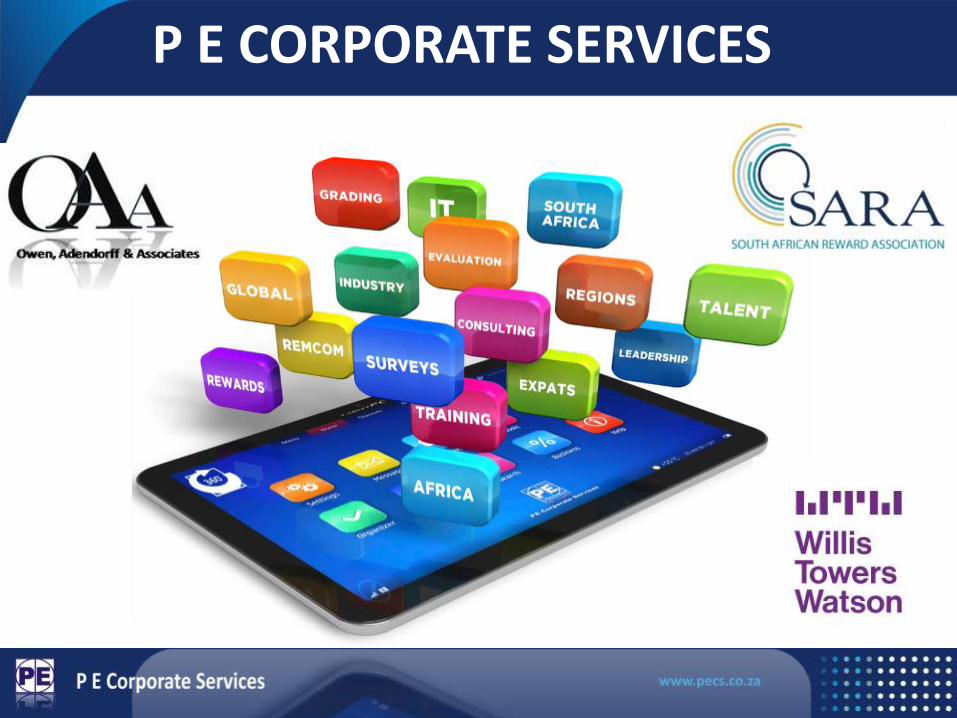
Gross Domestic Product in South Africa
GDP Growth in 2016 • First Quarter = -1.2% • Second Quarter = 3.5% • Third Quarter = 0.2%
IMF Economic Growth Forecast for SA: 2016 = 0.1%, 2017 = 0.8%
Economic Growth
6
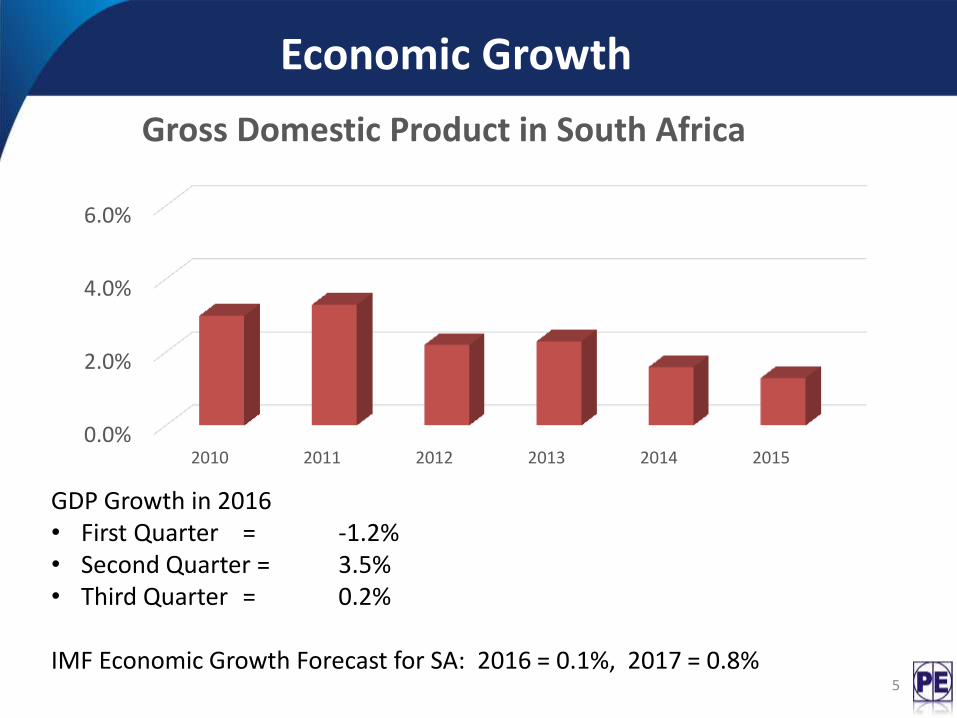
Inflation Year Jan Feb Mar Apr May Jun Jul Aug Sep Oct Nov Dec Ave
2011 3.7 3.7 4.1 4.2 4.5 5 5.3 5.3 5.7 6 6.1 6.1 5
2012 6.3 6.1 6 6.1 5.7 5.5 4.9 5 5.5 5.6 5.6 5.7 5.6
2013 5.4 5.9 5.9 5.9 5.6 5.5 6.3 6.4 6 5.5 5.3 5.4 5.7
2014 5.8 5.9 6 6.1 6.6 6.6 6.3 6.4 5.9 5.9 5.8 5.3 6.1
2015 4.4 3.9 4.0 4.5 4.6 4.7 5.0 4.6 4.6 4.7 4.8 5.2 4.6
2016 6.2 7.0 6.3 6.2 6.1 6.3 6.0 5.9 6.1 6.4 6.6 6.8 6.4
Inflation to remain outside the target range of 3% to 6% for 2017?
• Current petrol price in 2017 to R13.14 (unleaded 95, coastal) – upward trend?
• Repo rate increased by 50 basis points (28 Jan 16) and 25 basis points (17 Mar 2016) to 7 percent pushing prime rate to 10.5 percent (possibility of more increases in 2017?)
• Drought - Expected increases in food prices • Volatility in the value of the Rand
7
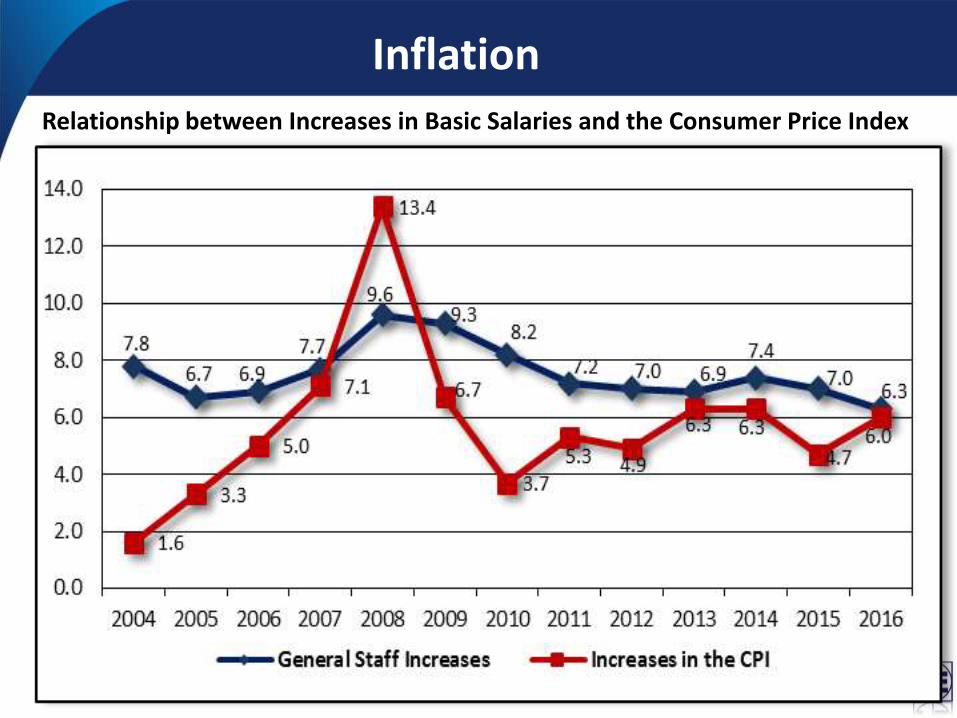
Relationship between Increases in Basic Salaries and the Consumer Price Index
Inflation
8
5.00
7.00
9.00
11.00
13.00
15.00
17.00
19.00
03/01/2010 03/01/2011 03/01/2012 03/01/2013 03/01/2014 03/01/2015 03/01/2016 03/01/2017
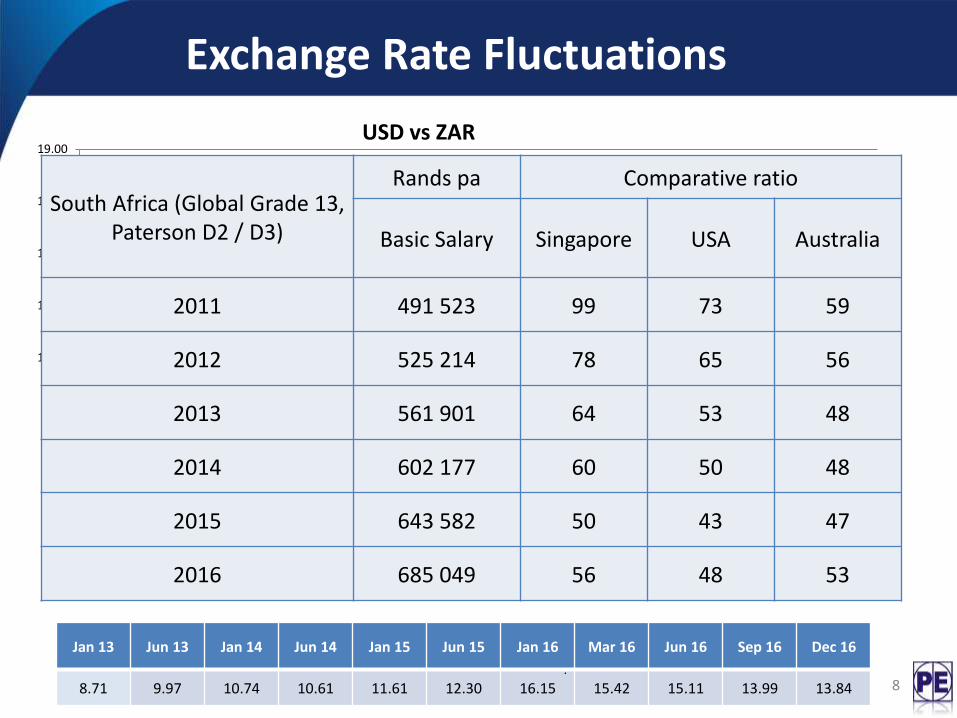
USD vs ZAR
Exchange Rate Fluctuations
Jan 13 Jun 13 Jan 14 Jun 14 Jan 15 Jun 15 Jan 16 Mar 16 Jun 16 Sep 16 Dec 16
8.71 9.97 10.74 10.61 11.61 12.30 16.15 15.42 15.11 13.99 13.84
.
The average Rand values against the US Dollar for selected months is depicted in the table below
South Africa (Global Grade 13, Paterson D2 / D3)
Rands pa Comparative ratio
Basic Salary Singapore USA Australia
2011 491 523 99 73 59
2012 525 214 78 65 56
2013 561 901 64 53 48
2014 602 177 60 50 48
2015 643 582 50 43 47
2016 685 049 56 48 53
9
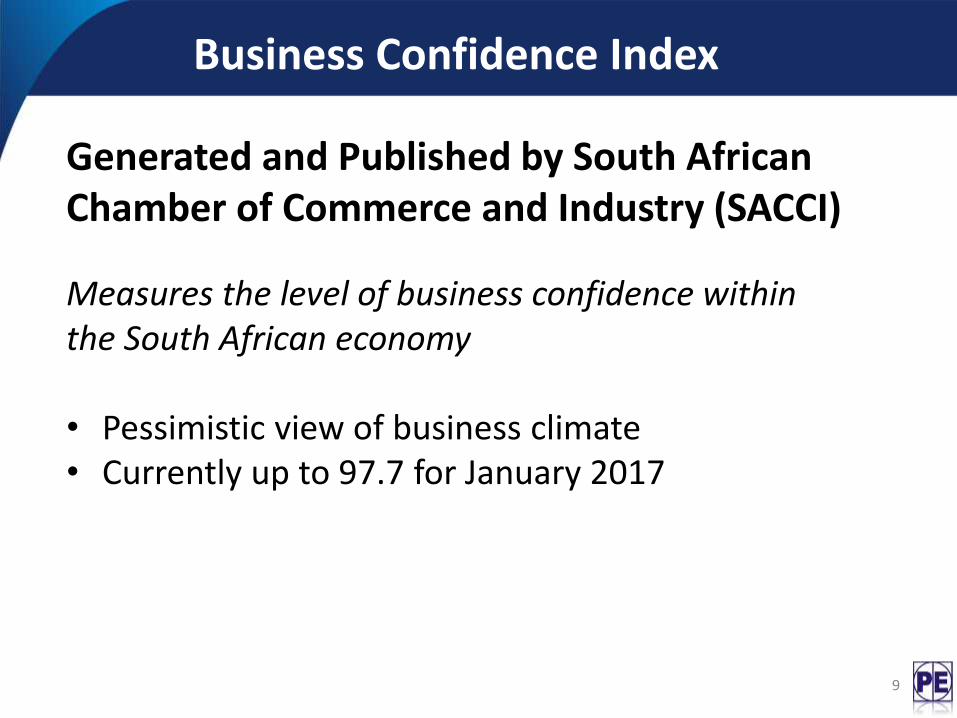
Business Confidence Index
Generated and Published by South African Chamber of Commerce and Industry (SACCI)
Measures the level of business confidence within the South African economy • Pessimistic view of business climate • Currently up to 97.7 for January 2017
10 10 February 2017 P-E Corporate Services SA
Pay Differentials
A pay differential can be defined as the ratio reflecting the difference between total remuneration or earnings between different individual employees or groups of employees within an organisation.
• Company Wage Gap
• Equal pay for Work of Equal Value

11
Salary increase Trends
10 February 2017 Copyright held P-E Corporate Services SA 11
EMPLOYEE CATEGORY
Annual Percentage
Increase in Basic Salary
Annual Percentage Increase in
Guaranteed Pay
Weighted Average Increase
per Category
Executives / Top Management 6.2 (6.3) 6.1 (6.5) 6.1 (6.5)
Management 6.2 (6.5) 6.0 (6.8) 6.1 (6.6)
Professional / Junior Management 6.4 (7.0) 6.2 (6.9) 6.3 (7.0)
Client Services / Sales 6.2 (6.8) 6.1 (6.8) 6.1 (6.9)
General Admin / Support Staff 6.4 (7.3) 6.3 (6.9) 6.4 (7.1)
Lower Level Staff 6.8 (7.5) 6.5 (7.1) 6.6 (7.2)
ALL STAFF 6.4 (7.0) 6.2 (6.9) 6.3 (6.9)
AVERAGE ANNUAL INCREASES IN REMUNERATION LEVELS BY EMPLOYEE CATEGORY (AUGUST 2015 - JULY 2016) GREEN FIGURES = PREVIOUS YEAR

12
Salary increase Trends
10 February 2017 Copyright held P-E Corporate Services SA 12
EMPLOYEE CATEGORY
Annual Percentage
Increase in Basic Salary
Annual Percentage Increase in
Guaranteed Pay
Weighted Average Increase
per Category
Executives / Top Management 6.2 (6.4) 6.1 (6.6) 6.1
Management 6.2 (6.7) 6.0 (6.6) 6.1
Professional / Junior Management 6.4 (6.5) 6.2 (6.5) 6.3
Client Services / Sales 6.2 (6.3) 6.1 (6.6) 6.1
General Admin / Support Staff 6.4 (6.8) 6.3 (6.9) 6.4
Lower Level Staff 6.8 (7.2) 6.5 (7.7) 6.6
ALL STAFF 6.4 6.2 6.3
AVERAGE ANNUAL INCREASES IN REMUNERATION LEVELS BY EMPLOYEE CATEGORY (AUGUST 2015 - JULY 2016) RED FIGURES = SNAP SHOT SURVEY FOR KZN (NOV 2016)
13
Market Trends
10 February 2017 P-E Corporate Services SA
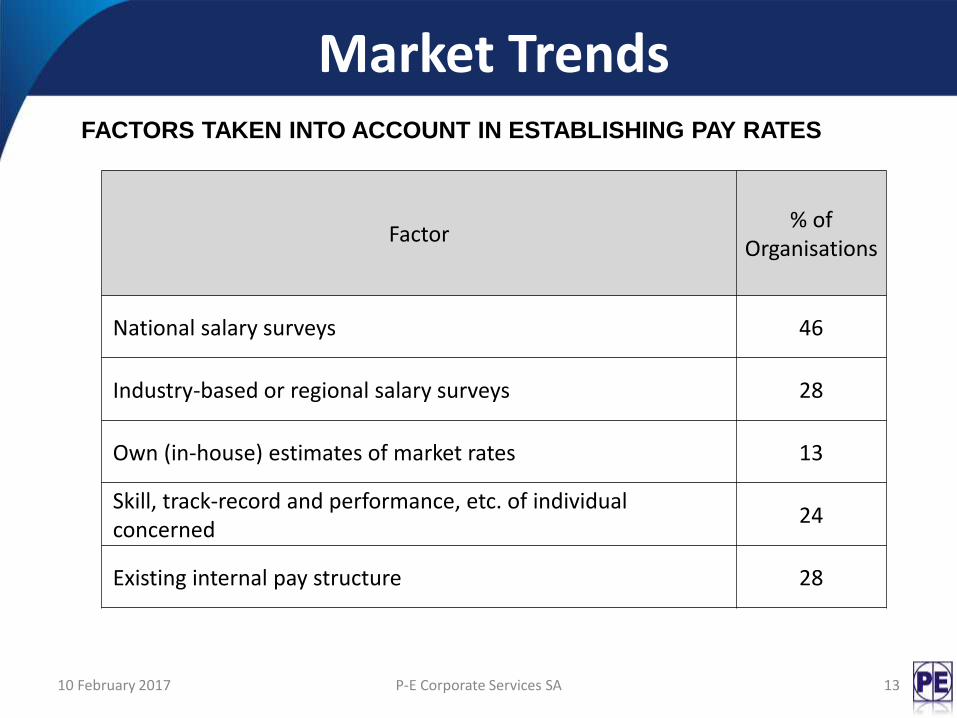
Factor % of
Organisations
National salary surveys 46
Industry-based or regional salary surveys 28
Own (in-house) estimates of market rates 13
Skill, track-record and performance, etc. of individual concerned
24
Existing internal pay structure 28
FACTORS TAKEN INTO ACCOUNT IN ESTABLISHING PAY RATES
14
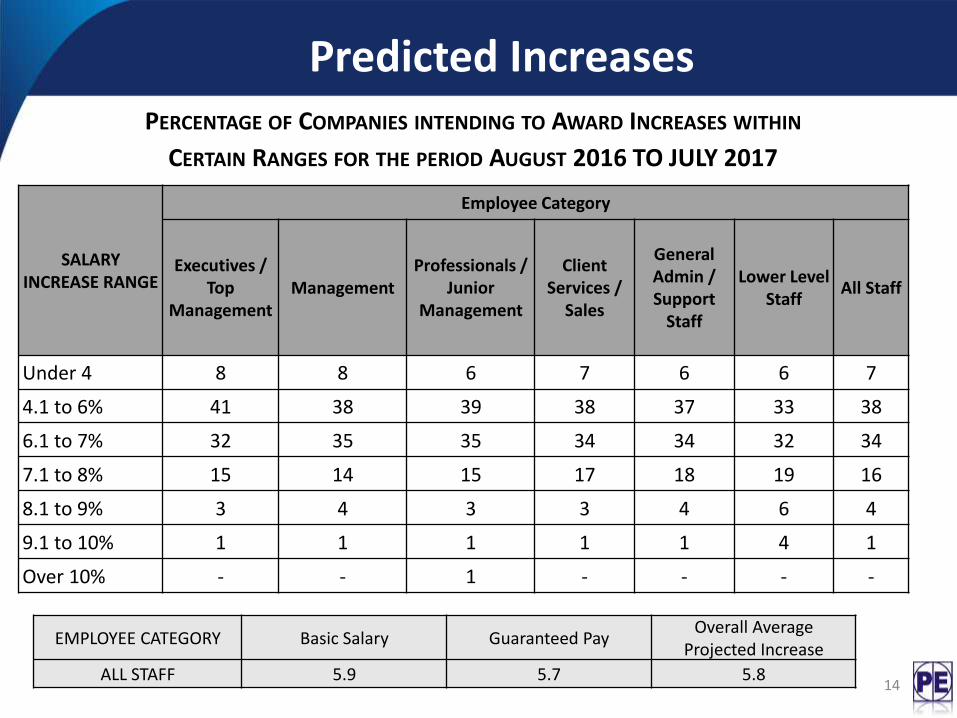
Predicted Increases
SALARY INCREASE RANGE
Employee Category
Executives / Top
Management Management
Professionals / Junior
Management
Client Services /
Sales
General Admin / Support
Staff
Lower Level Staff
All Staff
Under 4 8 8 6 7 6 6 7
4.1 to 6% 41 38 39 38 37 33 38
6.1 to 7% 32 35 35 34 34 32 34
7.1 to 8% 15 14 15 17 18 19 16
8.1 to 9% 3 4 3 3 4 6 4
9.1 to 10% 1 1 1 1 1 4 1
Over 10% - - 1 - - - -
PERCENTAGE OF COMPANIES INTENDING TO AWARD INCREASES WITHIN
CERTAIN RANGES FOR THE PERIOD AUGUST 2016 TO JULY 2017
EMPLOYEE CATEGORY Basic Salary Guaranteed Pay Overall Average
Projected Increase
ALL STAFF 5.9 5.7 5.8
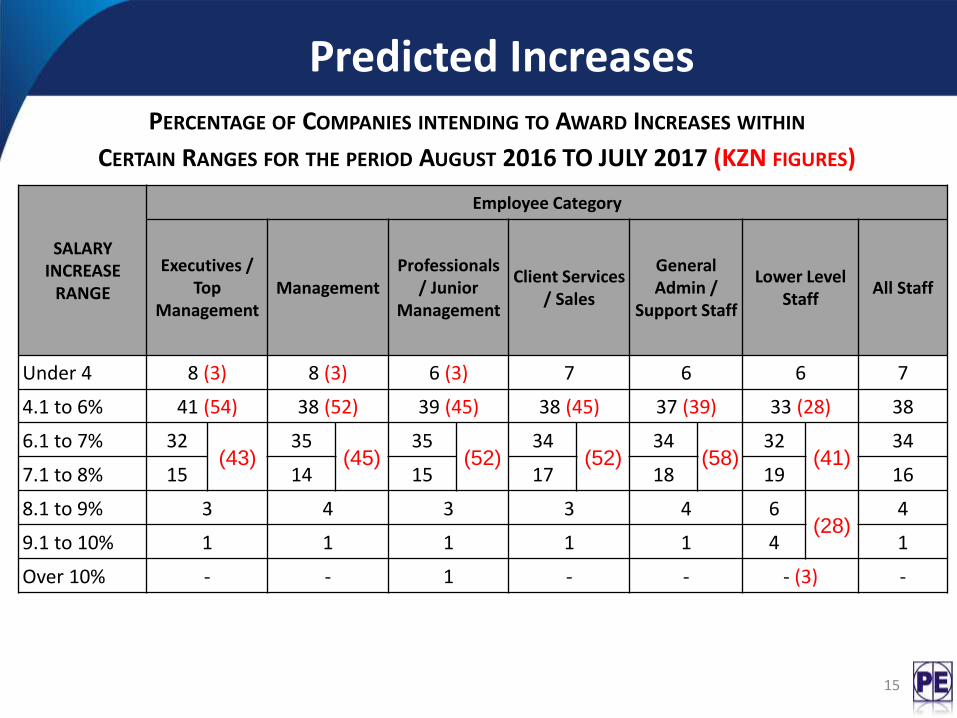
15
SALARY INCREASE
RANGE
Employee Category
Executives / Top
Management Management
Professionals / Junior
Management
Client Services / Sales
General Admin /
Support Staff
Lower Level Staff
All Staff
Under 4 8 (3) 8 (3) 6 (3) 7 6 6 7
4.1 to 6% 41 (54) 38 (52) 39 (45) 38 (45) 37 (39) 33 (28) 38
6.1 to 7% 32 (43)
35 (45)
35 (52)
34 (52)
34 (58)
32 (41)
34
7.1 to 8% 15 14 15 17 18 19 16
8.1 to 9% 3 4 3 3 4 6 (28)
4
9.1 to 10% 1 1 1 1 1 4 1
Over 10% - - 1 - - - (3) -
PERCENTAGE OF COMPANIES INTENDING TO AWARD INCREASES WITHIN
CERTAIN RANGES FOR THE PERIOD AUGUST 2016 TO JULY 2017 (KZN FIGURES)
Predicted Increases
16
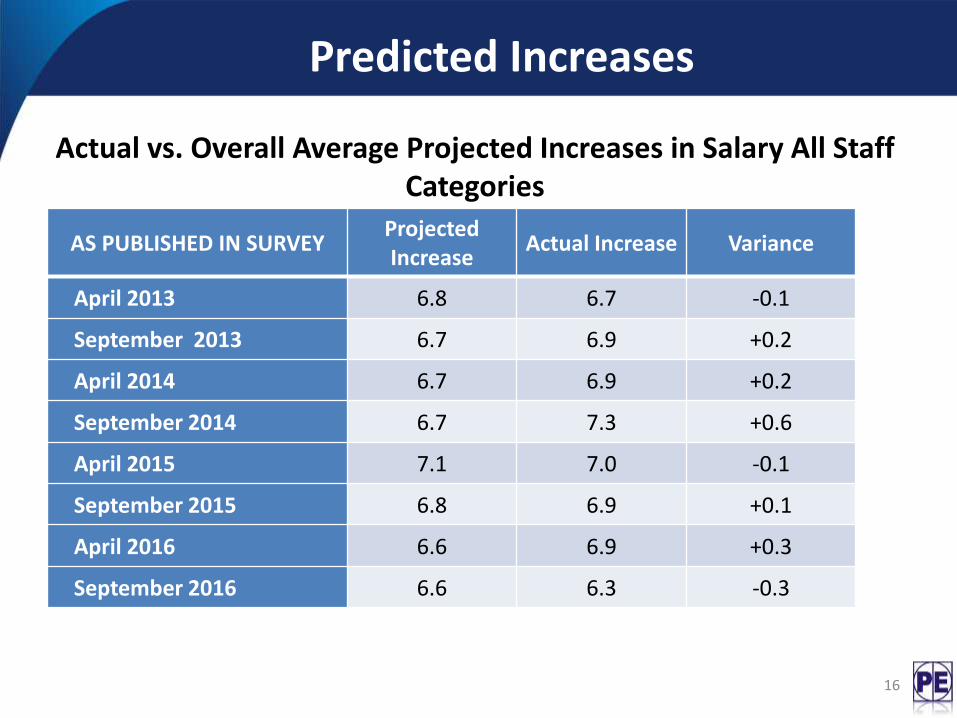
AS PUBLISHED IN SURVEY Projected Increase
Actual Increase Variance
April 2013 6.8 6.7 -0.1
September 2013 6.7 6.9 +0.2
April 2014 6.7 6.9 +0.2
September 2014 6.7 7.3 +0.6
April 2015 7.1 7.0 -0.1
September 2015 6.8 6.9 +0.1
April 2016 6.6 6.9 +0.3
September 2016 6.6 6.3 -0.3
Actual vs. Overall Average Projected Increases in Salary All Staff Categories
Predicted Increases
17
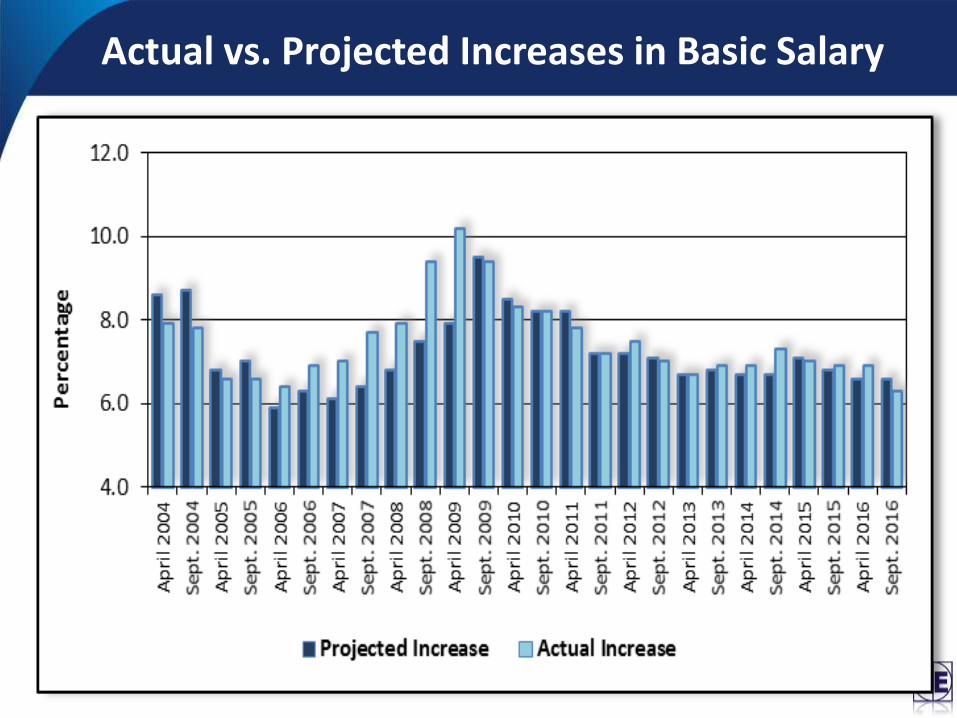
Actual vs. Projected Increases in Basic Salary
18
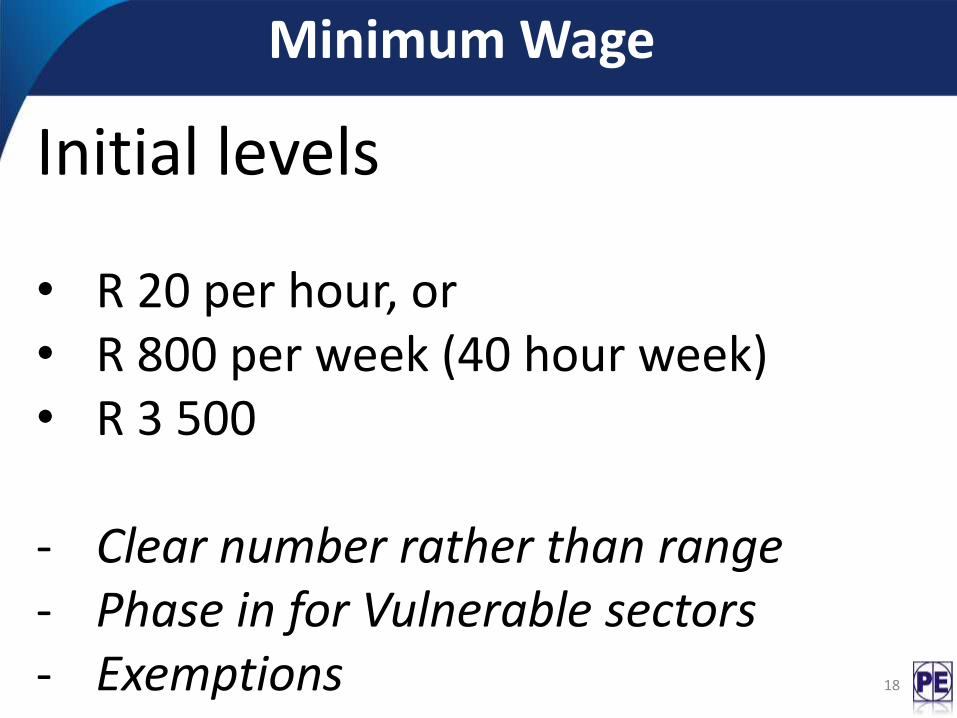
Minimum Wage
Initial levels • R 20 per hour, or • R 800 per week (40 hour week) • R 3 500
- Clear number rather than range - Phase in for Vulnerable sectors - Exemptions

19
Minimum Wage Timeline
• December 2016 (Publication of basic details)
• 1 July 2017 (Legislation enacted)
• 1 July 2017 (Decent Work Commission & NMW established)
• 1 July 2017 – 30 June 2019 (Transitional arrangements)
• 1 July 2019 (Universal coverage)

Corporate minimum wages
37 per cent of participants note that they have a minimum wage rate as a lower level guideline pay limit
Minimum Wage Rates: 2004 to 2016

10 February 2017 Copyright held P-E Corporate Services SA 21
Concluding remarks on Salary increases
Staff Categories *Average PREDICTED %
increase – 2017
Executives 4.0 – 6.5%
Management 4.5 - 7.0%
Specialists 5.0 - 7.0%
General Staff 4.5 – 6.5%
Lower Skilled Employees 5.5 - 9.0%
*It is important to note that more than 78% of organisations are predicting increases below 7% for 2017
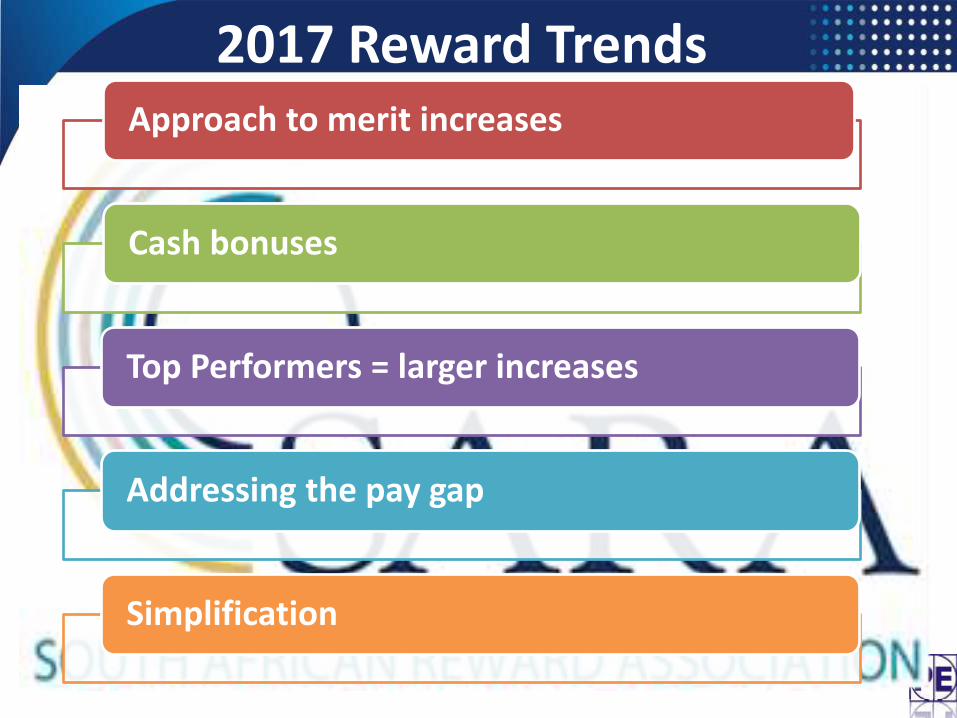
Approach to merit increases
Cash bonuses
Top Performers = larger increases
Addressing the pay gap
Simplification
2017 Reward Trends
24