Embed Size (px)
Citation preview
Rising health spending but who benefits
Presented by Sarina Fisher
Centre for International Economics
www.TheCIE.com.au
28 July 2015
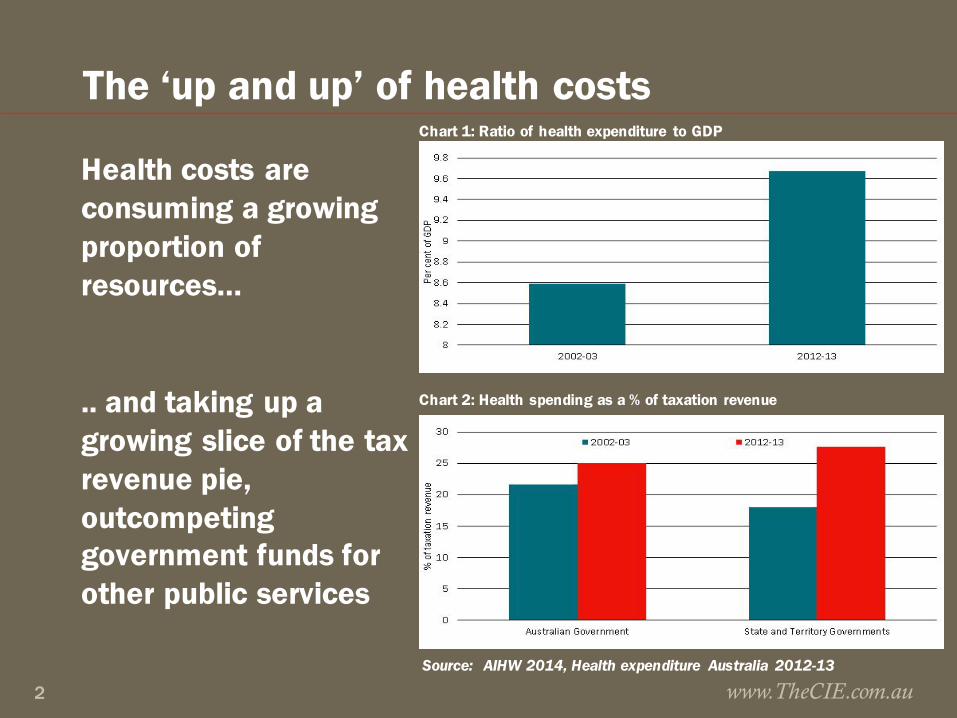
The ‘up and up’ of health costs
Health costs are consuming a growing proportion of resources…
.. and taking up a growing slice of the tax revenue pie, outcompeting government funds for other public services
www.TheCIE.com.au2
Chart 1: Ratio of health expenditure to GDP
Chart 2: Health spending as a % of taxation revenue
Source: AIHW 2014, Health expenditure Australia 2012-13
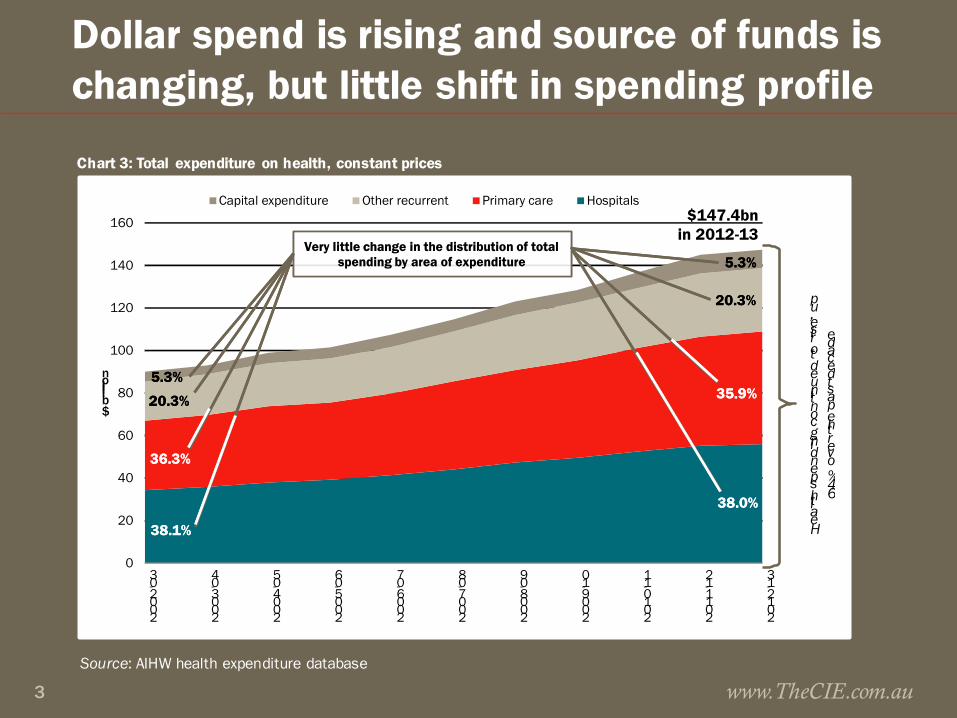
Dollar spend is rising and source of funds is changing, but little shift in spending profile
www.TheCIE.com.au3
0
20
40
60
80
100
120
140
160
2002-03
2003-04
2004-05
2005-06
2006-07
2007-08
2008-09
2009-10
2010-11
2011-12
2012-13
$ billion
Capital expenditure Other recurrent Primary care Hospitals
5.3%
5.3%
20.3%
20.3%
36.3%
38.1%
35.9%
38.0%
Very little change in the distribution of total spending by area of expenditure
5.3%
5.3%
20.3%
20.3%
36.3%
38.1%
35.9%
38.0%
Very little change in the distribution of total spending by area of expenditure
$147.4bn in 2012-13
Health spending continued to rise, up
64%over the past decade
Source: AIHW health expenditure database
Chart 3: Total expenditure on health, constant prices
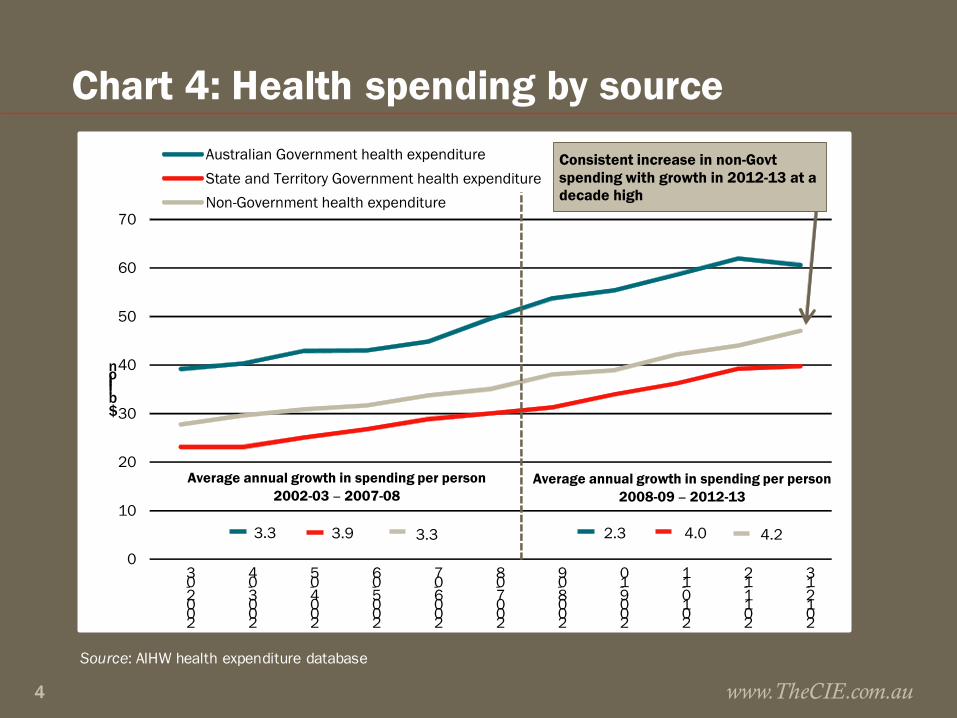
Chart 4: Health spending by source
www.TheCIE.com.au4
0
10
20
30
40
50
60
70
2002-03
2003-04
2004-05
2005-06
2006-07
2007-08
2008-09
2009-10
2010-11
2011-12
2012-13
$ billion
Australian Government health expenditureState and Territory Government health expenditureNon-Government health expenditure
Average annual growth in spending per person2002-03 − 2007-08
Average annual growth in spending per person2008-09 − 2012-13
3.3 3.9 3.3 4.24.02.3
Consistent increase in non-Govt spending with growth in 2012-13 at a decade high
Source: AIHW health expenditure database
Everyone is spending more on hospitals■ Hospital spending accounts for 38% of health spending, but
takes the lions share of state and territory health budgets (70%), and is increasing as a share of non-government health spending (27%)
■ PHI’s hospital spending budget is increasingly making room for public hospital spending
■ Policy is driving up individual spending on hospitals. Following the 2008 increase in the MLS income threshold, growth in individual spending on hospitals has averaged 25%, compared to 6% for PHI and 4% for government
■ Individual spending on private hospitals has been strongest, averaging 31% p.a. over past 5 years, possibly reflecting the drift to exclusionary and excess/ co-payment products
www.TheCIE.com.au5
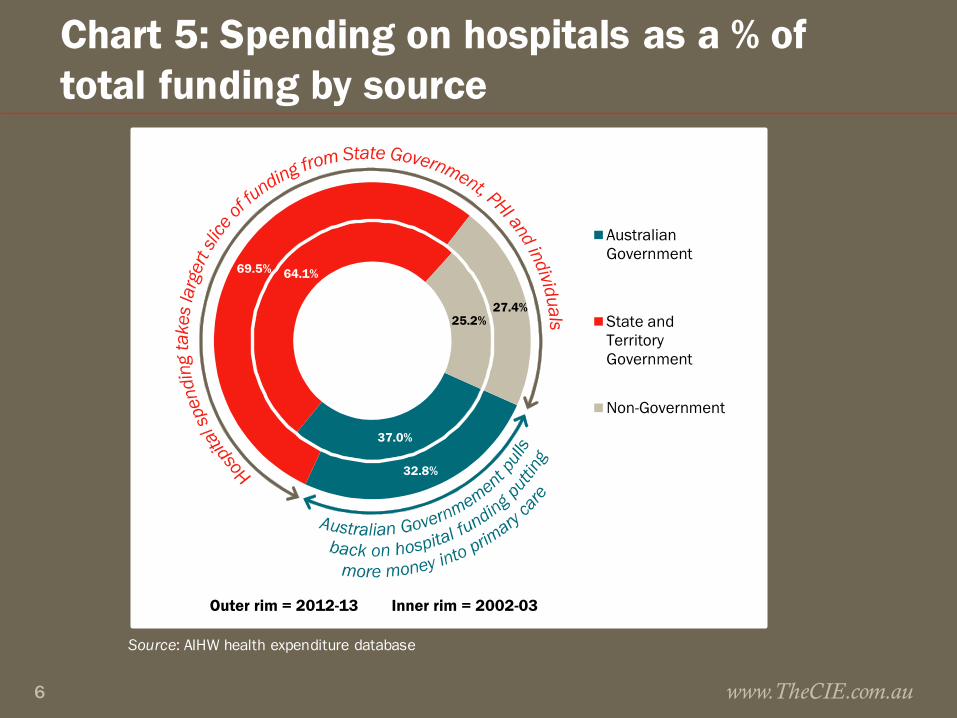
Chart 5: Spending on hospitals as a % of total funding by source
www.TheCIE.com.au6
Source: AIHW health expenditure database
37.0%
64.1%
25.2%
32.8%
69.5%
27.4%
AustralianGovernment
State andTerritoryGovernment
Non-Government
Outer rim = 2012-13 Inner rim = 2002-03
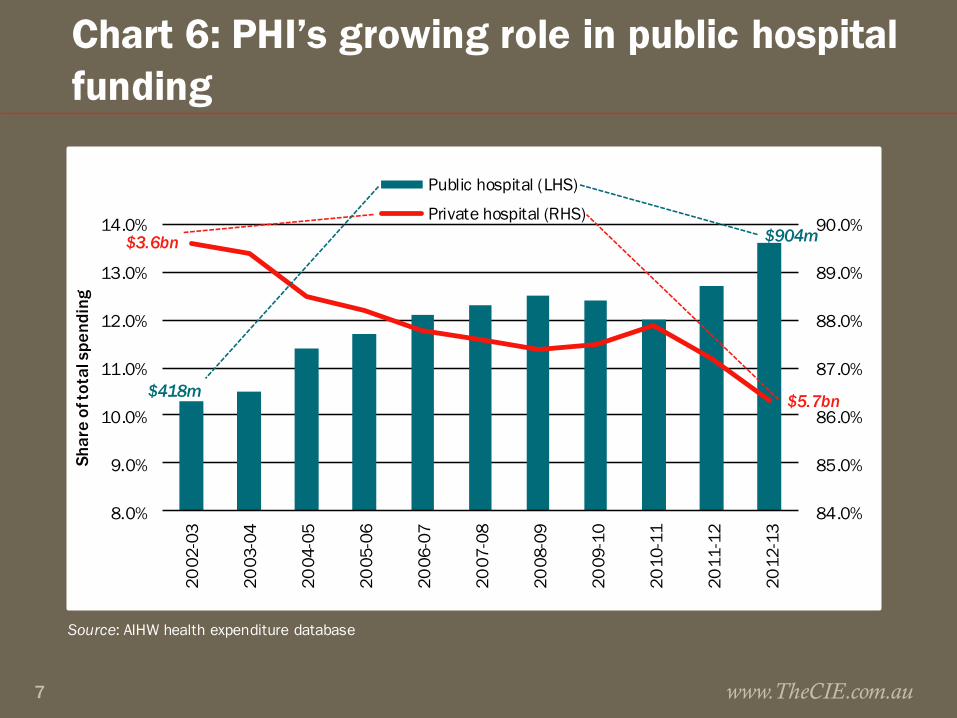
Chart 6: PHI’s growing role in public hospital funding
www.TheCIE.com.au7
Source: AIHW health expenditure database
84.0%
85.0%
86.0%
87.0%
88.0%
89.0%
90.0%
8.0%
9.0%
10.0%
11.0%
12.0%
13.0%
14.0%
2002
-03
2003
-04
2004
-05
2005
-06
2006
-07
2007
-08
2008
-09
2009
-10
2010
-11
2011
-12
2012
-13
Shar
e of
tota
l spe
ndin
g
Public hospital (LHS)
Private hospital (RHS)
$3.6bn
$5.7bn$418m
$904m
Key policy drivers impacting on individual health spend■ Medicare pays 75% of scheduled fee for private patients in
public/private hospital, and 85% of scheduled fee for a specialist, patients pay gap plus any above-schedule fee
■ 2010-11 Medicare levy introduced (1.5%). 1 July 2012 new income thresholds introduced with higher rates of the surcharge for high income earners
■ 1 July 2015, general patients pay $5 for each PBS prescription and $145.30 more to reach the safety net for concessional rate (lesser rises for concession card holders)
■ 1 July 2015, patients may pay (optional) $5 towards bulk billed standard GP consults and out-of-hospital pathology and imaging services. States and Territories allowed to introduce contributions for GP equivalent visits to EDwww.TheCIE.com.au8
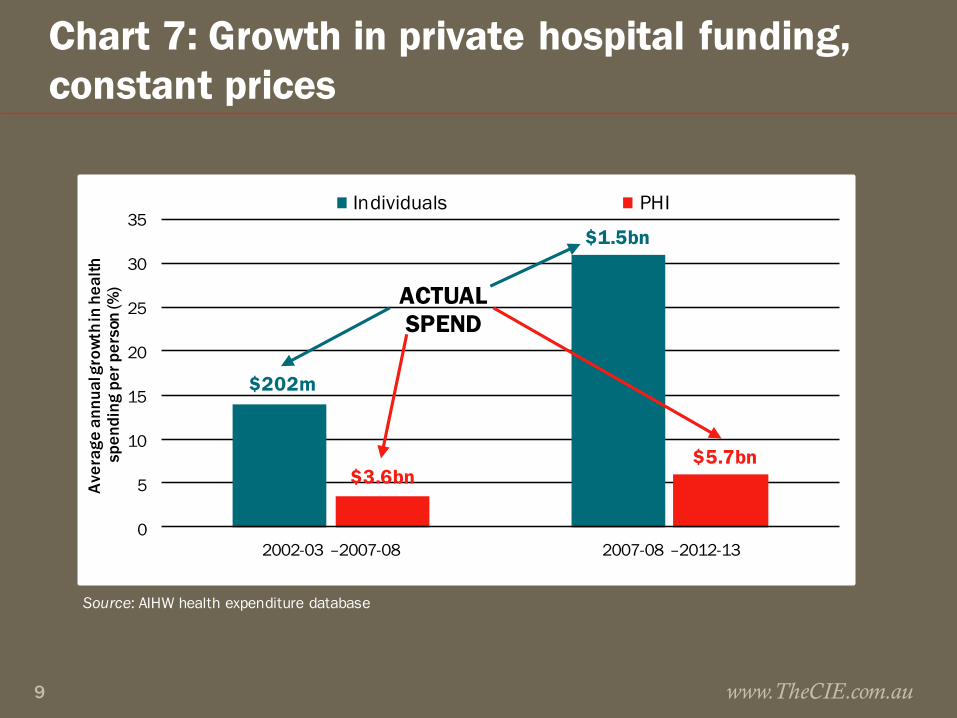
Chart 7: Growth in private hospital funding, constant prices
www.TheCIE.com.au9
Source: AIHW health expenditure database
0
5
10
15
20
25
30
35
2002-03 –2007-08 2007-08 –2012-13
Ave
rage
ann
ual g
row
th in
hea
lth
spen
ding
per
per
son
(%)
Individuals PHI
$202m
$3.6bn$5.7bn
$1.5bn
ACTUALSPEND
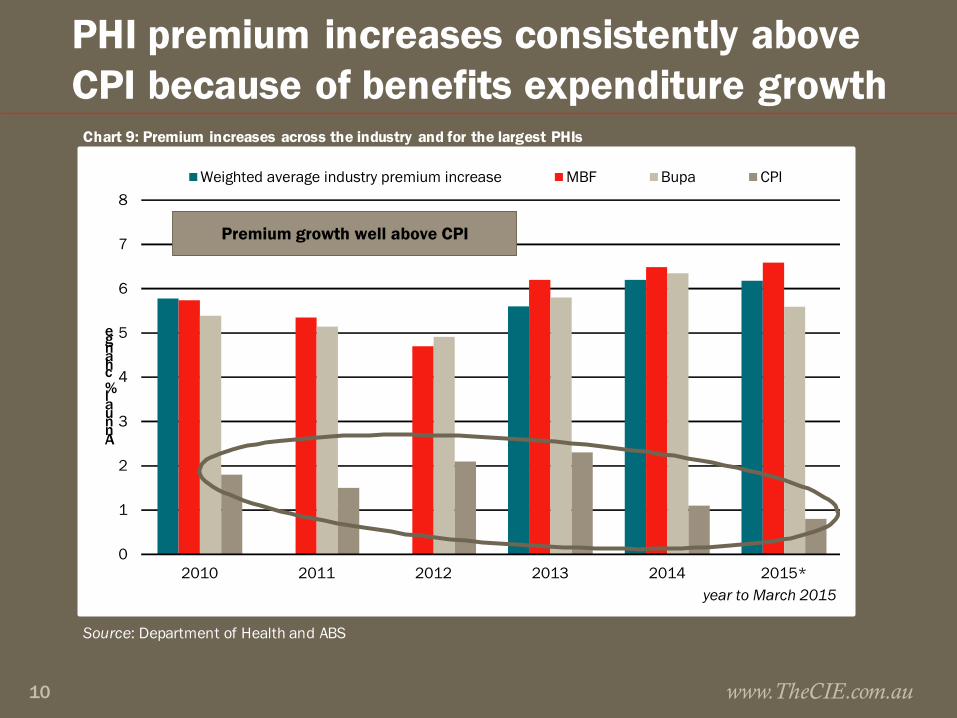
PHI premium increases consistently above CPI because of benefits expenditure growth
www.TheCIE.com.au10
Source: Department of Health and ABS
0
1
2
3
4
5
6
7
8
2010 2011 2012 2013 2014 2015*
Annual % change
year to March 2015
Weighted average industry premium increase MBF Bupa CPI
Premium growth well above CPI
Source: Department of Health and ABS
Chart 9: Premium increases across the industry and for the largest PHIs
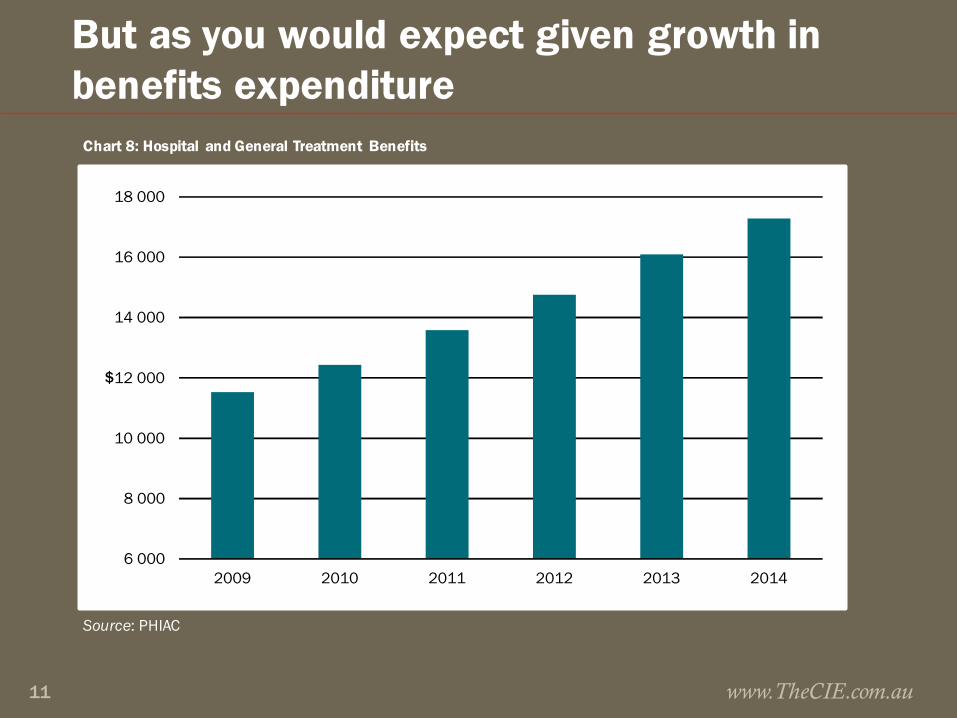
But as you would expect given growth in benefits expenditure
www.TheCIE.com.au11
Source: PHIAC
6 000
8 000
10 000
12 000
14 000
16 000
18 000
2009 2010 2011 2012 2013 2014
$
Chart 8: Hospital and General Treatment Benefits
Future cost of health care: … up some more
■ Currently >25% of Aust. Government spending is for health, age–related pensions and aged care
■ In GDP terms, Australian Government spending on health is forecast to rise the most in % of GDP terms, widening the spending gap between health and all other areas of Australian Government funding
www.TheCIE.com.au12
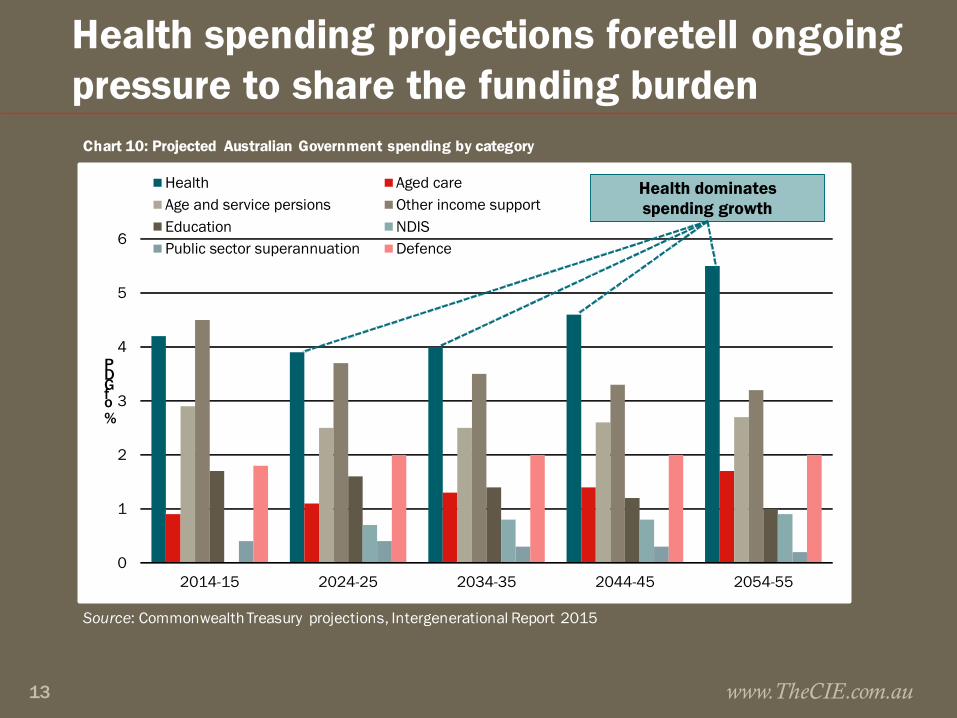
Health spending projections foretell ongoing pressure to share the funding burden
www.TheCIE.com.au13
Source: Commonwealth Treasury projections, Intergenerational Report 2015
0
1
2
3
4
5
6
2014-15 2024-25 2034-35 2044-45 2054-55
% of GDP
Health Aged careAge and service persions Other income supportEducation NDISPublic sector superannuation Defence
Health dominates spending growth
Chart 10: Projected Australian Government spending by category
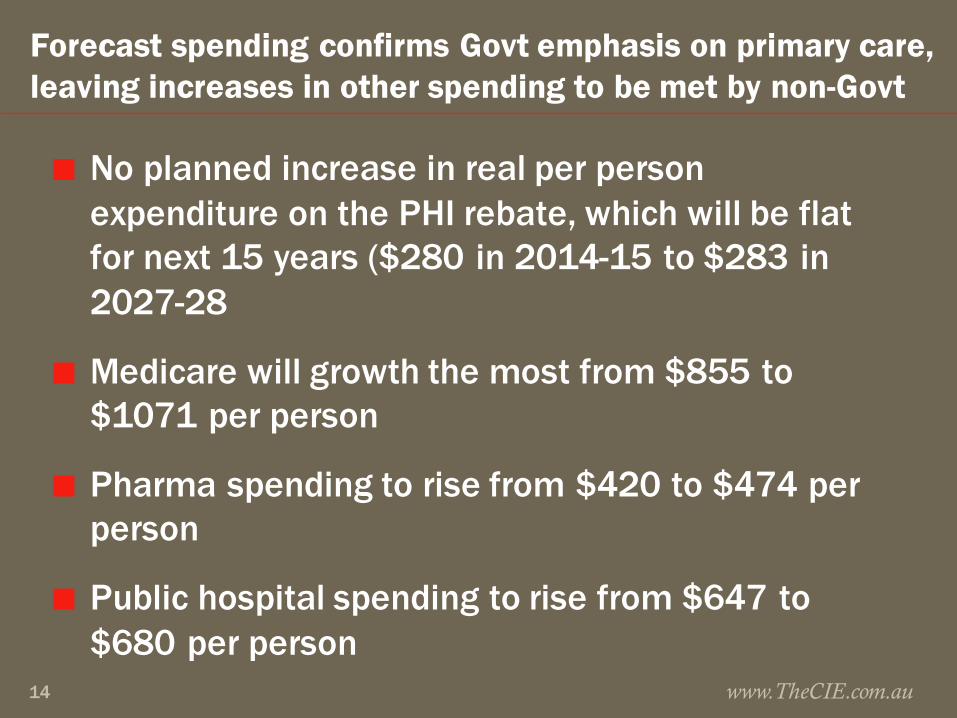
Forecast spending confirms Govt emphasis on primary care, leaving increases in other spending to be met by non-Govt
■ No planned increase in real per person expenditure on the PHI rebate, which will be flat for next 15 years ($280 in 2014-15 to $283 in 2027-28
■ Medicare will growth the most from $855 to $1071 per person
■ Pharma spending to rise from $420 to $474 per person
■ Public hospital spending to rise from $647 to $680 per person
www.TheCIE.com.au14
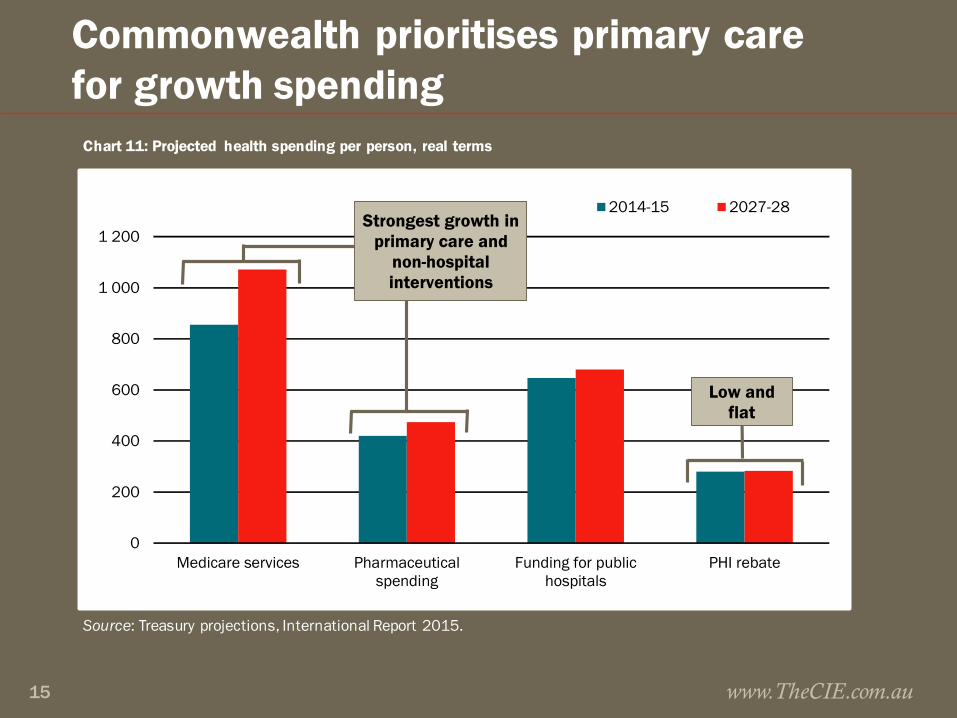
Commonwealth prioritises primary care for growth spending
www.TheCIE.com.au15
Source: Treasury projections, International Report 2015.
0
200
400
600
800
1 000
1 200
Medicare services Pharmaceuticalspending
Funding for publichospitals
PHI rebate
2014-15 2027-28Strongest growth in
primary care and non-hospital interventions
Low and flat
Chart 11: Projected health spending per person, real terms
This signals wider purposeful shift away from hospital care to early intervention
■ Hospital and PHI funding increase only in line with population and CPI growth (CPI assumed to be < than premium ↑)
■ Medicare and pharmaceutical benefits increase in line with both CPI/population growth and non-demographic factors (in line with age based historical use patterns)
www.TheCIE.com.au16
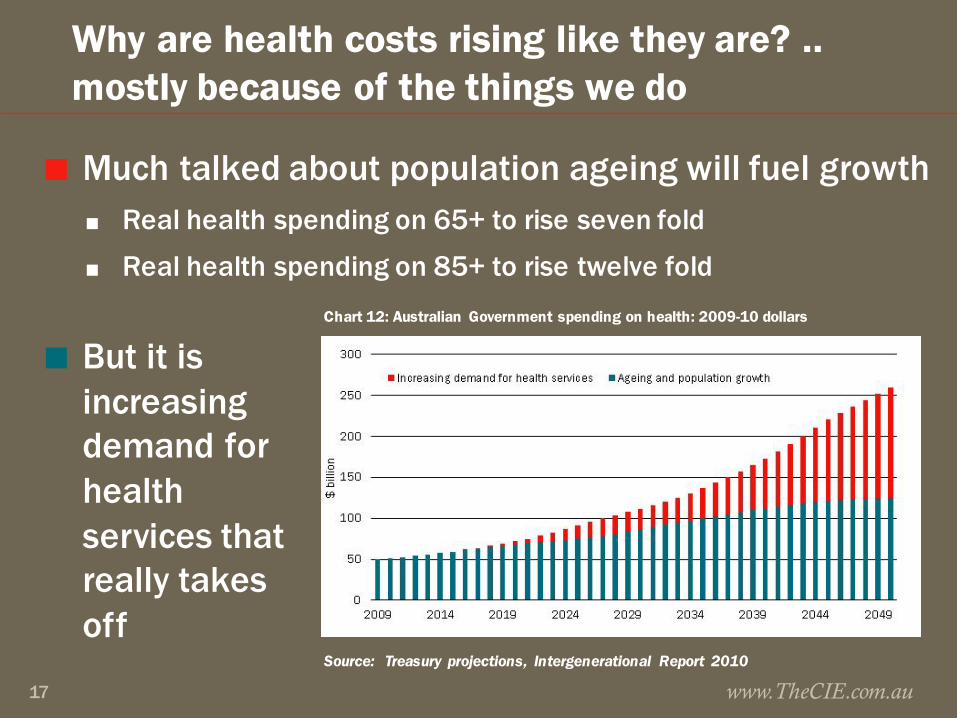
Why are health costs rising like they are? .. mostly because of the things we do
■ Much talked about population ageing will fuel growth ■ Real health spending on 65+ to rise seven fold
■ Real health spending on 85+ to rise twelve fold
www.TheCIE.com.au17
■ But it is increasing demand for health services that really takes off
Chart 12: Australian Government spending on health: 2009-10 dollars
Source: Treasury projections, Intergenerational Report 2010
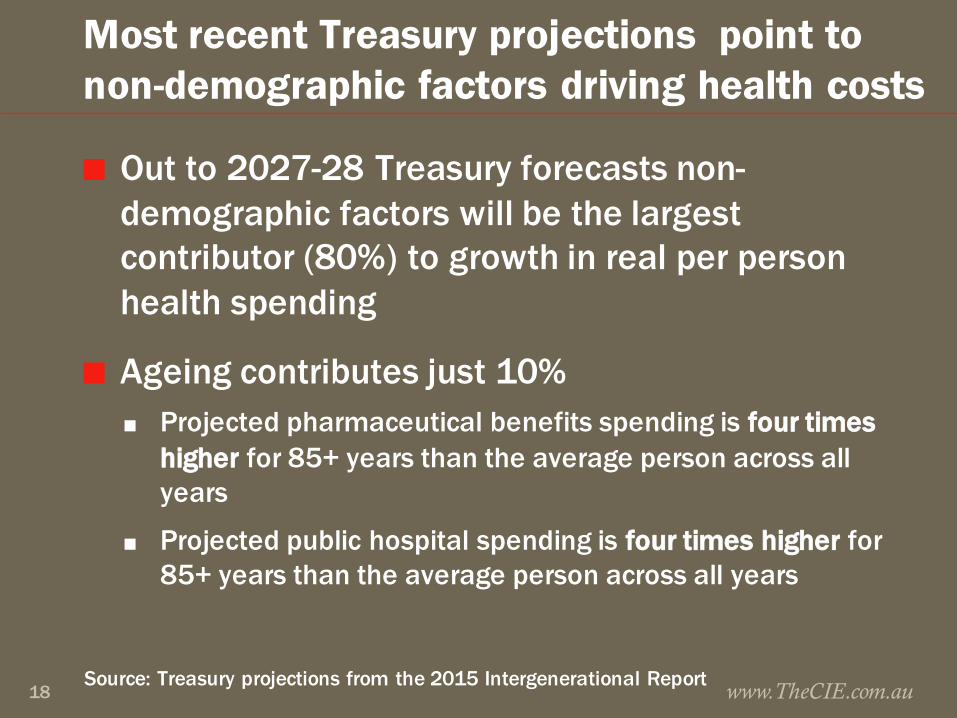
Most recent Treasury projections point to non-demographic factors driving health costs
■ Out to 2027-28 Treasury forecasts non-demographic factors will be the largest contributor (80%) to growth in real per person health spending
■ Ageing contributes just 10%■ Projected pharmaceutical benefits spending is four times
higher for 85+ years than the average person across all years
■ Projected public hospital spending is four times higher for 85+ years than the average person across all years
Source: Treasury projections from the 2015 Intergenerational Report www.TheCIE.com.au18
It is our needs, wants and options that are changing
■ Higher incomes bring increased preferences to consume more and/or better health services
■ Technology change increases demand and price (eg. Keyhole surgery is a better/more expensive way of treating same condition
■ Changes in disease rates (esp. chronic disease) increases demand for treatments
■ Wages growth >CPI leads to price growth in labour intensive industries, including hospitals and medical services
www.TheCIE.com.au19
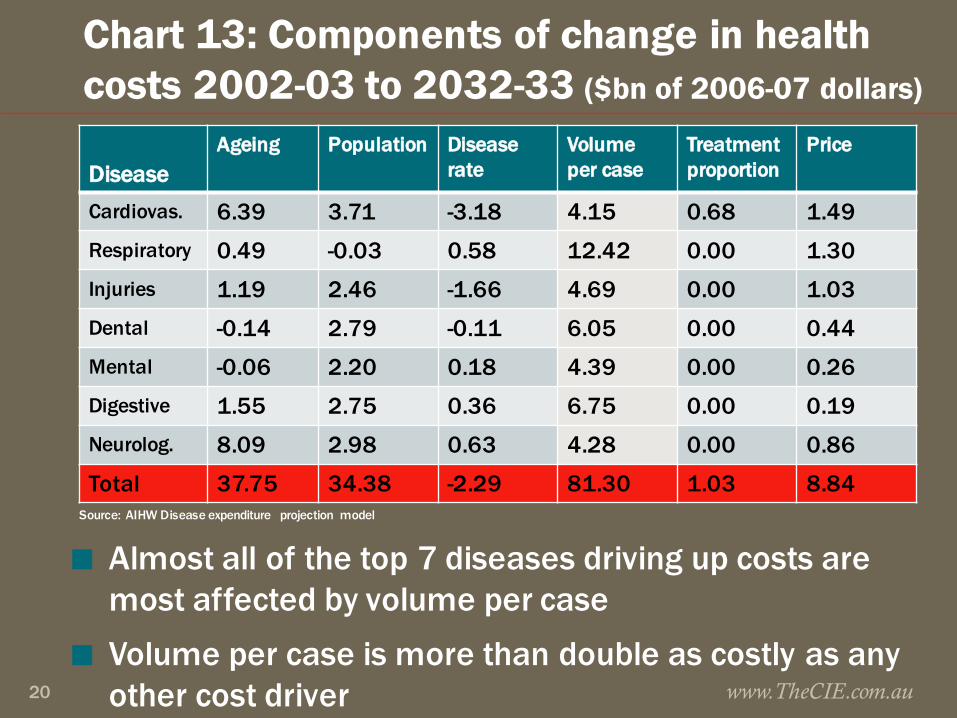
Chart 13: Components of change in health costs 2002-03 to 2032-33 ($bn of 2006-07 dollars)
DiseaseAgeing Population Disease
rateVolume per case
Treatment proportion
Price
Cardiovas. 6.39 3.71 -3.18 4.15 0.68 1.49Respiratory 0.49 -0.03 0.58 12.42 0.00 1.30Injuries 1.19 2.46 -1.66 4.69 0.00 1.03Dental -0.14 2.79 -0.11 6.05 0.00 0.44Mental -0.06 2.20 0.18 4.39 0.00 0.26Digestive 1.55 2.75 0.36 6.75 0.00 0.19Neurolog. 8.09 2.98 0.63 4.28 0.00 0.86
Total 37.75 34.38 -2.29 81.30 1.03 8.84
www.TheCIE.com.au20
■ Almost all of the top 7 diseases driving up costs are most affected by volume per case
■ Volume per case is more than double as costly as any other cost driver
Source: AIHW Disease expenditure projection model
Concluding thoughts..
■ Health spending pressure will make cost sharing inevitable, and price signals will increasingly be used to ration health services: look out for some rebalancing of the access vs quality compromise
■ Arguably unlikely to get additional Government sponsorship of PHI, policy momentum from sector likely to be to preserve the status quo
■ Can more be done to get more market signals into healthcare? Arguably yes, healthcare is very regulated but arguably mature enough to get equitable outcomes from greater market freedoms
www.TheCIE.com.au21