Embed Size (px)
Citation preview

Sustainable Brands Webinar
June 18, 2014

2
Agenda • Tim Greiner, Managing Director, Pure Strategies– Business benefits
– Top practices
• Jennifer Duran, Global Head of Sustainable Innovation, RB– Product sustainability goals
– Integrating sustainability into product development
• Colleen VonHaden, Sustainability Director, Timberland– Supplier engagement to integrate sustainability across the supply
chain
• Q&A

3

4
Product sustainability measures, improves, and discloses
environmental and social impacts of products across the life cycle

5
What are the top benefits companies are already achieving from their product
sustainability efforts?

32%
41%
50%
50%
62%
62%
64%
69%
71%
74%
79%
Increased sales
Supply chain risk reduction
Product material cost savings
Future regulatory risk mitigation
Packaging cost savings
Meeting consumer demands
Logistics and supply chain cost savings
Meeting retailer requirements
Trust and brand enhancement
Employee engagement and productivity
Manufacturing cost savings
6
Which business benefits have you achieved and are important to achieve from your
company’s product sustainability program?

7
No single company in the survey expected a decrease in funding
this year for product sustainability
8
There are best practices that
performing companies use to plan,
execute, and advance product
sustainability that help them
achieve widespread benefits

9
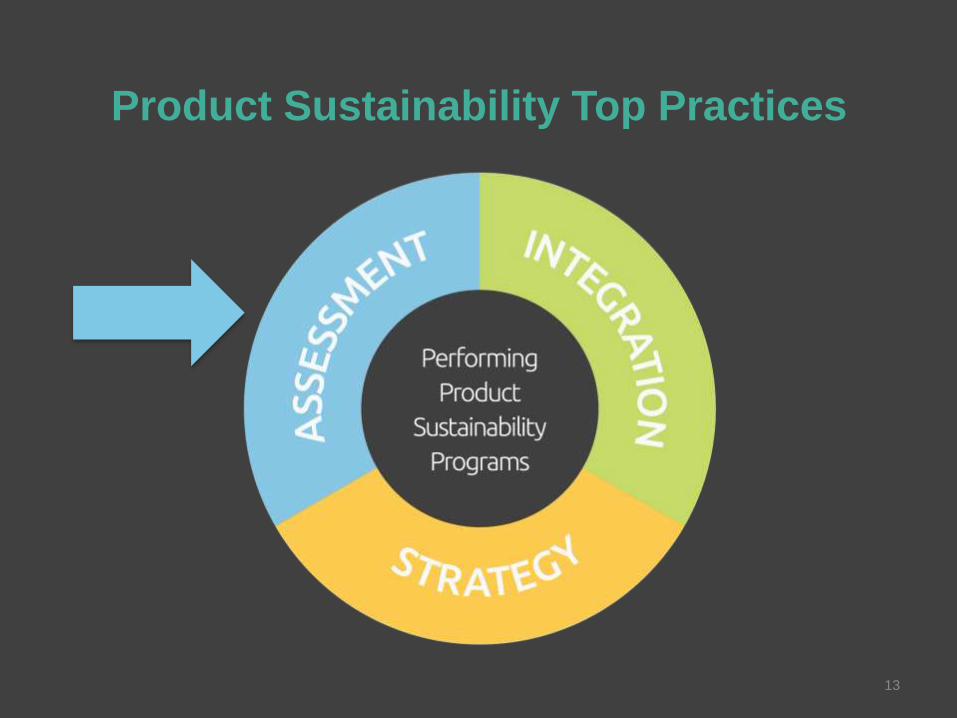
Product Sustainability Top Practices

10
Product Sustainability Top Practices
11
97% of performing companies
have product sustainability goals

12
Re. Think
Products
Re. Focus
Operations
Re.Commit
People
Increase Product
Sustainability
Minimize Impacts Mobilize Employees
10% Sustainable
Product Families
10% Resource
Reduction
(GHGs, Water, Waste)
3 New Awareness
Programs
1. Increase revenue by $ from more sustainable products
2. Increase sustainability of % of products
3. % of products in (sustainability/innovation) pipeline
13
Product Sustainability Top Practices

14
What were the most highly valued
approaches to product sustainability assessment?

15
26%
27%
32%
33%
40%
68%
72%
Industry scorecards, criteria,standards
Life cycle assessment
Custom-designed scorecards,guidelines, software
Non-profit scorecards, criteria,standards
Chemicals of concern or harmfulmaterial assessment
Customer scorecards, criteria,standards
Supplier engagement
How valuable are the following approaches to product sustainability assessment?
Percent of all respondents rating high or very high.
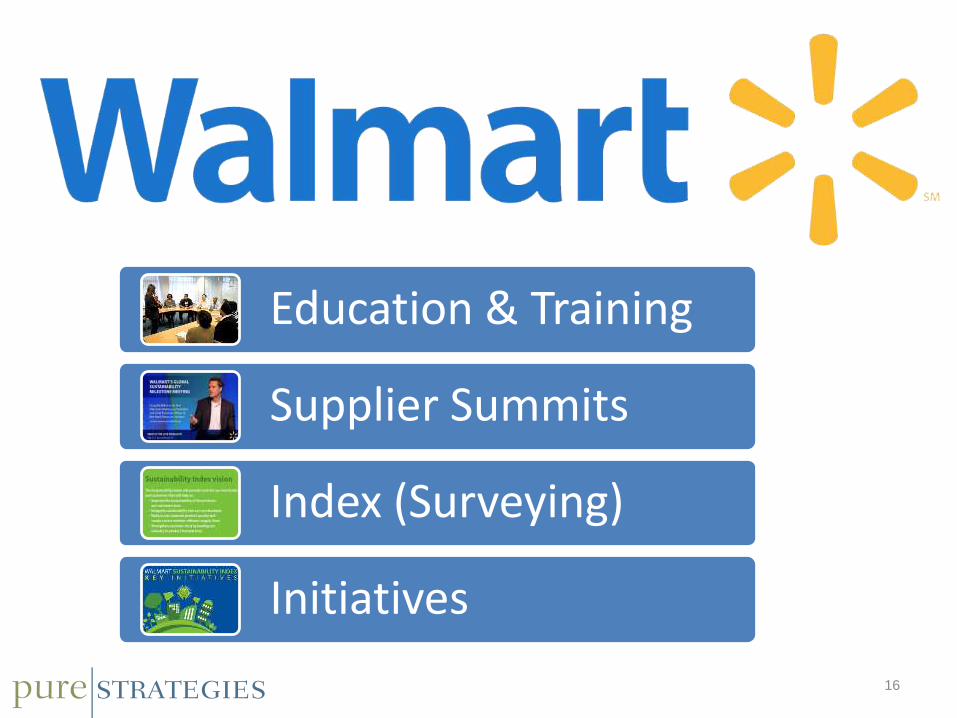
16
Education & Training
Supplier Summits
Index (Surveying)
Initiatives

17
Product Sustainability Top Practices
18
Where are performing companies
currently concentrating product
sustainability integration?
Commercial Phase | Bench-top Phase | Concept Phase

19
54%
23% 23%
72%67%
51%
CommercialPhase
Bench-top/Pilotphase
Concept phase
At Present In Two Years
In the product development process, where do you/will you concentrate product
sustainability efforts? High concentration as reported by performing companies
Performing companies are bringing sustainability into the product
development process

20
Identify
project
priorities
Semi-
quantitative
assessment
of priorities
Standardized
assessment
Final
assessment

21

Security Level: Public
Sustainability at RBJennifer Duran18 June 2014

Our Vision and Purpose
Our vision is a world
where people are
healthier and live better
Our purpose is to make
a difference by giving people
innovative solutions for
healthier lives and
happier homes

Our approach responds to the global megatrends affecting the worldIn particular those we can influence
Growing need
for better
health &
hygiene
Increasing
water
scarcity
Rising energy
costs and
emission
constraints
Pressures
on natural
resources
and waste
Growth of
emerging
markets
Consumers
demand
greater
transparency
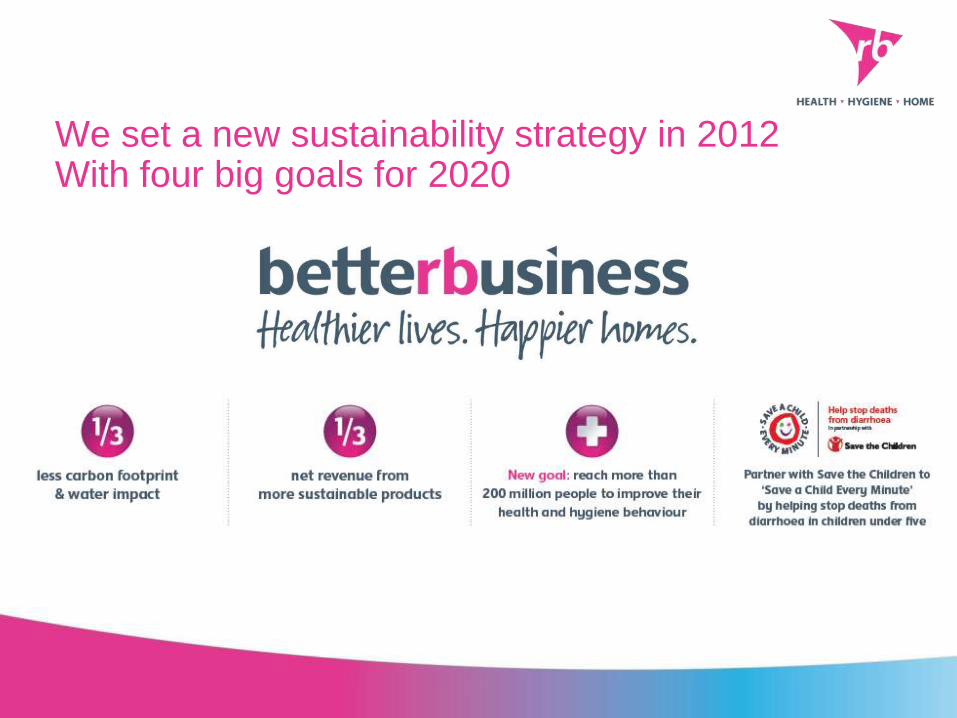
We set a new sustainability strategy in 2012With four big goals for 2020

Our strategy is organised into three key pillarsThese will help us meet our four big goals
Healthier Communities
Better Design
Better Production
Creating products that
use less water, energy
and packaging, and
more sustainable
ingredients.
Improving health and
hygiene behaviour
through our brands and
partnerships.
Reducing our
environmental impacts
in production, meeting
our social standards and
keeping our people safe.

Key strategic drivers of product-level metrics
Better Production
www.rb.com/sustainability

What is a ‘more sustainable innovation’ and how do we measure this?
Sustainable Innovation Calculator is a streamlined Life Cycle Analysis (LCA) tool that models product interactions from cradle to grave across relevant environmental impact categories
To qualify, a product must score better (green) in at least one of the following categories without scoring worse (red) in any others:

R&D can now assess the impact of choices in real time
Innovating more sustainable productsVia our new online sustainability calculator

Embedding into product development processTo consider sustainability earlier
LAUNCH
PHASE
DEVELOPMENT
1 & 2
PRE
LAUNCH
SCOPING &
CONCEPT DVLTFEASIBILITY
Brief
signed
Marketing and R&D to
consider impacts via
sustainability guidance
On pack
claims
Key milestone
1
Complete
calculator and
report status
Net
Revenu
e
Key milestone
2
Refresh
calculator and
report status

In 2013, we measured Net Revenue from more sustainable products for the first time…
• £230 million NR from more sustainable products (Q1-Q3 2013)
• Measured with the help of:
– Sustainable Innovation Calculator
– Global network of Sustainability Champions
• This process is helping to create a culture of sustainable innovation
• RB is committed to product stewardship, product safety and transparency*
What we mean by
* For more information on our product safety and stewardship programmes, see our 2013 Sustainability Report.

Find out more
www.rb.com/sustainability
www.happier-homes.com
External recognition
RB was included in both the Dow Jones Sustainability Index and the CDP’s Carbon Disclosure Leadership Index in 2013

Timberland
Supplier Sustainability Program
Colleen Von HadenSustainability Director
June 2014

SHARED RESPONSIBILITY with INCREASED FOCUS
Compliance Audit Team
• Terms of Engagement & Global
Compliance Principles
• Compliance Audits
•Social/Labor Compliance
•Health and Safety
•Environmental Licenses
•Facility Security
Supplier Sustainability Team
• Corrective Action Plan Development• CAP Development
• Root Cause Analysis
• Capacity Building
• Management Systems• SAI Social Fingerprint Framework
• GSCP Environmental Framework
• Sustainable Living Environments• Improving workers happiness & retention
• Beyond compliance; beyond factory walls
• Reducing absenteeism, improving retention
• Improving productivity and quality
RISK MITIGATION + VALUE CREATION

OUR GOAL
Look beyond compliance and beyond factory
walls to create a safe and healthy work
environment and community for 280,000
workers at 350 factories.
OUR RESULT
Happier, healthier, more productive
workforce . . . stronger communities and a
more resilient supply chain.

SUPPLIER SUSTAINABILITY STRATEGY
• Social Fingerprint (S/L
Management System)
• SLE: Sustainable Living
Environments
• SA8000 / WRAP
Worker Retention
Absenteeism
Productivity
Quality
Risk
Costs• GSCP Environmental
Management System
• Resource Efficiency
• ISO 14001
Social / Labor
Environment
Business Impact
Improved social & environmental performance enables improved
business performance
OPERATIONAL SUSTAINABILITY
2

Worker Well Being Description Business Impact
Social Fingerprint (S/L Management System)
Improve compliance performance and improve social/labor conditions with a Social/Labor Management system that drives consistent compliance and measurement of continuous improvement
• Reduced Risk• Reduced Cost (associated to
risk)
SLE: Sustainable Living Environments
Addressing worker health & well-being inside and outside factory walls to improve retention and reduce absenteeism.
• Decreased Absenteeism• Improved Retention,
Productivity, Quality• Decreased Costs
Env Protection Description Business Impact
GSCP Environmental Management System
Improve compliance performance and improve environmental impacts with an Env Management system that drives consistent compliance and measurement of continuous improvement
• Reduced Risk• Reduced Costs (associated to
risk)
Resource Efficiency More efficient operations with reduced waste and consumption of utilities
• Reduced Costs• Improved Image
HIGH LEVEL LINKS TO BUSINESS VALUE
10
* See Appendix for detail of social and environmental links to business impacts.

OUR PROCESS
In 2008, we began exploring these beliefs
more deeply with suppliers to gain a greater
understanding of workers’ needs and
opportunities for a better life.
We have conversations with workers using
participatory techniques of dialogue to
understand what aspects of basic living
needs they might be struggling with, to gain a
firsthand understanding of their perspectives.
We also look at the factory infrastructure with
management, contact community
organizations and trade unions, and consult
with nonprofit organizations and even other
brands to supplement what the workers
themselves tell us.
Sometimes workers may need more education and information about available
services or infrastructure. Other times, it may be that affordable, adequate
options and services are not readily available. In either case, action is needed

The Business Value of Workers’ Children’s Wellbeing
Studies show that sixty percent of lost workdays each year can be attributed to stress.
Occupational stress has causes beyond working conditions, as conflicts between the
demands of workplace and home life are increasingly common—which we discovered
when interviewing workers at Timberland’s contract factories.

Empowering Workers through Financial Literacy
Understanding the causes of worker stress is critical for assessing worker needs and
helping our suppliers be more productive and profitable.
Financial security is an essential part of anyone’s livelihood. Yet 2.5 billion adults around
the world don’t use formal financial services to save or borrow money. Empowering the
working poor with proper knowledge and skill—and connecting them to financial products
and services—can help them manage money more effectively, invest in economic
opportunities, and reduce risks related to illness or loss of employment – for them and
their families.

Clean Drinking Water – a priceless commodity
If you were to ask an American business owner what single thing was most essential to
his or her workforce’s quality of life, the answer might be the electricity to power their
equipment or cars for their employees’ commute. But in many rural, developing countries,
the answer is often much more basic: clean drinking water.

TBL SUSTAINABILITY – ORG CHART
Mark Newton
VP
CSR
Colleen Von Haden
Senior Manager
Supplier Sustainability
Jackson He
Regional Manager
Asia Supplier Sustainability
Vincent He
Asia Supplier Sustainability
Leeka Li
Asia Supplier Sustainability
Songpon Pengchassmsri
Regional Manager S. Asia Supplier Sustainability
Rita Kodkarni
S. Asia Supplier Sustainability
Ann Caron
Analyst
Supplier Sustainability
Atlanta McIlwraith
Senior Manager
Community Engagement
Brianne Wood
Manager
Community Engagement
Jill Holt
Coordinator
Community Engagement
Betsy Blaisdell
Senior Manager
Environmental Stewardship
Open
Senior Manager
CSR Europe
Zeynep KayaalpEMEA SupplierSustainability(Contractor)
Carlos GiacomozziLatAm SupplierSustainability(Contractor)
Patrik FriskPresident
Supplier Sustainability Team
Team Skillset:•Technical knowledge (social, H&S, Env)•Rural Participatory Assessment Methodologies – Worker Engagement •Change Management•Facilitation•Project Management

Success Factors
• Positioning is key – “nice to do” v. “need to do”. Demonstrate the business case for
going beyond.
• Make the workers central to the process.
• Utilize rural participatory assessment methodologies to engage in dialogue with
the workers about very sensitive subjects
• Establish system of peer educators
• Establish CAP committees with worker representatives
• Have workers part of the solution brainstorming
• Hand-holding / Patience / Change agent skills

Topic Proven Value at TBL or VF Value Proven Externally
SOCIAL MANAGEMENT SYSTEMS
SAI Social Fingerprint
The Social Fingerprint framework focuses on 9 elements that SAI deems instrumental in evaluating an effective social/labor management system (rated Level 1 (basic) to Level 5 (best practice): 1.Clear and Complete Policies & Procedures2.Worker Involvement and Communication 3.Complaint Management and Resolution 4.Worker Training and Development5.Internal Social Performance Team (ISPT)6.Oversight of Suppliers and Subcontractors7.External Verification & Stakeholder Engagement8.Non-compliance resolution (CAP) process9.Progress on Corrective Actions
RISK MANAGEMENT: Increased level of performance on compliance audits.
A) Better Results. When factories meet higher levels on the SAI Social Fingerprint, they are more likely to receive initial acceptance from VF compliance audit.SAI Level 1: 0% AcceptedSAI Level 2: 24% AcceptedSAI Level 3: 71% Accepted
B) Consistent Results. Factories that meet the higher levels on the SAI Social Fingerprint are more likely to maintain the Accepted compliance rating:SAI Level 1: 0% Accepted YOYSAI Level 2: 18% Accepted YOYSAI Level 3: 82% Accepted YOY
COST REDUCTION: INFACT metrics studies showed that consistently managed and continuously improved workplace conditions with improved absenteeism, retention, and worker moral translates into reduced costs, improved quality and productivity.
COST REDUCTION: SA8000 case studies (2008) showed the following results, which may lead to lower factory operational costs resulting in lower product costs.•Annual worker turnover decreased from 78% to 32%•37% decrease in lost time from accidents and sickness•Avg tenure increased 12 mos to 25 mos.
COST REDUCTION: KPMG study (2012) showed the following ROI for improved HR practices and worker/management communications, which may lead to lower factory operational costs resulting in lower product costs:•Decreased Turnover 25-40%•Factories with strong social/labor management systems are more resilient, better positioned for long term business survival
APPENDIX A: DETAILED LINKS TO BUSINESS VALUE

Topic Proven Value at TBL or VF Value Proven Externally
WORKER WELL-BEING & SLE (Sustainable Living Environments)
Addressing workers mental and physical health and well-being inside the factoryto ensure motivated, loyal workers (Worker Well-being) and outside the factory to ensure their ability to meet basic needs and better their lives (Sustainable Living Environments).
Conduct surveys and focused discussion groups with workers to determine
o Causes of absenteeism and turnover
o Causes of low moralo Level of povertyo Opportunities to better lives
COST REDUCTION: Anecdotal correlations evidenced at key vendors (PY Vietnam, Youngone Bangladesh) and at owned facility (RFC), regarding improved worker moral, absenteeism, retention as a result of SLE type projects which may lead to lower factory operational costs resulting in lower product costs.
RISK MANAGEMENT: NGO campaigns for Living Wages remain strong. Feedback received from NGOs confirmed that in lieu of a Living Wage policy, TBL’s SLE initiative is an acceptable alternative approach to addressing poverty in supply chains, thereby reducing the risk of negative campaigns against the brand.
SALES GROWTH: Marketing content derived from SLE projects’ stories used in product marketing material.
COST REDUCTION: KPMG study (2012) showed ROI for investments in worker comfort, performance-based wage incentives, and improved worker/manager relations resulted in decreased turnover (36%), rework (65%) and absenteeism (53%), which may lead to lower factory operational costs resulting in lower product costs.
COST REDUCTION: BSR study (2010) quantified $3-4 return for every $1 spent on worker health program investments by way of improved absenteeism and retention resulting in improved lost time and lower costs associated with recruitment and training, which may lead to lower factory operational costs resulting in lower product costs.
APPENDIX B: DETAILED LINKS TO BUSINESS VALUE

Topic Proven Value at TBL or VF Value Proven Externally
MANAGEMENT SYSTEMS
GSCP Environmental Framework
The GSCP framework evaluates and guides factories in 9 environmental impact areas (rated Level 1 (basic) to Level 3 (best practice): 1. Environmental Management
System2. Energy Use3. Water Use4. Wastewater Discharge5. Air Emissions6. Waste Management7. Hazardous Substances8. Emergency Planning and Incident
Prevention9. Nuisances
RISK MANAGEMENT: Reduced brand risk from suppliers having improved environmental compliance and reduced environmental impacts. fight erroneous claims and
potentially negative press from NGOs
COST REDUCTION: Less energy, water and waste generated by suppliers result in reduced related costs for suppliers.
COST AVOIDANCE: Less resource intense factories are better positioned for long term operations, reducing VF costs to change suppliers in the future
Water efficiency and wastewater recycling reduces water dependency in areas where water risk is growing
Energy efficiency and use of renewable energy reduces power and manufacturing disruptions caused by aging and overburdened grids
Tightening environmental regulations have the potential to shut suppliers down that are resource intensive or have a history of non-compliance
COST AVOIDANCE: Reduced hazardous chemical use results in lower hazardous waste disposal costs and risk.
PRODUCT QUALITY: Quality, Lean and Environmental Management Systems require the same core components and therefore are highly complementary and reinforcing. Commonly you’ll see the two systems implemented together with the same core processes resulting in overall better management of process flow and waste.
APPENDIX B: DETAILED LINKS TO BUSINESS VALUE

Topic Proven Value at TBL or VF Value Proven Externally
Supplier ENERGY EFFICIENCYengagement, audits and improvements
COST REDUCTION: Transparency into reduced operational costs at factory allowing for more informed price negotiations
COST AVOIDANCE: Less energy intense factories are better positioned for long-term operations, reducing VF costs to change suppliers in the future.
SALES GROWTH: Reduced energy use in supply chain results in improved product sustainability scores, as demanded by retailers and consumers.
WASTEWATER effluent discharge treatment requirements
RISK MANAGEMENT: Reduced brand risk from discharging polluted water into the local environment and community.
COST REDUCTION: Treated wastewater can be recycled, thereby improving water efficiency at factory.
APPENDIX B: DETAILED LINKS TO BUSINESS VALUE
Find the report at:
www.purestrategies.com
Questions & Answers