Embed Size (px)
Citation preview

Hong Kong Exchanges and Clearing Limited and The Stock Exchange of Hong Kong Limited take noresponsibility for the contents of this announcement, make no representation as to its accuracy orcompleteness and expressly disclaim any liability whatsoever for any loss howsoever arising from orin reliance upon the whole or any part of the contents of this announcement.
Sihuan Pharmaceutical Holdings Group Ltd.四 環 醫 藥 控 股 集 團 有 限 公 司
(incorporated in Bermuda with limited liability)
(Stock Code: 0460)
ANNOUNCEMENT OF ANNUAL RESULTSFOR THE YEAR ENDED 31 DECEMBER 2014
ANDCONTINUED SUSPENSION OF TRADING
Year ended31 December2014 2013 change
RMB’000 RMB’000(Restated)
Key Income Statement ItemsRevenue 3,084,236 2,586,402 19.2%Gross profit 2,111,422 1,455,469 45.1%Operating profit 1,979,088 1,497,142 32.2%Profit attributable to owners of the Company 1,671,281 1,284,882 30.1%
Key Financial RatiosGross profit margin 68.46% 56.27%Net profit margin 54.19% 49.68%Earnings per share — Basic (RMB cents) 16.13 12.41Receivable Turnover (days) 82 102Inventory Turnover (days) 52 31Proposed final cash dividend per share (RMB cents) 1.3 2.1
2014 FINANCIAL HIGHLIGHTS• Profit attributable to owners of the Company increased by 30.1% to RMB1,671.3
million in 2014.
• Revenue of the Group increased by 19.2% to RMB3,084.2 million in 2014 fromRMB2,586.4 million.
• Basic earnings per share increased by approximately 30.0% from RMB12.4 centsin 2013 to approximately RMB16.1 cents in 2014.
• A final cash dividend of RMB1.3 cents per share was recommended by the Boardand is subject to approval by the Shareholders at the forthcoming annual generalmeeting.
— 1 —

The board (the “Board”) of directors (the “Directors”) of Sihuan PharmaceuticalHoldings Group Ltd. (“Sihuan Pharmaceutical” or the “Company”) is pleased toannounce the audited consolidated results of the Company and its subsidiaries(collectively the “Group”) for the year ended 31 December 2014 (the “Year”)together with the comparative figures for the previous year as follows:
REASON FOR DELAY IN PUBLICATION OF THE 2014 ANNUAL RESULTS
For information on the delay in publication of the 2014 annual results, please referto the announcements of the Company dated 27 March 2015, 19 April 2015 and 8June 2015.
CONSOLIDATED BALANCE SHEET
As at31 December
As at1 January
Note 2014 2013 2013RMB’000 RMB’000 RMB’000
(Restated) (Restated)
AssetsNon-current assetsProperty, plant and equipment 1,704,128 1,441,677 924,052Investment properties 32,659 34,437 30,894Intangible assets 4 2,815,711 2,880,622 3,735,030Land use rights 362,364 337,998 165,637Investment accounted for using the
equity method 358,491 34,069 40,962Trade and other receivables — — 154,192Deferred income tax assets 61,906 119,939 265,176Other non-current assets 361,228 — 122,521
5,696,487 4,848,742 5,438,464Current assetsInventories 177,181 101,283 91,472Trade and other receivables 5 1,240,666 1,398,041 769,120Available-for-sale financial assets 6 1,617,631 776,074 717,921Term deposits with initial term of over
three months — 233,651 898,560Cash and cash equivalents 1,317,945 1,593,503 1,567,048
4,353,423 4,102,552 4,044,121Assets of disposal group classified as
held for sale 1,273,073 1,145,781 —
5,626,496 5,248,333 4,044,121
Total assets 11,322,983 10,097,075 9,482,585
— 2 —

CONSOLIDATED BALANCE SHEET (CONTINUED)
As at31 December
As at1 January
Note 2014 2013 2013RMB’000 RMB’000 RMB’000
(Restated) (Restated)
Equity and liabilitiesEquity attributable to owners of the
CompanyShare capital 7 85,610 44,419 44,419Share premium 7 5,574,848 5,573,951 5,573,951Other reserves 151,897 89,329 65,256Retained earnings 3,479,322 2,113,760 1,357,986
9,291,677 7,821,459 7,041,612Non-controlling interests 114,336 115,485 102,927Total equity 9,406,013 7,936,944 7,144,539
LiabilitiesNon-current liabilitiesDeferred income tax liabilities 130,390 140,862 208,532Other non-current liabilities 8 89,912 85,142 231,592Borrowings 9 3,500 5,880 5,880
223,802 231,884 446,004
Current liabilitiesTrade and other payables 10 1,105,384 1,354,946 893,797Borrowings 9 — 180,800 767,234Current income tax liabilities 194,572 142,928 225,813Other current liabilities 8 96,338 9,361 5,198
1,396,294 1,688,035 1,892,042Liabilities of disposal group classified
as held for sale 296,874 240,212 —1,693,168 1,928,247 1,892,042
Total liabilities 1,916,970 2,160,131 2,338,046
Total equity and liabilities 11,322,983 10,097,075 9,482,585
Net current assets 3,933,328 3,320,086 2,152,079
Total assets less current liabilities 9,629,815 8,168,828 7,590,543
— 3 —

CONSOLIDATED STATEMENT OF COMPREHENSIVE INCOME
Year ended 31 December2014 2013
Note RMB’000 RMB’000(Restated)
Revenue 11 3,084,236 2,586,402Cost of sales 12 (972,814) (1,130,933)
Gross profit 2,111,422 1,455,469
Other income 11 46,220 30,281Other gains — net 11 451,754 477,305Distribution costs 12 (150,164) (139,086)Administrative expenses 12 (480,144) (326,827)
Operating profit 1,979,088 1,497,142
Finance income 13 116,983 121,137Finance expenses 13 (18,004) (8,762)
Finance income — net 98,979 112,375Share of loss of investment accounted for using
the equity method (4,644) (6,830)Loss on dilution of interest in associate — (63)
Profit before income tax 2,073,423 1,602,624Income tax expense 14 (388,542) (310,671)
Profit for the year 1,684,881 1,291,953
Profit attributable to:Owners of the Company 1,671,281 1,284,882Non-controlling interests 13,600 7,071
1,684,881 1,291,953
— 4 —

CONSOLIDATED STATEMENT OF COMPREHENSIVE INCOME(CONTINUED)
Year ended 31 December2014 2013
Note RMB’000 RMB’000(Restated)
Earnings per share attributable to owners ofthe Company for the year (expressed in RMBcents per share)
Basic and diluted earnings per share 15 16.13 12.41
Profit for the year 1,684,881 1,291,953Other comprehensive income:Items that may be reclassified to profit or lossChange in fair value of available-for-sale
financial assets, net of tax 6 10,957 1,053
Other comprehensive income for the year, netof tax 10,957 1,053
Total comprehensive income for the year 1,695,838 1,293,006
Attributable to:Owners of the Company 1,682,238 1,285,935Non-controlling interests 13,600 7,071
Total comprehensive income for the year 1,695,838 1,293,006
— 5 —

CONSOLIDATED STATEMENT OF CHANGES IN EQUITY
Attributable to owners of the Company
Sharecapital
Sharepremium
Otherreserves
Retainedearnings Total
Non-controlling
interests Total equityRMB’000 RMB’000 RMB’000 RMB’000 RMB’000 RMB’000 RMB’000
Balance as at 1 January2013 (Original stated) 44,419 5,573,951 65,256 1,400,702 7,084,328 102,927 7,187,255
Prior year adjustments — — — (42,716) (42,716) — (42,716)
Balance as at 1 January2013 (Restated) 44,419 5,573,951 65,256 1,357,986 7,041,612 102,927 7,144,539
Comprehensive incomeProfit for the year
(Restated) — — — 1,284,882 1,284,882 7,071 1,291,953Other comprehensive
incomeChanges in value of
available-for-salefinancial assets, net oftax — — 1,053 — 1,053 — 1,053
Total othercomprehensive income,net of tax — — 1,053 — 1,053 — 1,053
Total comprehensiveincome — — 1,053 1,284,882 1,285,935 7,071 1,293,006
Total contribution byand distributions toowners of theCompany recogniseddirectly in equity
Employees share awardscheme:-value of employee
service — — 16,589 — 16,589 — 16,589Dividends — — — (522,677) (522,677) — (522,677)Transfer to PRC statuary
reserve fund — — 6,431 (6,431) — — —
Total contributions byand distributions toowners of theCompany, recogniseddirectly in equity — — 23,020 (529,108) (506,088) — (506,088)
Non-controlling interestsarising on a newlyestablished subsidiary — — — — — 5,487 5,487
Total transactions withowners, recogniseddirectly in equity — — 23,020 (529,108) (506,088) 5,487 (500,601)
Balance as at31 December 2013(Restated) 44,419 5,573,951 89,329 2,113,760 7,821,459 115,485 7,936,944
— 6 —

CONSOLIDATED STATEMENT OF CHANGES IN EQUITY (CONTINUED)
Attributable to owners of the Company
Sharecapital
Sharepremium
Otherreserves
Retainedearnings Total
Non-controlling
interests Total equityRMB’000 RMB’000 RMB’000 RMB’000 RMB’000 RMB’000 RMB’000
Balance as at 1 January2014 (Restated) 44,419 5,573,951 89,329 2,113,760 7,821,459 115,485 7,936,944
Comprehensive incomeProfit for the year — — — 1,671,281 1,671,281 13,600 1,684,881Other comprehensive
incomeChanges in value of
available-for-salefinancial assets, net oftax — — 10,957 — 10,957 — 10,957
Total other comprehensiveincome, net of tax — — 10,957 — 10,957 — 10,957
Total comprehensiveincome — — 10,957 1,671,281 1,682,238 13,600 1,695,838
Total contributions byand distributions toowners of theCompany, recogniseddirectly in equity
Issuance of ordinaryshares 56 42,032 — — 42,088 — 42,088
Bonus issue of ordinaryshares 41,135 (41,135) — — — — —
Employees share awardscheme:-value of employeeservice — — 28,273 — 28,273 — 28,273
Dividends — — — (243,558) (243,558) — (243,558)Transfer to PRC statuary
reserve fund — — 62,161 (62,161) — — —
Total contributions byand distributions toowners of theCompany, recogniseddirectly in equity 41,191 897 90,434 (305,719) (173,197) — (173,197)
Changes in ownershipinterests in subsidiarieswithout change ofcontrol — — (38,823) — (38,823) (14,749) (53,572)
Total transactions withowners, recogniseddirectly in equity 41,191 897 51,611 (305,719) (212,020) (14,749) (226,769)
Balance as at 31December 2014 85,610 5,574,848 151,897 3,479,322 9,291,677 114,336 9,406,013
— 7 —

CONSOLIDATED STATEMENT OF CASH FLOW
Year ended 31 DecemberNote 2014 2013
RMB’000 RMB’000(Restated)
Cash flows from operating activitiesCash generated from operations 2,010,909 1,913,865Income tax paid (249,973) (340,175)
Net cash generated from operating activities 1,760,936 1,573,690
Cash flows from investing activitiesNew set up of associates (329,066) —Payment for acquisition of subsidiaries in prior years — (20,000)Purchases of property, plant and equipment (264,080) (846,125)Prepayment for purchase of property, plant and
equipment (37,748) —Purchases of intangible assets (42,744) (234,498)Prepayment for purchase of intangible assets (149,000) —Purchases of land use rights (84,869) (87,955)Prepayment for acquisition of land use rights (174,480) —Purchases of available-for-sale financial assets 6 (8,748,780) (6,467,400)Proceeds from disposal of available-for-sale financial
assets 7,918,180 6,410,300Proceeds from disposal of property, plant and equipment 11,805 1,488Proceeds from disposal of intangible assets — 1,415Proceeds from disposal of land use rights 3,085 —Decrease of term deposits with initial term of over three
months 233,651 664,909Interest received 105,389 86,578
Net cash used in investing activities (1,558,657) (491,288)
Cash flows from financing activitiesProceeds from issuance of ordinary shares 42,088 —Proceeds from borrowings 3,500 180,800Repayment of borrowings (186,680) (704,148)Acquisition of additional interest in a subsidiary (53,572) —Non-controlling interests arising on establishing new
subsidiaries — 5,487Dividends paid to company’s shareholders 16 (243,558) (522,677)Interest paid (5,817) (8,058)
Net cash used in financing activities (444,039) (1,048,596)
Net (decrease)/increase in cash and cash equivalents (241,760) 33,806Cash and cash equivalents at beginning of year 1,600,854 1,567,048
Cash and cash equivalents at end of year 1,359,094 1,600,854
— 8 —

Notes:
1. GENERAL INFORMATION
The Company is incorporated in Bermuda under the Bermuda Companies Act as an exempted
company.
The Company is an investment holding company. The principal activities of the Company and its
subsidiaries (together, the “Group”) are research and development, manufacturing and sale of
pharmaceutical products in the People’s Republic of China (the “PRC”).
The address of the Company’s registered office is Clarendon House, 2 Church Street, P.O. Box
HM 1022, Hamilton HM DX, Bermuda. The address of the principal place of business of the
Group is 21/F, Building 2, Zhubang 2000, West Balizhuang, Chaoyang District, Beijing 100025
in the PRC.
The Company had its primary listing on The Stock Exchange of Hong Kong Limited (the “StockExchange”) on 28 October 2010.
These consolidated financial information are presented in units of Renminbi (“RMB”) thousand
Yuan, unless otherwise stated.
These consolidated financial information have been approved for issue by the Board of Directors
on 31 July 2015.
2. BASIS OF PREPARATION
The consolidated financial statements of the Company have been prepared in accordance with
International Financial Reporting Standards (“IFRS”). The consolidated financial statements
have been prepared under the historical cost convention as modified by the revaluation of
available-for-sale financial assets, which are carried at fair value.
The consolidated financial statements are prepared in accordance with the applicable
requirements of the predecessor Companies Ordinance (Cap. 32) for this financial year and the
comparative period.
The preparation of financial statements in conformity with IFRS requires the use of certain
critical accounting estimates. It also requires management to exercise its judgement in the
process of applying the Group’s accounting policies.
2.1 Prior year adjustments and restatements
In 2014, the Company received an external enquiry (the “Enquiry”) as to how the Group has
been conducting its sales and marketing activities, which may have an impact on the accounting
treatment that the Group adopted in the past for certain of its sales revenue and distribution
expenses, as well as other financial reporting matters. In response to the Enquiry, the audit
committee of the Company (the “Audit Committee”) conducted an independent investigation
(the “Investigation”) involving, among others, assistance from a third party consultant, in
relation to the matters raised in the Enquiry.
— 9 —

Based on the findings of the Investigation, the Directors of the Company considered it
appropriate to make adjustments to the Group’s consolidated financial statements for the years
ended 31 December 2013 and before, and consequently prior year adjustments were recorded by
the Group in respect of the following matters:
(i) Revised sales model and reimbursement to distributors
Prior to 2011 and under the Group’s original sales model, the marketing and promotion
activities in relation to the Group’s products were mainly carried out by the distributors of
the Group. The related marketing and promotion expenses were not incurred nor recorded
by the Group. With effect from the completion of certain acquisitions in 2011, the Group
retained the sales model of the newly acquired companies (“Revised Sales Model”) and
adopted it for some of the Group’s products in order to have an effective integration of such
business with that of the Group. The Revised Sales Model was used alongside with the
Company’s original sales model, although most of the sales were conducted using the
Revised Sales Model in 2012 and 2013. Under the Revised Sales Model, the Group engaged
certain marketing research agents (“MRAs”) for provision of marketing and promotion
services, which were previously conducted by the Group’s distributors before the adoption
of the Revised Sales Model. The selling prices of the Group’s products to the distributors
were then adjusted and increased accordingly after considering these marketing and
promotion expenses under the Revised Sales Model. The marketing and promotion expenses
paid by the Group to the MRAs were previously recorded as distribution costs in the
consolidated financial statements of the Group. Since mid 2014 the Group has significantly
reduced the sales of its products using the Revised Sales Model and consequently does not
engage MRAs for provision of marketing and promotion services any more.
(a) Based on the findings of the Investigation, certain MRAs, whose sole activities are
provision of marketing related services to the Group, were now considered to be
controlled by the Group as the Group is exposed to variable returns and has the ability
to affect those returns through its power over these MRAs. The Directors of the
Company considered that these MRAs should be accounted for as structured entities
of the Group and therefore should be consolidated (“Consolidated MRAs”) in the
consolidated financial statements of the Group.
As a result of the prior year adjustment on the consolidation of the Consolidated
MRAs (with the eliminations), total income/gains and expenses of RMB78,521,000
and RMB78,521,000, respectively; cash and cash equivalents and trade and other
payables of RMB64,833,000 and RMB64,833,000, respectively were adjusted and
included in the Group’s consolidated financial statements as at and for the year ended
31 December 2013. In addition, cash and cash equivalents and trade and other
payables of RMB10,361,000 and RMB10,361,000 were adjusted and included in the
Group’s consolidated financial statements as at 1 January 2013.
— 10 —

These adjustments did not affect the net profit or net assets of the Group as at 31
December 2013 or before.
(b) Besides, the Investigation also revealed that the marketing and promotion expenses
paid by the Group to the MRAs under the Revised Sales Model mentioned above
(including those paid to the Consolidated MRAs), together with certain distributions
costs directly incurred by the Group, were eventually reimbursed to either the Group’s
distributors or certain third parties recipients designated by the Group’s distributors
through various means (“Reimbursement Activities”). The Directors of the Company
considered that the relevant marketing and promotion expenses should be adjusted and
accounted for as a reduction of the revenue earned from the distributors. As a result,
a prior year adjustment was recorded to offset the related revenue and distribution
costs of RMB2,146,298,000 for the year ended 31 December 2013.
This adjustment did not affect the net profit or net assets of the Group as at 31
December 2013 or before.
The effects of the above adjustments on the consolidated financial statements are
summarised in Note (iii) below.
(ii) Off-book transactions conducted through employees’ personal bank accounts
The Investigation also revealed that the Group had certain off-book transactions that were
conducted through certain personal bank accounts, which were opened in the names of
certain employees of the Group (referred to as “off-book transactions”). These off-book
transactions mainly included: (1) sales of distribution rights; (2) payments of distribution
rights; (3) deposits from certain distributors; and (4) payments of salary of and other
expenses incurred by certain employees of the Group. Based on the Investigation findings,
these off-book transactions were not previously accounted for and recorded in the Group’s
consolidated financial statements. The Directors of the Company considered that the prior
year consolidated financial statements should be adjusted.
As a result of this prior year adjustment, total income/gains and expenses of
RMB10,589,000 and RMB28,719,000, respectively; and total assets and liabilities of
RMB20,594,000 and RMB81,440,000, respectively were adjusted and included in the
Group’s consolidated financial statements as at and for the year ended 31 December 2013.
In addition, total assets and liabilities of RMB12,780,000 and RMB55,496,000 were
adjusted and included in the Group’s consolidated financial statements as at 1 January
2013.
The effects of the above adjustments on the consolidated financial statements are
summarised in Note (iii) below.
— 11 —
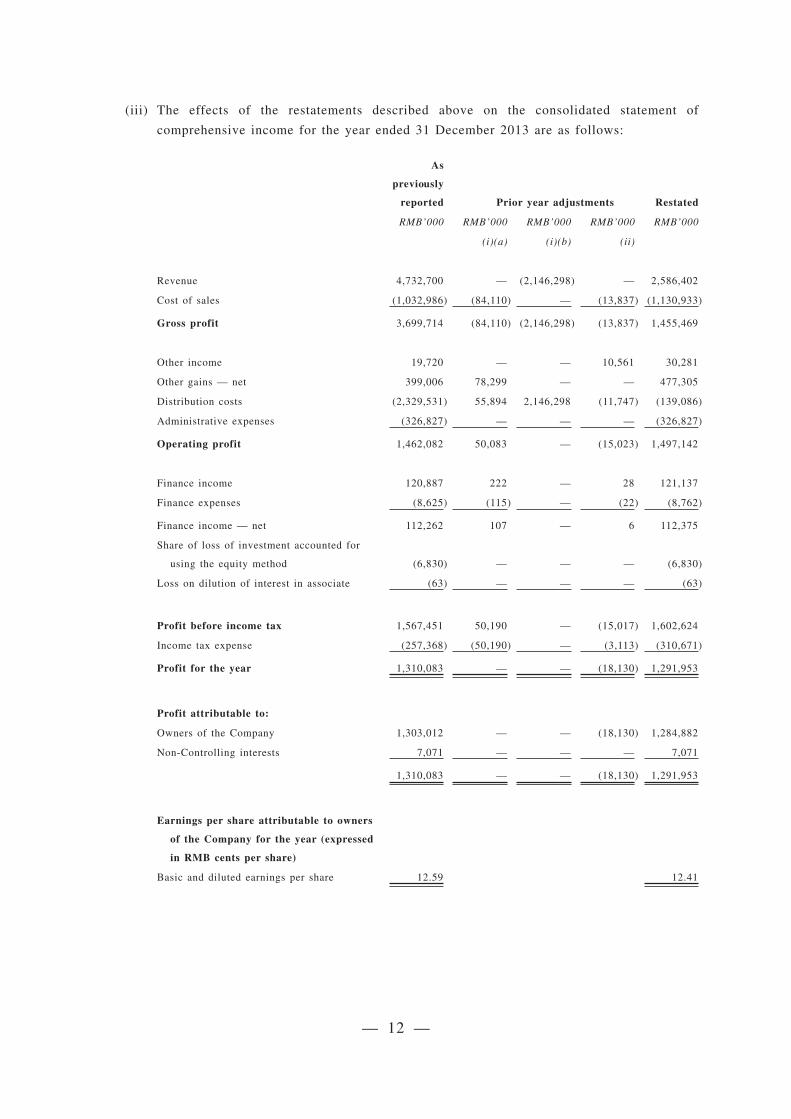
(iii) The effects of the restatements described above on the consolidated statement of
comprehensive income for the year ended 31 December 2013 are as follows:
As
previously
reported Prior year adjustments Restated
RMB’000 RMB’000 RMB’000 RMB’000 RMB’000
(i)(a) (i)(b) (ii)
Revenue 4,732,700 — (2,146,298) — 2,586,402
Cost of sales (1,032,986) (84,110) — (13,837) (1,130,933)
Gross profit 3,699,714 (84,110) (2,146,298) (13,837) 1,455,469
Other income 19,720 — — 10,561 30,281
Other gains — net 399,006 78,299 — — 477,305
Distribution costs (2,329,531) 55,894 2,146,298 (11,747) (139,086)
Administrative expenses (326,827) — — — (326,827)
Operating profit 1,462,082 50,083 — (15,023) 1,497,142
Finance income 120,887 222 — 28 121,137
Finance expenses (8,625) (115) — (22) (8,762)
Finance income — net 112,262 107 — 6 112,375
Share of loss of investment accounted for
using the equity method (6,830) — — — (6,830)
Loss on dilution of interest in associate (63) — — — (63)
Profit before income tax 1,567,451 50,190 — (15,017) 1,602,624
Income tax expense (257,368) (50,190) — (3,113) (310,671)
Profit for the year 1,310,083 — — (18,130) 1,291,953
Profit attributable to:
Owners of the Company 1,303,012 — — (18,130) 1,284,882
Non-Controlling interests 7,071 — — — 7,071
1,310,083 — — (18,130) 1,291,953
Earnings per share attributable to owners
of the Company for the year (expressed
in RMB cents per share)
Basic and diluted earnings per share 12.59 12.41
— 12 —

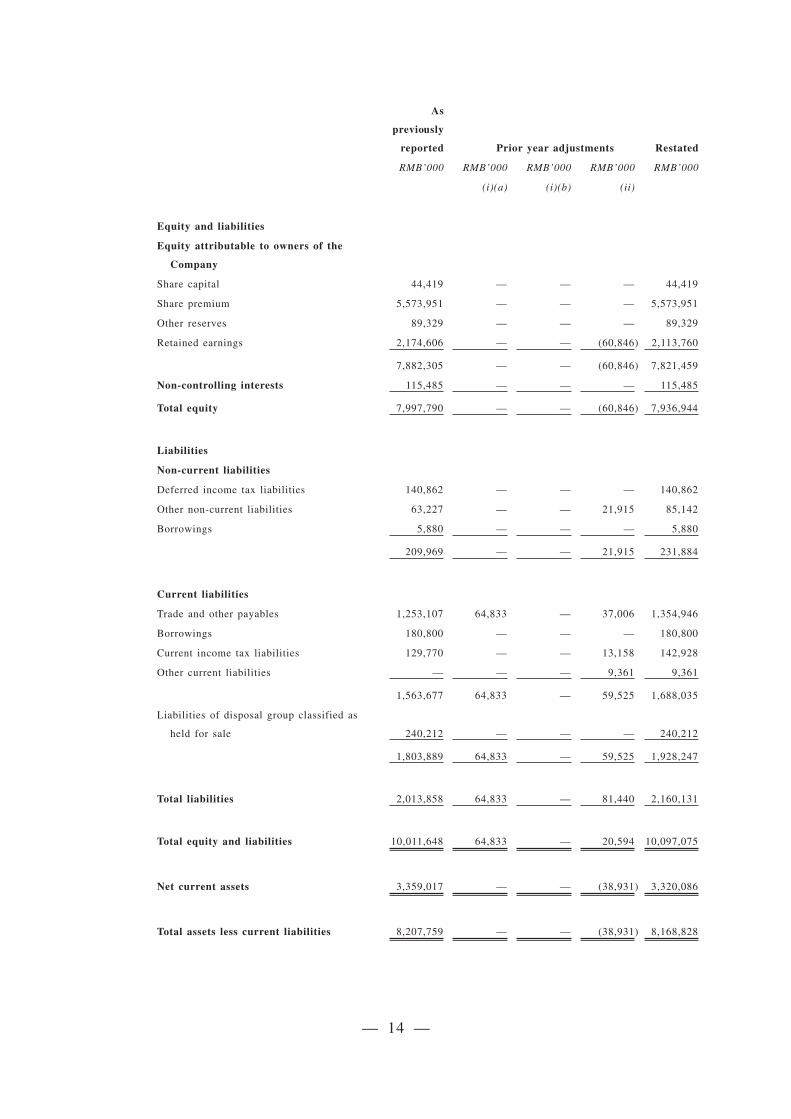
The effects of the restatements described above on the consolidated balance sheet at 31
December 2013 are as follows:
As
previously
reported Prior year adjustments Restated
RMB’000 RMB’000 RMB’000 RMB’000 RMB’000
(i)(a) (i)(b) (ii)
Assets
Non-current assets
Property, plant and equipment 1,441,677 — — — 1,441,677
Investment properties 34,437 — — — 34,437
Intangible assets 2,880,622 — — — 2,880,622
Land use rights 337,998 — — — 337,998
Investment accounted for using the equity
method 34,069 — — — 34,069
Deferred income tax assets 119,939 — — — 119,939
Other non-current assets — — — — —
4,848,742 — — — 4,848,742
Current assets
Inventories 101,283 — — — 101,283
Trade and other receivables 1,398,041 — — — 1,398,041
Available-for-sale financial assets 776,074 — — — 776,074
Term deposits with initial term of over three
months 233,651 — — — 233,651
Cash and cash equivalents 1,508,076 64,833 — 20,594 1,593,503
4,017,125 64,833 — 20,594 4,102,552
Assets of disposal group classified as held
for sale 1,145,781 — — — 1,145,781
5,162,906 64,833 — 20,594 5,248,333
Total assets 10,011,648 64,833 — 20,594 10,097,075
— 13 —
As
previously
reported Prior year adjustments Restated
RMB’000 RMB’000 RMB’000 RMB’000 RMB’000
(i)(a) (i)(b) (ii)
Equity and liabilities
Equity attributable to owners of the
Company
Share capital 44,419 — — — 44,419
Share premium 5,573,951 — — — 5,573,951
Other reserves 89,329 — — — 89,329
Retained earnings 2,174,606 — — (60,846) 2,113,760
7,882,305 — — (60,846) 7,821,459
Non-controlling interests 115,485 — — — 115,485
Total equity 7,997,790 — — (60,846) 7,936,944
Liabilities
Non-current liabilities
Deferred income tax liabilities 140,862 — — — 140,862
Other non-current liabilities 63,227 — — 21,915 85,142
Borrowings 5,880 — — — 5,880
209,969 — — 21,915 231,884
Current liabilities
Trade and other payables 1,253,107 64,833 — 37,006 1,354,946
Borrowings 180,800 — — — 180,800
Current income tax liabilities 129,770 — — 13,158 142,928
Other current liabilities — — — 9,361 9,361
1,563,677 64,833 — 59,525 1,688,035
Liabilities of disposal group classified as
held for sale 240,212 — — — 240,212
1,803,889 64,833 — 59,525 1,928,247
Total liabilities 2,013,858 64,833 — 81,440 2,160,131
Total equity and liabilities 10,011,648 64,833 — 20,594 10,097,075
Net current assets 3,359,017 — — (38,931) 3,320,086
Total assets less current liabilities 8,207,759 — — (38,931) 8,168,828
— 14 —

The effects of the restatements described above on the consolidated balance sheet at 1
January 2013 are as follows:
As
previously
reported Prior year adjustments Restated
RMB’000 RMB’000 RMB’000 RMB’000 RMB’000
(i)(a) (i)(b) (ii)
Assets
Non-current assets
Property, plant and equipment 924,052 — — — 924,052
Investment properties 30,894 — — — 30,894
Intangible assets 3,735,030 — — — 3,735,030
Land use rights 165,637 — — — 165,637
Investment accounted for using the equity
method 40,962 — — — 40,962
Trade and other receivables 154,192 — — — 154,192
Deferred income tax assets 265,176 — — — 265,176
Other non-current assets 122,521 — — — 122,521
5,438,464 — — — 5,438,464
Current assets
Inventories 91,472 — — — 91,472
Trade and other receivables 769,120 — — — 769,120
Available-for-sale financial assets 717,921 — — — 717,921
Term deposits with initial term of over three
months 898,560 — — — 898,560
Cash and cash equivalents 1,543,907 10,361 — 12,780 1,567,048
4,020,980 10,361 — 12,780 4,044,121
Assets of disposal group classified as held
for sale — — — — —
4,020,980 10,361 — 12,780 4,044,121
Total assets 9,459,444 10,361 — 12,780 9,482,585
— 15 —

As
previously
reported Prior year adjustments Restated
RMB’000 RMB’000 RMB’000 RMB’000 RMB’000
(i)(a) (i)(b) (ii)
Equity and liabilities
Equity attributable to owners of the
Company
Share capital 44,419 — — — 44,419
Share premium 5,573,951 — — — 5,573,951
Other reserves 65,256 — — — 65,256
Retained earnings 1,400,702 — — (42,716) 1,357,986
7,084,328 — — (42,716) 7,041,612
Non-controlling interests 102,927 — — — 102,927
Total equity 7,187,255 — — (42,716) 7,144,539
Liabilities
Non-current liabilities
Deferred income tax liabilities 208,532 — — — 208,532
Other non-current liabilities 207,407 — — 24,185 231,592
Borrowings 5,880 — — — 5,880
421,819 — — 24,185 446,004
Current liabilities
Trade and other payables 867,368 10,361 — 16,068 893,797
Borrowings 767,234 — — — 767,234
Current income tax liabilities 215,768 — — 10,045 225,813
Other current liabilities — — — 5,198 5,198
1,850,370 10,361 — 31,311 1,892,042
Liabilities of disposal group classified as
held for sale — — — — —
1,850,370 10,361 — 31,311 1,892,042
Total liabilities 2,272,189 10,361 — 55,496 2,338,046
Total equity and liabilities 9,459,444 10,361 — 12,780 9,482,585
Net current assets 2,170,610 — — (18,531) 2,152,079
Total assets less current liabilities 7,609,074 — — (18,531) 7,590,543
— 16 —

2.2 Changes in accounting policy and disclosures
(i) New and amended standards adopted by the Group
The following new and revised standards and amendments to existing standards that have
been adopted by the Group, which are mandatory for the financial year of the Group
beginning on or after 1 January 2014, are currently relevant and have no material impact
on the Group’s consolidated financial statements.
• Amendment to IAS 32, ‘Financial instruments: Presentation’, on offsetting financial
assets and financial liabilities. This amendment clarifies that the right of set-off must
not be contingent on a future event. It must also be legally enforceable for all
counterparties in the normal course of business, as well as in the event of default,
insolvency or bankruptcy. The amendment also considers settlement mechanisms.
• Amendments to IAS 36, ‘Impairment of assets’, on the recoverable amount disclosures
for non-financial assets. This amendment removed certain disclosures of the
recoverable amount of CGUs which had been included in IAS 36 by the issue of IFRS
13.
• IFRIC 21, ‘Levies’, sets out the accounting for an obligation to pay a levy if that
liability is within the scope of IAS 37 ‘Provisions’. The interpretation addresses what
the obligating event is that gives rise to the payment a levy and when a liability should
be recognised.
(ii) New and amended standards not yet adopted by the Group.
A number of new and revised standards and amendments to existing standards are effective
for annual periods beginning after 1 January 2014, and have not been early adopted by the
Group.
• Amendment to IAS 19 regarding defined benefit plans is effective for annual periods
beginning on or after 1 July 2014.
• Annual improvements 2012 are effective for annual periods beginning on or after 1
July 2014.
• Annual improvements 2013 are effective for annual periods beginning on or after 1
July 2014.
• IFRS 14 ‘Regulatory Deferral Accounts’ is effective for annual periods beginning on
or after 1 January 2016.
• Amendment to IFRS 11 on accounting for acquisitions of interests in joint operations
is effective for annual periods beginning on or after 1 January 2016.
— 17 —

• Amendments to IAS 16 and IAS 38 on clarification of acceptable methods of
depreciation and amortization is effective for annual periods beginning on or after 1
January 2016.
• Amendments to IFRS 10 and IAS 28 on sale or contribution of assets between an
investor and its associate or joint venture is effective for annual periods beginning on
or after 1 January 2016.
• Amendment to IAS 27 on equity method in separate financial statements is effective
for annual periods beginning on or after 1 January 2016.
• Annual improvements 2014 is effective for annual periods beginning on or after 1
January 2016.
• IFRS15 ‘Revenue from Contracts with Customers’ is effective for annual periods
beginning on or after 1 January 2017.
• IFRS 9 ‘Financial Instruments’ is effective for annual periods beginning on or after 1
January 2018.
The Group is in the process of making an assessment on the impact of these standards and
amendments to standards on the consolidated financial statements of the Group in the initial
application. The adoption of the above is not expected to have a material effect on the Group’s
consolidated financial statements.
3. SEGMENT INFORMATION
The chief operating decision-maker has been identified as the executive directors of the board
of the Company. The executive directors of the board of the Company review the Group’s
internal reporting in order to assess performance and allocate resources. Management has
determined the operating segments based on these reports.
The executive directors of the board of the Company consider the business from product
perspective. The Group is engaged in only one business segment, the research and development,
manufacturing and sale of pharmaceutical products in the PRC. During the year ended 31
December 2014, all sales are from distributors and none of the distributors of the Group from
whom the revenue amounted to 10% or more of the Group’s revenue (2013: None).
All of the Group’s operations, customers and most of the Group’s assets are located in the PRC.
Accordingly, no geographical analysis of revenue, non-current assets and customers is presented.
— 18 —

4. INTANGIBLE ASSETS
GoodwillCustomer
relationship
Deferreddevelopment
costs
Productdevelopment
in progress Others TotalRMB’000 RMB’000 RMB’000 RMB’000 RMB’000 RMB’000
At 1 January 2013Cost 2,744,495 406,931 727,837 191,171 22,354 4,092,788Accumulated amortisation — (73,465) (157,527) — (6,985) (237,977)Impairment (37,060) — (1,063) (81,658) — (119,781)
Net book amount 2,707,435 333,466 569,247 109,513 15,369 3,735,030
Year ended 31 December 2013Opening net book amount 2,707,435 333,466 569,247 109,513 15,369 3,735,030Additions — 27,001 — 22,314 183 49,498Transfer — — 2,700 (2,700) — —Disposal — — — (1,307) (3) (1,310)Transfer to disposal group classified as
held for sale (480,499) — (271,729) — (8) (752,236)Impairment charge — — — (6,979) — (6,979)Amortisation charge — (88,693) (51,638) — (3,050) (143,381)
Closing net book amount 2,226,936 271,774 248,580 120,841 12,491 2,880,622
At 31 December 2013Cost 2,263,996 433,932 428,616 209,478 22,521 3,358,543Accumulated amortisation — (162,158) (178,973) — (10,030) (351,161)Impairment (37,060) — (1,063) (88,637) — (126,760)
Net book amount 2,226,936 271,774 248,580 120,841 12,491 2,880,622
Year ended 31 December 2014Opening net book amount 2,226,936 271,774 248,580 120,841 12,491 2,880,622Additions — — 4,000 38,482 262 42,744Amortisation charge — (77,293) (27,293) — (3,069) (107,655)
Closing net book amount 2,226,936 194,481 225,287 159,323 9,684 2,815,711
At 31 December 2014Cost 2,263,996 433,932 432,616 247,960 22,783 3,401,287Accumulated amortisation — (239,451) (206,266) — (13,099) (458,816)Impairment (37,060) — (1,063) (88,637) — (126,760)
Net book amount 2,226,936 194,481 225,287 159,323 9,684 2,815,711
(a) Other intangible assets mainly comprise trademark and software.
— 19 —
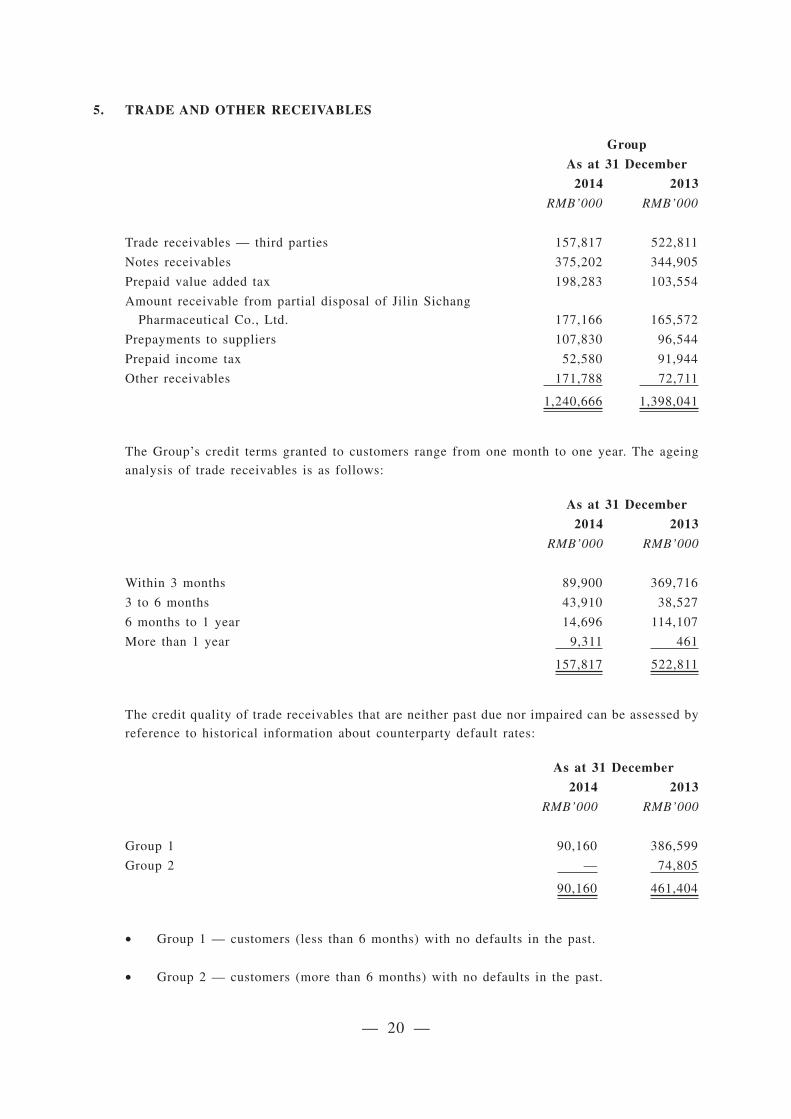
5. TRADE AND OTHER RECEIVABLES
Group
As at 31 December
2014 2013
RMB’000 RMB’000
Trade receivables — third parties 157,817 522,811
Notes receivables 375,202 344,905
Prepaid value added tax 198,283 103,554
Amount receivable from partial disposal of Jilin Sichang
Pharmaceutical Co., Ltd. 177,166 165,572
Prepayments to suppliers 107,830 96,544
Prepaid income tax 52,580 91,944
Other receivables 171,788 72,711
1,240,666 1,398,041
The Group’s credit terms granted to customers range from one month to one year. The ageing
analysis of trade receivables is as follows:
As at 31 December
2014 2013
RMB’000 RMB’000
Within 3 months 89,900 369,716
3 to 6 months 43,910 38,527
6 months to 1 year 14,696 114,107
More than 1 year 9,311 461
157,817 522,811
The credit quality of trade receivables that are neither past due nor impaired can be assessed by
reference to historical information about counterparty default rates:
As at 31 December
2014 2013
RMB’000 RMB’000
Group 1 90,160 386,599
Group 2 — 74,805
90,160 461,404
• Group 1 — customers (less than 6 months) with no defaults in the past.
• Group 2 — customers (more than 6 months) with no defaults in the past.
— 20 —

As at 31 December 2014 and 2013, no trade receivables were impaired and no allowance was
made. The trade receivables are fully performing.
The maximum exposure to credit risk at the reporting date is the carrying value of each class of
receivable mentioned above. The Group does not hold any collateral as security.
6. AVAILABLE-FOR-SALE FINANCIAL ASSETS
As at 31 December
2014 2013
RMB’000 RMB’000
At 1 January 776,074 717,921
Additions 8,748,780 6,467,400
Disposals (7,918,180) (6,410,300)
Change in fair value of available-for-sale financial assets 10,957 1,053
At 31 December 1,617,631 776,074
Available-for-sale financial assets include the following:
As at 31 December
2014 2013
RMB’000 RMB’000
Short-term investments 1,617,631 776,074
The amount represents short-term investments placed in certain PRC state-owned banking
institutions and reputable international financial institutions outside of PRC with maturity within
6 months and non-determinable return rate. These investments are all denominated in RMB.
The fair values of these investments are based on average estimated return rate of 4.59% (2013:
4.94%).
The maximum exposure to credit risk as at the reporting date is the carrying value of these
investments.
The credit quality of available-for-sale financial assets that are neither past due nor impaired can
be assessed by reference to external credit ratings (if available) or to historical information about
counterparty default rates. None of these financial assets is either past due or impaired.
— 21 —

7. SHARE CAPITAL AND SHARE PREMIUM
Number ofauthorised
ordinaryshares
Number ofissued andfully paidordinary
sharesShare
capitalShare
premium Total
’000 ’000 RMB’000 RMB’000 RMB’000
As at 1 January and
31 December 2013
(HK$0.01 per share) 10,000,000 5,175,024 44,419 5,573,951 5,618,370
Movement during 1 January
2014 to 31 December 2014:
Issuance of ordinary shares — 7,067 56 42,032 42,088
Increase of authorised ordinary
shares 90,000,000 — — — —
Bonus issue of ordinary shares — 5,182,091 41,135 (41,135) —
As at 31 December 2014
(HK$0.01 per share) 100,000,000 10,364,182 85,610 5,574,848 5,660,458
8. OTHER LIABILITIES
As at 31 DecemberAs at
1 January
2014 2013 2013
RMB’000 RMB’000 RMB’000
(Restated) (Restated)
Deferred revenue for sales of distribution right 102,369 94,503 43,200
Deferred government grants 83,881 — —
Deferred gain on partial disposal of Jilin
Sichang — — 193,590
186,250 94,503 236,790
Less: current portion
Deferred revenue for sales of distribution right 32,107 9,361 5,198
Deferred government grants 64,231 — —
96,338 9,361 5,198
Non-current portion 89,912 85,142 231,592
— 22 —
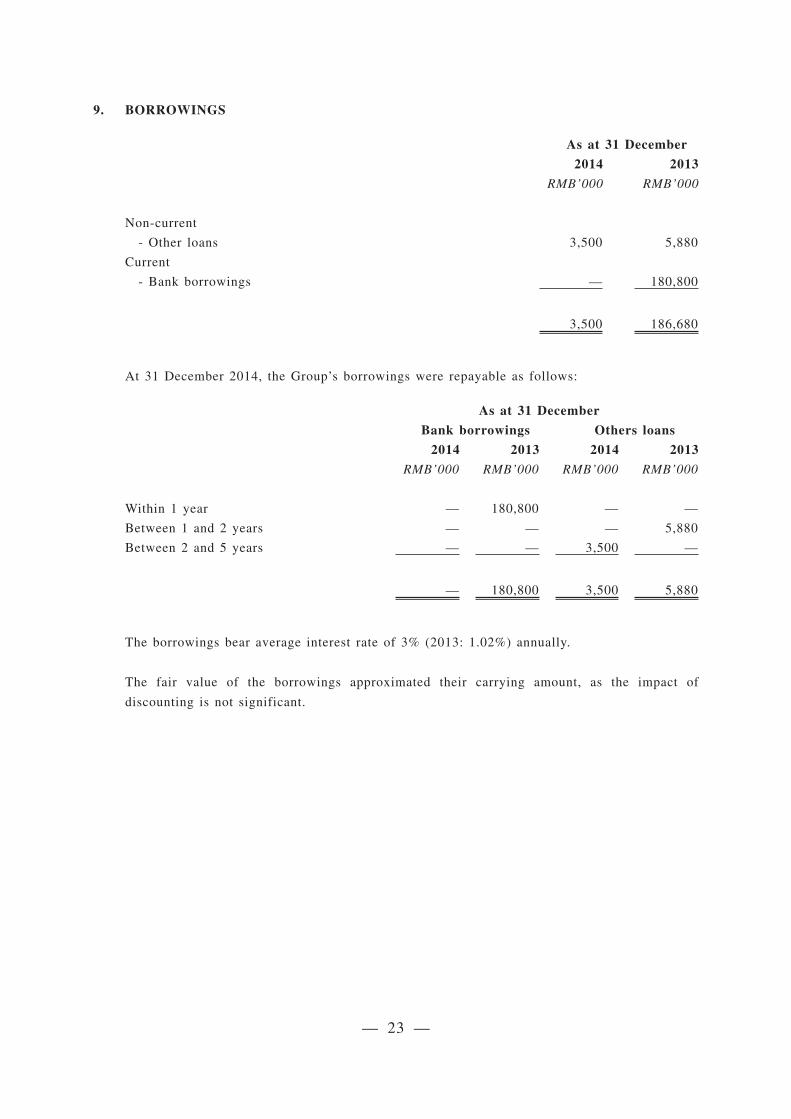
9. BORROWINGS
As at 31 December
2014 2013
RMB’000 RMB’000
Non-current
- Other loans 3,500 5,880
Current
- Bank borrowings — 180,800
3,500 186,680
At 31 December 2014, the Group’s borrowings were repayable as follows:
As at 31 December
Bank borrowings Others loans
2014 2013 2014 2013
RMB’000 RMB’000 RMB’000 RMB’000
Within 1 year — 180,800 — —
Between 1 and 2 years — — — 5,880
Between 2 and 5 years — — 3,500 —
— 180,800 3,500 5,880
The borrowings bear average interest rate of 3% (2013: 1.02%) annually.
The fair value of the borrowings approximated their carrying amount, as the impact of
discounting is not significant.
— 23 —

10. TRADE AND OTHER PAYABLES
As at 31 DecemberAs at
1 January2014 2013 2013
RMB’000 RMB’000 RMB’000(Restated) (Restated)
Trade payables 40,818 30,793 36,207Advances from customers 225,056 233,637 91,095Deferred gain on partial disposal Jilin Sichang
Pharmaceutical Co., Ltd. 193,590 193,590 —Costs of construction and purchase of
equipment payable 150,697 49,966 —Amount payable of related parties 135,906 — —Deposit payables 125,759 83,492 79,199Accured reimbursement to distributors 94,301 480,707 340,092Accrued performance bonus to directors 66,800 51,200 4,800Other taxes payable 19,972 37,541 18,323Salaries payable 14,710 12,340 7,941Amount payable regarding land use right — 47,970 —Advance of compensation from government for
demolition of existing premise — 36,638 30,000Payable for purchase of customer relationship — — 185,000Payable for the acquisition of subsidiaries — — 20,000Other payables 37,775 97,072 81,140
1,105,384 1,354,946 893,797
The fair values of trade and other payables approximated their carrying amounts.
At 31 December 2014, the ageing analysis of the trade payable based on invoice date is as
follows:
As at 31 DecemberAs at
1 January2014 2013 2013
RMB’000 RMB’000
(Restated)
RMB’000
(Restated)
Within 6 months 36,736 26,530 30,0786 months to 1 year 102 87 711More than 1 year 3,980 4,176 5,418
40,818 30,793 36,207
— 24 —
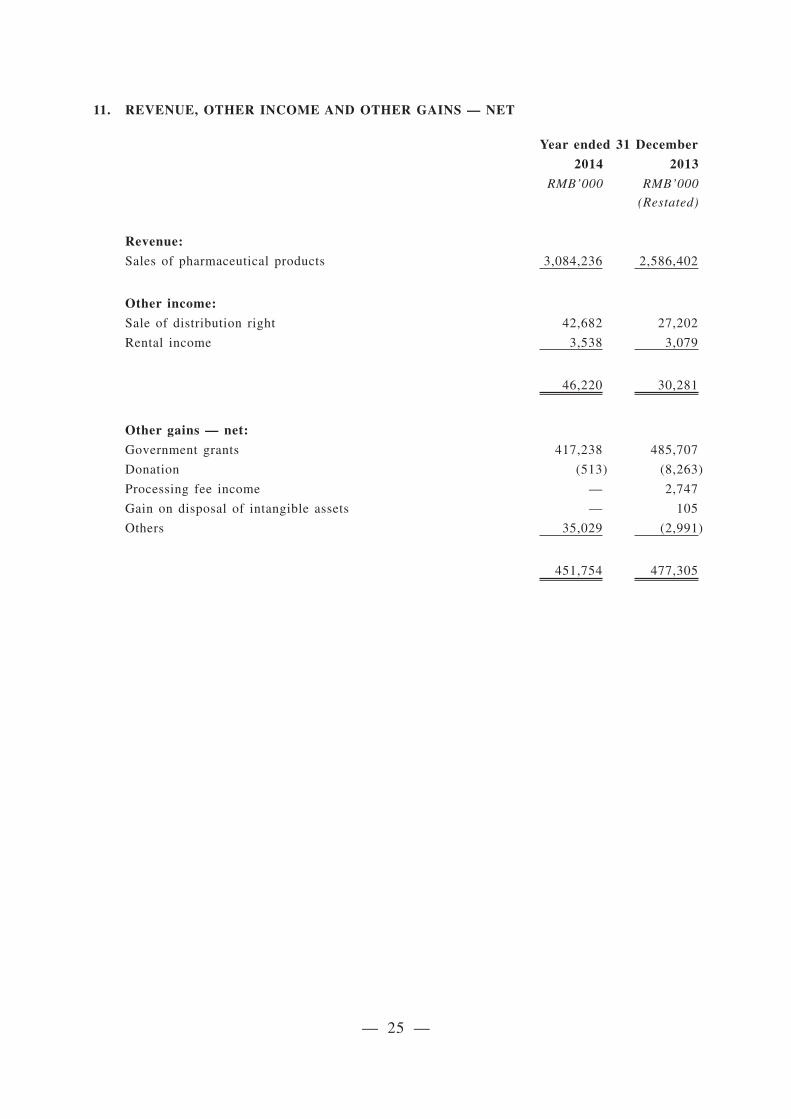
11. REVENUE, OTHER INCOME AND OTHER GAINS — NET
Year ended 31 December
2014 2013
RMB’000 RMB’000
(Restated)
Revenue:
Sales of pharmaceutical products 3,084,236 2,586,402
Other income:
Sale of distribution right 42,682 27,202
Rental income 3,538 3,079
46,220 30,281
Other gains — net:
Government grants 417,238 485,707
Donation (513) (8,263)
Processing fee income — 2,747
Gain on disposal of intangible assets — 105
Others 35,029 (2,991)
451,754 477,305
— 25 —

12. EXPENSES BY NATURE
Year ended 31 December
2014 2013
RMB’000 RMB’000
(Restated)
Research and development costs
Research expenses 121,354 31,990
Amortisation of deferred development costs 27,293 51,638
148,647 83,628
Raw materials used 633,627 748,675
Employee benefit expenses 299,321 238,757
Depreciation of property, plant and equipment 90,545 42,725
Depreciation of investment properties 1,778 1,639
Amortisation of intangible assets excluding the amortisation
of deferred development costs 80,362 91,743
Impairment of intangible assets — 6,979
Business tax and surcharges 69,203 161,461
Office expenses 53,091 43,795
Changes in inventories of finished goods and work in progress 48,237 15,970
Travelling expenses 38,321 31,967
Professional services expense 25,239 13,184
Transportation expenses 23,683 29,038
Utilities and property management fee 11,976 12,761
Amortisation of land use rights 9,448 8,115
Advertising expenses 6,066 2,475
Auditors’ remuneration
- Audit services 13,000 3,550
- Non-audit services 300 15
Entertainment expenses 5,556 8,213
Others 44,722 52,156
Total cost of sales, distribution costs andadministrative expenses 1,603,122 1,596,846
— 26 —

13. FINANCE INCOME AND EXPENSE
Year ended 31 December
2014 2013
RMB’000 RMB’000
(Restated)
Currency translation loss (11,715) —
Bank charges (472) (704)
Interest expense (5,817) (8,058)
Finance expenses (18,004) (8,762)
Currency translation gain — 23,179
Interest income 116,983 97,958
Finance income 116,983 121,137
Net finance income 98,979 112,375
14. INCOME TAX EXPENSE
Year ended 31 December
2014 2013
RMB’000 RMB’000
(Restated)
Current tax 340,981 142,913
Deferred tax 47,561 167,758
Income tax expense 388,542 310,671
No Hong Kong profits tax has been provided as the Group had no assessable profit arising in
Hong Kong during 2014 (2013: nil).
— 27 —

The tax on the Group’s profit before tax differs from the theoretical amount that would arise
using the weighted average tax rate applicable to profits of the consolidated entities as follows:
Year ended 31 December
2014 2013
RMB’000 RMB’000
(Restated)
Profit before tax 2,073,423 1,602,624
Tax calculated at the PRC statutory tax rate of 25%
(2013: 25%)
518,356 400,656
Tax effects of:
— Withholding tax on the earnings expected to be remitted
by subsidiaries — 33,000
— Utilisation of previously unrecognised tax losses (2,826) (4,482)
— Effect of tax reduction and exemption (150,559) (131,157)
— Reversal of over provision — (122,751)
— Effect on change of effective tax rate — 81,597
— Expenses not deductible for tax purposes 21,466 50,203
— Tax losses for which no deferred income tax asset was
recognised 2,105 3,605
Income tax expense 388,542 310,671
15. EARNINGS PER SHARE
(a) Basic
Basic earnings per share is calculated by dividing the profit attributable to owners of the
Company by the weighted average number of ordinary shares in issue during the year.
Year ended 31 December
2014 2013
(Restated)
Profit attributable to owners of the Company (RMB’000) 1,671,281 1,284,882
Weighted average number of ordinary shares in issue for
basic earnings per share (’000) 10,363,369 10,350,048
Basic earnings per share (RMB cents per share) 16.13 12.41
(b) Diluted
There is no dilution to earnings per share during 2014 and 2013 because there were no
potential dilutive ordinary shares existing during these years. The diluted earnings per
share equal the basic earnings per share.
— 28 —

16. DIVIDENDS
The dividends paid in 2014 were RMB243,558,000 with a bonus issue of one bonus ordinary
share at par value of HK$0.01 each for every 1 ordinary share held on the Bonus Issue Record
Date (2013: cash dividend of RMB522,677,000).
Final cash dividend for the year ended 31 December 2014 of RMB134,734,000 is recommended
by the board and is to be proposed at the forthcoming annual general meeting. These financial
statements do not reflect this dividend to be declared.
17. COMMITMENTS
(a) Capital commitments
Capital expenditure contracted for at the end of the reporting period but not yet incurred
is as follows:
As at 31 December2014 2013
RMB’000 RMB’000
Property, plant and equipment 215,150 310,748Commitment of additional capital injection to Renfang
Medical Holdings Ltd. 156,124 —Land use rights 58,179 —Intangible assets — product development in progress 18,447 20,481Commitment of investment in an associate 15,000 —
462,900 331,229
(b) Operating lease commitments
The Group leases various office premises under non-cancellable operating lease
agreements. The lease terms are between 1 and 5 years and the majority of lease agreements
are renewable at the end of the lease period at market rate.
The future aggregate minimum lease payments under non-cancellable operating leases are
as follows:
As at 31 December2014 2013
RMB’000 RMB’000
No later than 1 year 975 5,333Later than 1 year and no later than 2 years 1,166 900Later than 2 years 300 1,200
2,441 7,433
— 29 —

MANAGEMENT DISCUSSION AND ANALYSIS
The year 2014 was one in which Sihuan Pharmaceutical brought its operational
capabilities to the test. The market was impacted by intensifying market competition,
tightening of the medical insurance budget by the state, as well as further delays in
the provincial tender process with lower tender prices in several completed
provincial tenders.
Facing such pressures, Sihuan Pharmaceutical leveraged on its solid business
foundation and its flexible and proven business strategies. It maintained growth
momentum and above-market average profitability, and achieved sound operational
results. The Group also achieved breakthroughs in in-house research and
development (“R&D”) of new drugs and deepened cooperation with renowned
research institutions. The Group’s overall business operations and management level
reached a new high. These initiatives showcased Sihuan Pharmaceutical’s strength in
coping with market instability and making progress against such a backdrop.
(I) BUSINESS REVIEW
In 2014, the Group continued to maintain a stable operational growth momentum,
with profit attributable to owners of the Company increased by 30.1% year-on-year.
Sales revenue increased by 19.2% year-on-year. The Group’s promising products
maintained strong growth in sales, while the Group’s established products also
recorded steady sales growth. In addition, the Group’s R&D of new drugs achieved
breakthrough progress by successfully taking the first step towards international
development. During the Year, the Group continued to improve its production
systems and cost-control.
According to IMS Health Incorporated (“IMS”), the Group maintained its No. 1
position in the cardio-cerebral vascular (“CCV”) prescription drug market of China
in 2014, with market share reaching 10.97% in terms of hospital purchase. Moreover,
the Group was ranked as the fourth largest pharmaceutical company in the Chinese
hospital market. This further reinforced the Group’s leading position in China’s CCV
prescription drug market and hospital market.
— 30 —

(i) Sales of Key Products
(a) CCV products
In 2014, sales of CCV products accounted for 91.3% of the Group’s total revenue.
The Group’s two core key products, Kelinao and Oudimei, recorded strong sales
growth. The sales of the Group’s promising products such as Oudimei, Yuanzhijiu,
Yeduojia, Danshen Chuanxiongqin and Salivae Miltiorrhizae Liguspyragine
Hydrochloride and Glucose Injection grew by over 35%. Sales of some of the Group’s
promising products grew by over 50%, namely Yuanzhijiu and Danshen
Chuanxiongqin. The sales of some established products such as Qu’Ao, GM1 and
Chuangqing, etc, have been affected by the product supply shortage in the first half
of 2014. The Group saw improvement in the second half of the Year.
Sales of key CCV products:
Product name
Revenue for the yearended 31 December
Change insales
year-on-year
2013(Restated)
2014
(RMB’000) (RMB’000)
Kelinao(Cinepazide maleate injection)
385,001 502,478 30.5%
Anjieli(Cinepazide maleate injection)
67,668 137,522 103.2%
Oudimei(Cerebroside- kinin injection)
438,452 611,513 39.5%
Yuanzhijiu(Troxerutin and cerebroproptein hydrolysate injection)
188,471 328,038 74.1%
Yeduojia(Compound trivitamin B for injection (II))
79,362 120,414 51.7%
— 31 —

Product name
Revenue for the yearended 31 December
Change insales
year-on-year
2013(Restated)
2014
(RMB’000) (RMB’000)
Danshen Chuanxiongqin injection(Salviae miltiorrhizae and ligustrazine hydrochlorideinjection)
133,952 204,397 52.6%
Yimaining(Alprostadil lipid emulsion injection)
193,824 238,934 23.3%
Guhong injection(Compound of aceglutamide and safflower extract)
328,451 177,688 -45.9%
Salivae Miltiorrhizae Liguspyragine Hydrochloride andGlucose Injection
14,791 21,455 45.1%
Chuanqing(Ligustrazine hydrochloride for injection)
97,429 85,464 -12.3%
GM1 (Monosialotetrade osylganglioside sodiuminjection)
218,070 148,471 -31.9%
Qu’Ao(Cerebroprotein hydrolysate)
103,555 112,266 8.4%
Qingtong(Edaravone injection)
75,794 77,352 2.1%
Scutellarin Glucose/Injection 559 1,619 189.7%
(b) Non-cardio-cerebral Vascular products (“Non-CCV products”)
In 2014, the Group achieved steady performance in the sales of its non-CCV
products. Several key products achieved sustainable growth in sales.
Sales of anti-epileptic drug Ren’Ao (Oxcarbazepine) rose 35.1% year-on-year, while
sales of respiratory system drugs Zhuo’Ao and Bi’Ao (Ambroxol hydrochloride)
increased by 9.2% and 9.5% year-on-year, respectively. Sales of Luoanming (Amino
acid injection) rose 18.5% year-on-year. Clindamycin, a drug on the national
Essential Drug Lists (“EDLs”), grew rapidly and achieved sales revenue of RMB34.7
million although with tender wins in only two provinces. The market expansion of
newly-launched products Roxatidine and Huineng was hindered by a further delay in
the tender process in 2014.
— 32 —

Sales of key Non-CCV products:
Product name
For the year ended31 December
Change insales
year-on-year
2013(Restated)
2014
(RMB’000) (RMB’000)
Ren’Ao (Oxcarbazepine) 14,616 19,747 35.1%
Zhuo’Ao(Ambroxol hydrochloride)
17,673 19,301 9.2%
Bi’Ao(Ambroxol hydrochloride)
52,214 57,170 9.5%
Luoanming(Amino acid injection)
72,910 86,398 18.5%
Clindamycin — 34,671 —
Roxatidine 725 2,606 259.7%
Huineng(Monoammonium Glycyrrhizinate and Cysteine andSodium Chloride Injection)
— 67 —
(ii) Sales and Marketing
With regards to sales and marketing, the Group’s focus in 2014 was to increase
market coverage and deepen penetration of promising products by seizing all
opportunities in provincial tender wins and supplementary tender submissions.
Meanwhile, the Group deepened the penetration of established products into
low-end markets through their inclusion in the provincial EDLs and provincial
New Rural Cooperative Medical Scheme Lists (“NRCMSLs”).
In 2014, the Group’s key products and newly-launched products achieved good
results in several completed provincial drug tenders, scoring several provincial
EDLs wins, non-EDLs wins, military tender wins and supplementary tender
submissions. In non-EDL tenders of Jilin Province, Hainan Province, Shanghai
Municipality (first batch) and Chongqing Municipality, the Group’s key products
and newly launched products won the tenders with reasonable bids. In EDL
tenders of Guangdong Province, Jilin Province, Hubei Province, Anhui Province,
Gansu Province, etc., the Group’s EDL products all won the respective tenders.
Encouraging results were also seen in supplementary tender submissions in
Hubei Province, Shandong Province and Liaoning Province, as well as military
tender wins in Guangzhou Military Region and People’s Liberation Army
Xinjiang Uighur Autonomous Region Garrison.
— 33 —

By the end of 2014, market coverage of our promising products, new productsand established products all grew.
Oudimei and Yuanzhijiu reached 24 and 23 provinces, respectively, while marketcoverage of Yeduojia and Yimaining expanded to more than 15 provinces.Danshen Chuanxiongqin expanded its market coverage to 10 provinces by tenderwins. Market coverage of new product Roxatidine, after tender wins in theXinjiang Uighur Autonomous Region and Jinlin province and supplementarytender submissions in Jiangsu Province, has expanded to 7 provinces, includingnew tender wins in the Guangzhou Military Region and supplementary tendersubmissions in Shandong Province, Hubei Province and Liaoning Province.Market coverage of newly-launched product Huineng has expanded to 4provinces, as a result of tender wins in Jilin Province and the Xinjiang UighurAutonomous Region, military tender wins in the Guangzhou Military Region andsupplementary tender submissions in Shandong Province.
In addition to tender submissions, the Group also actively seek opportunities toinclude products in various provinces’ Drug Reimbursement List (“DRL”), EDLand NRCMSL. Kelinao was included in the EDL of Guangdong Province,Xinjiang Uighur Autonomous Region and Anhui Province. Oudimei was includedin the EDL of Hubei Province and Xinjiang Uighur Autonomous Region.Yuanzhijiu was included in the EDL of Guangdong Province and ChongqingMunicipality. Chuanqing was included in the EDL of Guangdong Province,Xinjiang Uighur Autonomous Region, Anhui Province, Gansu Province andZhejiang Province. Yimaining was included in the EDL of Hubei Province andAnhui Province. GM1 was included in the EDL of Anhui Province, HubeiProvince and Xinjiang Uighur Automatous Region. The newly launched productsRoxatidine and Huineng were successfully included in the DRL of XinjiangUighur Automatous Region. Oudimei, Yimaining, Chuanqing and Metronidazolewere successfully included in the supplementary submissions of NRCMSL ofHubei Province. Moreover, Kelinao, Oudimei and Chuanqing also entered theNRCMSLs of more than 10 provinces respectively.
Academic promotional activities closely followed the progress of tendering andmarket coverage. In 2014, the Group achieved record-highs in organizing a totalof 5,231 academic promotional activities, including 5,038 small seminars at thedepartment and hospital levels, 116 regional medium-sized academicconferences and 77 national medical conferences. Furthermore, the Grouporganized 1,989 professional training sessions for distributors. Large andmedium-sized conferences further enhanced the brand image of SihuanPharmaceutical and its products, while small seminars at the department andhospital levels effectively promoted the products’ market expansion and sales.
— 34 —

The Group conducted clinical studies on its two core products, Kelinao andOudimei, to further enhance physicians’ understanding of the products. Thestudy titled “Mechanism study of cinepazide maleate on brain ischemia injury”(桂哌齊特抗腦缺血損傷機制研究), led by Xijing Hospital (西京醫院), exploredthe uniqueness of cinepazide maleate (桂哌齊特) as a calcium channel blocker.The paper “Cinepazide maleate protects PC12 cells against oxygen—glucosedeprivation injury” (桂哌齊特保護PC12細胞阻止缺氧缺糖損傷) was publishedin the June 2014 issue of Neurological Sciences. The study titled “TheReal-World-Research on Kelinao” (克林澳真實世界研究) led by The ThirdHospital of Peking University (北京大學第三醫院) has completed safetyobservation on over 18,000 patients. The data have been collected from clinicalcenters, and preliminary safety evaluation has been completed. The post-launchdrug revaluation of Oudimei, “Clinical Studies for Cerebroside-Kinin forTreatment of Ischemic Stroke” (腦苷肌肽對缺血性中風治療的臨床研究) led byThe Third Hospital of Peking University (北京大學第三醫院) and the “ClinicalStudies for Cerebroside-Kinin for Treatment of Hypertensive IntracerebralHemorrhage” (腦苷肌肽對高血壓腦出血治療的臨床研究) led by The GeneralHospital of People’s Liberation Army (中國人民解放軍總醫院) havesuccessfully recruited over 80% of patients. The study titled “Research onCerebroside-Kinin for Treatment of Alzheimer’s Disease” (腦苷肌肽對老年癡呆治療的研究) led by The General Hospital of People’s Liberation Army (中國人民解放軍總醫院) has completed.
To boost market expansion of the newly-launched products, the Group alsoinitiated the post-launch clinical studies on such products. The research project“The Pharmacological Action and Clinical Evaluation of Roxatidine Acetate” (羅沙替丁醋酸酯藥理作用與臨床評價) led by Beijing Hospital (北京醫院) has beensuccessfully completed, and published on the “Chinese Journal of New Drugs”(2014, 23 (14) : 1601-5), which provided professional guidance to physicians onthe newly launched drug.
(iii) R&D
The Group’s innovative drug R&D division, Shandong Xuanzhu PharmaceuticalTechnology Co., Ltd. (“Xuanzhu Pharma”), filed an application for clinicaltrial of Janagliflozin (加格列淨), a Category 1.1 innovative drug, to the ChinaFood and Drug Administration (“CFDA”) in the first half of 2014, and hasreceived official acceptance of the application (acceptance number:CXHL1400849 and CXHL1400850). In the second half of 2014, the divisionreceived approval of clinical trials for Tylerdipine Hydrochloride, anotherCategory 1.1 innovative drug from CFDA. By the end of 2014, the division hassuccessfully filed a total of eight internally developed Category 1.1 innovative
— 35 —

drugs, and five of them have received approval for clinical trials. Phase Ia andIb clinical trials of Imigliptin Dihydrochloride (鹽酸依格列清) have completedas planned with encouraging results from the completed studies, which showedtremendous safety therapeutic window. Currently, it has entered into Phase Icclinical trials directed at patients and have made smooth progress. Clinical trialsof Anaprazole Sodium (安納拉唑鈉) and Benapenem (百納培南), two otherCategory 1.1 innovative drugs, also successfully commenced during the Year.
Worthy of mentioning was that at the end of 2014 the Group successfully filedan Investigational New Drug (“IND”) application for Pirotinib (哌羅替尼) to theUnited States (“U.S.”) Food and Drug Administration (“FDA”) and officiallygranted clinical trial approval. The first patient has been successfully enrolledfor clinical trials in the U.S.. This further showcased the Group’s breakthroughprogress in the international development of new drugs.
Several new production license applications were filed by the Group’s genericdrug division, the Beijing Aohe Drug Research Institute, during the Year. Wehave filed applications for a total of 27 generic drugs to be approved forproduction by the end of 2014, including Bisoprolol Fumarate (富馬酸比索洛爾), Losartan Potassium (氯沙坦鉀), Lansoprazole (蘭索拉唑), Esomeprazole(埃索美拉唑), Fasudil Hydrochloride (鹽酸法舒地爾), Octreotide Acetate (醋酸奧曲肽), Vinpocetine (長春西汀), Flurbiprofen Axetil (氟比洛芬酯), Oxiracetam(奧拉西坦), Esomeprazole Sodium (埃索美拉唑鈉), Caspofungin Acetate(醋酸卡泊芬淨) etc. These products are expected to be launched to the market inthe next three years. Also, more than 20 new projects commenced developmentduring the Year. In total, the Group has over 70 generic drugs underdevelopment, among which 22 are Category 3 new drugs such as LevetiracetamInjection (左乙拉西坦注射劑), Lacosamide (拉科醯胺), Ornithine AspartateInjection (Hepa-Merz) (門冬氨酸鳥氨酸注射劑), Rivastigmine HydrogenTartrate Capsules (重酒石酸卡巴拉汀膠囊), Caspofungin Acetate for Injection(注射用醋酸卡泊芬淨), Flupirtine Maleate Capsules (馬來酸氟吡汀膠囊),Divalproex sodium Tablets (雙丙戊酸鈉腸溶片), Revaprazan Hydrochloride(鹽酸洛氟普啶) and (R)-Lansoprazole (右旋蘭索拉唑).
Phase III clinical trial of L-Phencynonate Hydrochloride (左旋鹽酸苯環壬酯), aCategory 1.3 innovative drug, has completed and currently the data is underreview. Phase II clinical trial of Cinepazide Mesilate (甲磺酸桂哌齊特), aCategory IV exclusive new drug, is close to completion.
In addition to in-house R&D, we achieved milestone developments in ourcooperation with renowned research institutions. The Group’s product pipelinewas further enhanced in terms of quality and quanity through collaboration with
— 36 —

Chongqing Peg-Bio Biotechnology Co., Ltd, with the development of fiveinsulin products, which include Active Pharmaceutical Ingredient (“API”) andFinished Pharmaceutical Product (“FPP”) of Recombinant Degludec Insulin(重組德穀胰島素), API and FPP of Recombinant Aspart Insulin(重組門冬胰島素), API and FPP of Recombinant Regular Insulin(重組普通胰島素), and two mix FPP of Insulin.
In addition, the Group applied for a total of RMB20.7 million worth of nationaland provincial science and technology grant in 2014. Of this, RMB12.7 millionhad already been disbursed, including major projects such as ImigliptinDihydrochloride (鹽酸依格列汀), Benapenem (百納培南) and L-PhencynonateHydrochloride (左旋鹽酸苯環壬酯).
(iv) Production Management and Quality Control
After the upgrading and certification of the new Good Manufacturing Practice(“GMP”) standards in 2013, the Group’s production facilities gradually achievedsmooth operations. Our quality control and production management system hasbeen further enhanced to be able to meet market demand. All facilities did notrecord any quality-related incidents.
The production facility of the Group’s APIs business, Langfang Gaobo JingbandPharmaceutical Co., Ltd (“Langfang Gaobo Jingband”), passed an on-siteinspection by the FDA in July 2013 and received an Establishment InspectionReport (“EIR”) from the FDA in the first half of 2014. The Group’scollaboration with overseas enterprises, such as Canada-based Apotex Inc andIndia’s Dr. Reddy’s Laboratories Ltd. also commenced smoothly.
In spite of rising raw material and labor costs in recent years, the Groupmaintained cost efficiency of its production system by expanding the scale ofproduction and improving the manufacturing process and management.
(v) Investment and Acquisitions
In terms of capital operations, the Group also achieved progress. At the end of2014, the Group entered into a share acquisition and capital injection agreementwith Beijing Ruiye Drugs Manufacture Co. Ltd. (“Beijing Ruiye”). The Groupwill be interested as to 39% of the shares of Beijing Ruiye after completion ofthe share acquisition and capital injection, and will enjoy priority in themarketing and distribution of all products manufactured by Beijing Ruiye, whichhave high technical barriers and excellent properties, adding new competitiveimpetus to the Group’s rich product portfolio.
— 37 —

During the Year, the Group, as an equity shareholder, made indirect investments
in the medical service sector by injecting capital into Renfang Medical Holdings
Ltd. (“Renfang”) established by Sun Moral International Ltd. (“Sun Moral”), a
wholly-owned subsidiary of the Group, along with two investors, namely,
NHPEA IV Health Holding B.V. (“NHPEA IV Health” formerly known “MSPEA
Health Holding B.V.”) and Euromax Holdings Limited (“Euromax”).
(II) FUTURE PROSPECTS
(i) Industry outlook
Fueled by rapid urbanization, China’s ageing population, a worsening living
environment and the increasing stress of modern society, the rigid demand in the
domestic pharmaceutical market will continue to grow. Meanwhile, the market
potential brought by the expansion of national medical insurance coverage is far from
being fully realized, which will undoubtedly power the growth momentum of the
pharmaceutical industry.
On the other hand, the government has been curbing excessive growth of medical
insurance expenditure. The pharmaceutical industry will face enormous challenges
with the soon-to-be initiated reform on drug prices, lowering of provincial tenderprices and in-depth structural reforms in hospitals. Moreover, a rising industrial entrythreshold, high technical standards and stringent regulatory controls will speed up thepolarization and consolidation of the pharmaceutical industry.
Faced with challenges in 2015 and the next few years, the Group firmly believes thatintensifying competition will actually continue to accelerate market consolidation.Pharmaceutical companies equipped with integrated capabilities will benefit fromfurthered market consolidation and concentration and continue to flourish in the longrun.
(ii) 2015 and Future Outlook
Future growth guaranteed by rich promising products
The current comprehensive and diversified product portfolio will sustain the growthof Sihuan Pharmaceutical in 2015 and the next few years. The Group’s promisingproducts such as Oudimei, Yuanzhijiu, Yeduojia, Danshen Chuanxiongqin andYimaining still have considerable market potential. In addition, newly-launchedproducts such as Salviae Miltiorrhizae Liguspyragine Hydrochloride and GlucoseInjection, Roxatidine, Huineng, Breviscapine Sodium Chloride Injection, together
— 38 —
with products such as Clindamycin (克林黴素) and Metronidzole (甲硝唑), which
have been successfully included in national EDLs, are products with enormous
market potential and will sustain the growth of Sihuan Pharmaceutical over the next
few years.
To go a step further, the Group will continue to seize all opportunities for tender wins
and supplementary tender submissions while expanding to tier three and four low-end
markets in the economically developed regions, to support sales growth of these
promising products.
Strong product pipeline diversified by multiple pathways
More importantly, the Group has a proven capability of obtaining new product
resources through R&D, acquisitions and collaborations. Our blockbuster innovative
proprietary drug and first-to-market generic drug are set to launch in three years.
Meanwhile, we will actively seek opportunities for acquisitions and collaborations.
The steady stream of product resources will sustain the Group’s business growth in
the long-run.
Outstanding sales and marketing capabilities strengthened by timelyadjustments of market strategies
The Group will enhance its strong sales and marketing capabilities by making timely
adjustments to its strategies and continuing to strengthen its marketing network. In
addition, the Group will further step up academic promotions. We will also improve
the professional training and the quality of education provided to our marketing team
and distributors to keep pace with a changing and developing market.
(iii) Outlook
Withstanding market challenges in 2014 has exemplified Sihuan Pharmaceutical’s
resilience against instability, which is backed by our outstanding product pipeline,
strong capabilities in R&D, sales and marketing and product resources integration.
Looking ahead, Sihuan Pharmaceutical will effectively navigate through challenges,
promptly adjust business strategies, further reinforce its operational foundation and
actively seek opportunities for development. All in all, we are poised to capture
opportunities for development from the new wave of consolidation and integration
and to strengthen our market leadership in the pharmaceutical industry.
— 39 —

(III) FINANCIAL REVIEW
Turnover
In 2014, the Group continued to strengthen its CCV drugs business while promoting
sales of its products of other therapeutic areas. A stable growth trend was shown in
the sales operations of the Group with total revenue increased by approximately
RMB497.8 million or 19.2% from RMB2,586.4 million in 2013 to RMB3,084.2
million in 2014.
Sales of CCV drugs for the Year amounted to approximately RMB2,816.9 million,
representing an increase of approximately RMB458.2 million when compared with
2013, which accounted for approximately 91.3% of the Group’s total revenue.
Revenue derived from anti-infective drugs decreased slightly by approximately 1.8%
from RMB40.8 million in 2013 to RMB40.1 million in 2014, accounting for
approximately 1.3% of the Group’s total revenue. Revenue from sales of other drugs
increased by approximately 13.2% to RMB198.3 million, accounting for
approximately 6.4% of the Group’s total revenue.
Revenue derived from sales of APIs increased by 146.9% to RMB 28.9 million,
accounting for approximately 0.9% of the Group’s total revenue.
Cost of sales
The Group’s cost of sales for the Year amounted to approximately RMB972.8 million,
accounting for approximately 31.5% of the total revenue.
Gross profit
Gross profit of RMB2,111.4 million was recorded for the Year, representing an
increase of approximately RMB655.9 million when compared with RMB1,455.5
million in 2013. Overall gross profit margin increased from 56.3% in 2013 to 68.5%
in 2014, which was mainly due to change of product mix.
Other net gains
Other net gains declined from RMB477.3 million in 2013 to RMB451.8 million in
2014. This was mainly due to lesser government grants received in 2014 by the
Group.
— 40 —

Distribution costs
Distribution costs increased by RMB11.1 million to RMB150.2 million in 2014 ascompared to 2013.
Administrative expenses
Administrative expenses increased by 46.9% from RMB326.8 million in 2013 toRMB480.1 million in 2014. The increase was primarily due to an increase inadministrative expenses related to the operational expansion of the Group and anincrease in the Group’s investment in R&D.
Net finance income
Net finance income decreased from RMB112.4 million in 2013 to RMB99.0 millionin 2014. The decrease was mainly due to the decrease in foreign exchange gains ofthe Group.
Profit before income tax
Due to the aforesaid, the Group’s profit before income tax increased by 29.4% fromRMB1,602.6 million in 2013 to RMB2,073.4 million in 2014.
Income tax expenses
Our income tax expenses increased by 25.1% from RMB310.7 million in 2013 toRMB388.5 million in 2014.
Profit for the Year
Due to the aforesaid, the Group’s net profit increased by 30.4% from RMB1,292.0million in 2013 to RMB1,684.9 million in 2014.
Profit attributable to owners of the Company
Profit attributable to owners of the Company increased by 30.1% from RMB1,284.9million in 2013 to RMB1,671.3 million in 2014.
Non-controlling interests
Non-controlling interests increased by RMB6.5 million from RMB7.1 million in2013 to RMB13.6 million in 2014.
— 41 —

Liquidity and financial resources
As at 31 December 2014, the Group’s cash and cash equivalents amounted toRMB1,317.9 million (31 December 2013: RMB1,593.5 million), term deposits withmaturities of over three months amounted to nil (31 December 2013: RMB233.7million), and available-for-sale financial assets amounted to RMB1,617.6 million (31December 2013: RMB776.1 million).
The Group generally deposits its excess cash in interest-bearing bank accounts andcurrent accounts. The Group may use extra cash for short-term investments in orderto obtain better returns. Therefore, members of the Group entered into agreementswith certain PRC state-owned banking institutions and reputable internationalfinancial institutions outside of PRC to invest the extra cash. According to suchagreements, during the Year, the total amount of investment by members of the Groupamounted to RMB1,604.6 million. The investments made by the Group according tothese agreements were categorized as short-term investments, which mainlyconsisted of financial planning products purchased from certain state-owned banksand reputable international financial institutions outside of PRC. For the saidfinancial planning products, the issuing banks of such financial planning productsmay invest the Group’s funds at their discretion into financial instruments such astreasury bonds, discounted bank acceptances, commercial acceptance bills and bankdeposits. The investment principal of RMB1,604.6 million plus interest ofapproximately RMB13.0 million in aggregate amounted to approximatelyRMB1,617.6 million, which was recognized as available-for-sale financial assets inthe consolidated balance sheet of the Group as at 31 December 2014. As at the dateof this announcement, total amount of sold/repaid investment principal amounted toRMB1,604.6 million.
Save as disclosed below, the Group did not have other liabilities and bank loans.
The Group has sufficient cash as at 31 December 2014. The Directors are of theopinion that the Group does not have any significant capital risk.
As at As at31 December
201431 December
2013RMB’000 RMB’000
(Restated)
Cash and cash equivalents 1,317,945 1,593,503Less: Borrowings (3,500) (186,680)
1,314,445 1,406,823
— 42 —

Trade and other receivables
The Group’s trade receivables consist of credit sales of our products to be paid by ourdistributors. Other receivables consist of an amount receivable from ShandongBuchang Pharmaceutical Co. Ltd., prepaid value added tax, prepayments to suppliers,deposits and other receivables. The Group’s trade and other receivables wereRMB1,240.7 million as at 31 December 2014, representing a decrease ofapproximately RMB157.3 million when compared with trade and other receivables ofRMB1,398.0 million as at 31 December 2013, which was mainly due to the decreasein credit sales resulting from the effects of sales policies.
Inventory
Inventory as at 31 December 2014 amounted to RMB177.2 million (as at 31December 2013: RMB101.3 million). Inventory turnover days of finished productswere 26.0 days in 2014 (2013: 17.2 days). We had no inventory impairments during2014.
Property, plant and equipment
Our property, plant and equipment consist of buildings, production and electronicequipment, motor vehicles and construction in progress. As at 31 December 2014, thenet book value of property, plant and equipment amounted to RMB1,704.1 million,representing an increase of approximately RMB262.5 million, or approximately18.2%, as compared with the previous year. The increase was mainly attributable tothe expansion or construction of existing and new production facilities, and thepurchase of equipment.
Intangible assets
The Group’s intangible assets mainly consist of goodwill, customer relationships,patents, deferred development costs and product development in progress. TheGroup’s goodwill arose from acquisitions of the subsidiaries. The deferreddevelopment costs and product development in progress mainly represent theacquisitions of certain pharmaceutical R&D projects from external researchinstitutions and its self-developed R&D projects. As at 31 December 2014, netintangible assets amounted to RMB2,815.7 million (31 December 2013: RMB2,880.6million).
Trade and other payables
The Group’s trade and other payables primarily consist of trade payables, advancesfrom customers, accrued expenses and other payables. As at 31 December 2014, trade
— 43 —

and other payables amounted to RMB1,105.4 million, representing a decrease ofapproximately RMB249.6 million as compared with 31 December 2013. The decreasewas mainly due to the decrease in payable of the accrued reimbursement todistributors at the end of 2014.
Contingent liabilities and guarantees
As at 31 December 2014, the Group had no material contingent liabilities orguarantees.
Off-balance sheet commitments and arrangements
As at 31 December 2014, apart from the capital and operating lease commitmentdisclosed, the Group has not entered into any off-balance sheet arrangements orcommitments to provide guarantees for any payment liabilities of any third parties.The Group did not have any variable interests in any unconsolidated entities thatprovide financing or liquidity, create market risk or offer credit support to us orengage in the provision of leasing, hedging or R&D services to the Group.
Capital commitment
As at 31 December 2014, the Group had a total capital commitment of RMB462.9million, mainly set aside for the acquisition of property, plant and equipment andintangible assets and investment in associated companies.
Credit risk
Credit risk refers to the risk of a counterparty defaulting on its contractualobligations resulting in a financial loss to us. We have no significant concentrationsof credit risk. Credit risk arises mainly from cash and cash equivalents, trade andother receivables and available-for-sale financial assets. The carrying amounts ofcash equivalents, short-term bank deposits, trade and other receivables andavailable-for-sale financial assets represent our maximum exposure to credit risk inrelation to our financial assets.
With respect to cash and cash equivalents, we manage the credit risk of cash in thePRC by placing our bank deposits in large PRC state-owned banks withoutsignificant credit risks. We manage the credit risk of cash outside the PRC by placingour bank deposits in financial institutions that have high credit quality.
With respect to trade and other receivables, we have policies in place to ensurecertain cash advances are paid by customers upon entering into the agreement relatedto sales orders. We assess the credit quality of the counterparties by taking intoaccount their financial positions, credit histories and other factors. We also undertake
— 44 —

certain monitoring procedures to ensure that proper follow-up action is taken to
recover overdue debts. We regularly perform ageing analysis, assess credit risks and
estimate the recoverability of groups of trade receivables bearing similar credit risks
based on historical data and cash collection history.
No other financial assets bear a significant exposure to credit risk.
Foreign exchange risk
RMB is the functional currency of the Company and its subsidiaries. All of the
revenues of the Group are derived from operations in the PRC. The financial
instruments of the Group are denominated in RMB. The Group is not subject to
material currency risk as the Group has no major cash and cash equivalents
denominated in foreign currency. Nevertheless, dividend payment of foreign
currency converted from RMB is subject to foreign exchange rules and regulations
promulgated by the PRC government. As at 31 December 2014, the Group had no
outstanding borrowings denominated in a foreign currency.
For the year ended 31 December 2014, the Group did not purchase any foreign
exchange, interest rate derivative products or relevant hedging tools.
Treasury Policies
The Group finances its ordinary operations with internally generated resources.
Capital expenditure
Our capital expenditure primarily consists of purchase of property, plant and
equipment, land use rights and intangible assets. In 2014, our capital expenditures
amounted to RMB752.9 million, of which RMB301.8 million was spent on property,
plant and equipment. Purchasing and self-developed intangible assets increased by
RMB191.7 million, and the remaining RMB259.4 million was spent on land use
rights.
Material acquisition and disposal
In 2014, the Group, as an equity shareholder, made indirect investments in the
medical service sector by injecting USD49.3 million (equivalent to RMB301.7
million) into Renfang, which is established by Sun Moral along with two investors.
Renfang is owned as to 38.14% by the Group.
— 45 —
Pledge of assets
As at 31 December 2014, none of our assets were pledged.
Human Resources and Remuneration of Employee
Human resources are indispensable assets to the success of the Group in acompetitive environment. The Group provides competitive remuneration package toall employees. The Group reviews its own human resources and remuneration policyregularly, to encourage employees to work towards enhancing the value of the Groupand promoting the long-term growth of the Group.
As at 31 December 2014, the Group had 2,797 employees. For the year ended 31December 2014, total salary and related costs of the Group was approximatelyRMB299.3 million (2013: RMB238.8 million).
PRE-EMPTIVE RIGHTS
There are no provisions for pre-emptive rights under the Company’s bye-laws or thelaws of the Bermuda, being the jurisdiction in which the Company was incorporated,which would oblige the Company to offer new shares on a pro rata basis to theexisting shareholders of the Company (the “Shareholders”).
DIRECTORS’ INTERESTS IN COMPETING BUSINESSES
During the Year, no Directors or their respective associates (as defined in the RulesGoverning the Listing of Securities (the “Listing Rules”) on the Stock Exchange) areconsidered to have an interest in a business which competes or is likely to compete,either directly or indirectly, with the business of the Group.
PUBLIC FLOAT
Based on the information that is publicly available to the Company and to the bestknowledge of the Directors, at least 25% of the Company’s issued share capital wereheld by members of the public as at the date of this announcement as required underthe Listing Rules.
PURCHASE, SALE OR REDEMPTION OF THE COMPANY’S LISTEDSECURITIES
Neither the Company nor any of its subsidiaries had purchased, sold or redeemed anyof the Company’s listed securities during the year ended 31 December 2014.
— 46 —

CORPORATE GOVERNANCE CODE
The Company has complied with all the applicable code provisions of the CorporateGovernance Code (the “Code”), as set out in Appendix 14 to the Listing Rulesthroughout the Year save and except from the deviation from code provision A.2.1 ofthe Code, namely, the roles of the chairman and chief executive officer have not beenseparated, from 1 January 2014 to 20 October 2014. Prior to 20 October 2014, Dr.Che Fengsheng held the roles of both chairman and chief executive officer of theCompany. The Board considered that Dr. Che Fengsheng, as one of the main foundersof the Company and possessing extensive medical and pharmaceutical industryknowledge together with unique strategic perspective, was suitably qualified to leadthe Company and formulate effective strategies to react promptly to market changesand new challenges. His service in both roles was beneficial to the stable and healthydevelopment of the Company. However, in order to enhance the level of corporategovernance, Dr. Che Fengsheng ceased to be the chief executive officer of theCompany, and Dr. Guo Weicheng, the deputy chairman and an executive Director ofthe Company, was appointed as the chief executive officer of the Company witheffect from 20 October 2014. Subsequent to the resignation of Dr. Che Fengsheng andappointment of Dr. Guo Weicheng as chief executive officer of the Company, theCompany has complied with all the applicable code provisions of the Code.
MODEL CODE FOR SECURITIES TRANSACTIONS BY THE DIRECTORS
The Company has adopted the Model Code for Securities Transactions by Directorsof Listed Issuers (“Model Code”) set out in Appendix 10 to the Listing Rules. Havingmade specific enquiries, all Directors confirmed that they have complied with therequired standard set out in the Model Code during the Year.
AUDIT COMMITTEE
The Company established an audit committee (the “Audit Committee”) inaccordance with the requirements of Rule 3.21 of the Listing Rules and with writtenterms of reference in compliance with the Code. The primary duties of the AuditCommittee are to assist the Board to provide an independent view on theeffectiveness of the financial reporting procedures, internal control and riskmanagement system of the Group, to oversee the audit process and to perform otherduties and responsibilities as assigned by the Board. As at the date of thisannouncement, the Audit Committee consists of one non-executive Director (Dr.Zhang Jionglong) and three independent non-executive Directors (Mr. Patrick Sun,Mr. Tsang Wah Kwong and Mr. Zhu Xun), and is chaired by Mr. Patrick Sun who hasa professional qualification in accountancy.
— 47 —

The Audit Committee had reviewed the Group’s financial reporting matters and theinternal control system in relation to finance and accounting and submittedimprovement proposals to elaborate on the work performed by the Audit Committeeto the Board.
The annual results of the Group for the year ended 31 December 2014 have beenreviewed by the Audit Committee.
NOMINATION COMMITTEE
The Company established a nomination committee (the “Nomination Committee”)with written terms of reference in compliance with the Code. The primary duties ofthe Nomination Committee are, among others, to review the structure, size andcomposition of the Board, to assess the independence of the independentnon-executive Directors and to make recommendations to the Board on mattersrelating to the appointment of Directors. As at the date of this announcement, theNomination Committee consists of one executive Director (Dr. Guo Weicheng) andthree independent non-executive Directors (Mr. Patrick Sun, Mr. Tsang Wah Kwongand Mr. Zhu Xun), and is chaired by Mr. Tsang Wah Kwong.
REMUNERATION COMMITTEE
The Company established a remuneration committee (the “RemunerationCommittee”) in accordance with the requirements of Rule 3.25 of the Listing Rulesand with written terms of reference in compliance with the Code. The primary dutiesof the Remuneration Committee are, among others, to review and determine the termsof remuneration packages, bonuses and other compensation payable to our Directorsand senior management and to make recommendations to the Board on the Group’spolicy and structure for remuneration of all our Directors and senior management. Asat the date of this announcement, the Remuneration Committee consists of oneexecutive Director (Dr. Che Fengsheng) and three independent non-executiveDirectors (Mr. Patrick Sun, Mr. Tsang Wah Kwong and Mr. Zhu Xun), and is chairedby Mr. Zhu Xun.
EXTRACT OF INDEPENDENT AUDITOR’S REPORT
PricewaterhouseCoopers were engaged to audit the consolidated financial statementsof the Group and a disclaimer of opinion was issued. The section below sets out anextract of the independent auditor’s report regarding the consolidated financialstatements of the Group for the year ended 31 December 2014:
“Basis for Disclaimer of Opinion
As disclosed in note 2.2 to the consolidated financial statements, during 2014 theCompany received an external enquiry (the “Enquiry”) as to how the Group has been
— 48 —

conducting its sales and marketing activities, which may have an impact on theaccounting treatment that the Group adopted in the past for certain sales revenue anddistribution expenses, as well as other financial reporting matters.
In response to the Enquiry, the audit committee of the Company (the “AuditCommittee”) conducted an independent investigation (the “Investigation”)involving, among others, assistant from a third party consultant in relation to thematters raised in the Enquiry.
As detailed in note 2.2 to the consolidated financial statements, based on the findingsof the Investigation, the directors of the Company considered it appropriate to makeadjustments to the Group’s consolidated financial statements for the year ended 31December 2013 and before, and consequently prior year adjustments were recordedby the Group in respect of the following matters:
(1) Sales model adopted since 2011 and reimbursement to distributors
(a) Certain marketing research agents (“Consolidated MRAs”), whose soleactivities are the provision of marketing related services to the Group, werepreviously considered as third parties but now, based on the substance of thetransactions, were considered to be controlled by the Group. Prior yearadjustments were raised to consolidate these Consolidated MRAs in theconsolidated financial statements of the Group.
As a result of these prior year adjustments, total income/gains and expensesof RMB78,521,000 and RMB78,521,000, respectively; cash and cashequivalents and trade and other payables of RMB64,833,000 andRMB64,833,000, respectively were adjusted and included in the Group’sconsolidated financial statements as at and for the year ended 31 December2013. In addition, cash and cash equivalents and trade and other payables ofRMB10,361,000 and RMB10,361,000 were adjusted and included in theGroup’s consolidated financial statements as at 1 January 2013. Totalincome/gains and expenses of RMB30,114,000 and RMB30,114,000,respectively; and cash and cash equivalents and trade and other payables ofRMB2,320,000 and RMB2,320,000, respectively relating to theConsolidated MRAs were consolidated in the Group’s consolidated financialstatements as at and for the year ended 31 December 2014.
(b) The marketing and promotion expenses paid by the Group to its marketingresearch agents (including those paid to the Consolidated MRAs) under arevised sales model adopted by the Group since 2011 were eventuallyreimbursed, directly or indirectly, to the Group’s distributors
— 49 —
(“Reimbursement Activities”). The Directors of the Company consideredthat the relevant marketing and promotional expenses should be adjustedand accounted for as a reduction of revenue earned from the distributorssince 2011.
As a result, a prior year adjustment was recorded to offset the relatedrevenue and distribution costs of RMB2,146,298,000 for the year ended 31December 2013. The corresponding amounts for year 2012 and beforeamounted to RMB1,714,514,000. For the year ended 31 December 2014,total distribution costs that have been offset against revenue amounted toRMB810,935,000.
(2) Off-book transactions conducted through employees’ personal bank accounts
The Group had certain off-book transactions that were conducted through certainpersonal bank accounts (referred to as “off-book transactions”) opened in thenames of certain employees of the Group. These off-book transactions andbalances were not previously accounted for and recorded in the Group’sconsolidated financial statements. The Directors of the Company considered thatthe prior year consolidated financial statements should be adjusted. As a resultof these prior year adjustments, total income/gains and expenses ofRMB10,589,000 and RMB28,719,000, respectively; and total assets andliabilities of RMB20,594,000 and RMB81,440,000, respectively were adjustedand included in the Group’s consolidated financial statements as at and for theyear ended 31 December 2013. In addition, total assets and liabilities ofRMB12,780,000 and RMB55,496,000 were adjusted and included in the Group’sconsolidated financial statements as at 1 January 2013. Total income/gains andexpenses amounting to RMB10,217,000 and RMB4,151,000, respectively; andtotal assets and liabilities amounting to RMB64,531,000 and RMB119,311,000,respectively relating to the off-book transactions were included in the Group’sconsolidated financial statements as at and for the year ended 31 December2014.
The details of these prior year adjustments together with their impacts are describedin note 2.2 to the consolidated financial statements.
In our prior years’ audits, we were not aware of nor were we informed bymanagement or the Directors of the Company of the fact that the Consolidated MRAsare controlled by the Group, the existence of the Reimbursement Activities with thedistributors and marketing research agents, as well as the off-book transactions. Inresponse to these matters, we have performed extended procedures in the currentyear’s audit, including a review of the findings of the Investigation. However, therewere limitations encountered in our audit as outlined below.
— 50 —

We were not able to obtain sufficient documentary evidence to assess whether theConsolidated MRAs are controlled by the Group and whether other marketingresearch agents (“MRAs”) not currently consolidated in the Group’s financialstatements are in fact also controlled by the Group such that consolidation of theseother MRAs are necessary. In addition, the Group did not maintain a complete set ofbooks and records of the aforesaid Consolidated MRAs to enable us to determinewhether the balances and transactions of these Consolidated MRAs were free frommaterial misstatements. In addition, the Consolidated MRAs have been taxed in thelocal province for corporate income tax purposes on a deemed taxation basisirrespective of the expenses recorded by these Consolidated MRAs. The Directors ofthe Company are of the opinion that there are no additional tax liabilities for theseConsolidated MRAs even though these expenses represented reimbursements to thedistributors of the Group. However, management was not able to provide us withsufficient documentary evidence to support the deemed taxation basis adopted by theConsolidated MRAs for tax reporting purpose.
We were not able to obtain sufficient and adequate documentary evidence to validatethe Reimbursement Activities mentioned above as the reimbursement transactionswere not all supported by complete or properly authorised reimbursement paymentrequests and authorisation letters from distributors, among others. We have also notreceived satisfactory confirmation replies from the Group’s distributors and otherrelevant parties to confirm the Reimbursement Activities and the related transactions.
Management was not able to provide us with satisfactory supporting documents tosupport the personal bank accounts are held by those individuals on behalf of theGroup. In addition, management did not maintain adequate accounting records andsupporting documents for the off-book transactions conducted through theseemployees’ personal bank accounts. We were also not able to obtain sufficientevidence to assess whether there are other off-book transactions not recorded by theGroup.
Because of the above scope limitations, there were no alternative audit proceduresthat we could perform to satisfy ourselves as to:
(1) whether the Consolidated MRAs are in fact controlled by the Group and thuswhether they should be consolidated in the Group’s consolidated financialstatements; as well as whether all MRAs controlled by the Group have beenconsolidated;
(2) the occurrence, accuracy, valuation, rights and obligation, existence andcompleteness of the transactions and balances related to the Consolidated MRAsand their related tax impacts; and whether or not the prior year adjustmentidentified, together with the relevant amounts recorded in 2014, are completeand accurate in all material respects;
— 51 —

(3) the occurrence, accuracy and completeness of the reimbursement transactionsincluding the Reimbursement Activities with the distributors and the offsettingof the Group’s distribution costs against its revenue; and whether or not the prioryear adjustment identified, together with the relevant amounts recorded in 2014,are complete and accurate in all material respects; and
(4) the occurrence, accuracy, valuation, rights and obligation and existence andcompleteness of the off-book transactions and balances and the related taximpacts; and whether or not the prior year adjustment identified, together withthe relevant amounts recorded in 2014, are complete and accurate in all materialrespects.
Accordingly, we were not able to obtain sufficient appropriate audit evidence todetermine whether any adjustments to the consolidated financial statements werenecessary.
Disclaimer of Opinion
Because of the significance of the matters described in the Basis of Disclaimer ofOpinion paragraphs, we have not been able to obtain sufficient appropriate auditevidence to provide a basis for an audit opinion. Accordingly, we do not express anopinion on the consolidated financial statements. In all other respects, in our opinionthe consolidated financial statements have been properly prepared in accordance withthe disclosure requirements of the Hong Kong Companies Ordinance.
Other Matters
This report, including the opinion, has been prepared for and only for you, as a body,in accordance with Section 90 of the Companies Act 1981 of Bermuda and for noother purpose. We do not assume responsibility towards or accept liability to anyother person for the contents of this report.”
MANAGEMENT RESPONSE
In order to facilitate a better understanding of the auditors’ disclaimer opinion,management of the Company wishes to furnish further information to the auditor’sdisclaimer opinion together with the relevant measures taken and to be taken bymanagement of the Company.
Background
Reference is made to the final results announcements of the Company dated 10 March2014 (the “2013 Results Announcement”) and this announcement (the “2014Results Announcement”) in relation to the final results of the Group for the years
— 52 —

ended 31 December 2013 (the “2013 Results”) and 31 December 2014 (the “2014Results”) respectively (together, the “Results”), and to the announcement of the
Company dated 19 April 2015 (the “Update Announcement”). Terms used in this
section shall have the same meanings as those defined in the Update Announcement
unless the context herein requires otherwise.
The purpose of this section to clarify and/or supplement certain information
contained in the 2013 Results Announcement and the 2014 Results Announcement.
The Company’s auditor (the “Auditor”) issued a disclaimer of opinion on the 2014
consolidated financial statements of the Group on 2 August 2015 (the “Disclaimer ofOpinion”).
Revised Sales Model and engagement of MRAs
As stated in the Update Announcement, with effect from the completion of certainacquisitions in 2011, the Group retained the Revised Sales Model for some of theGroup’s products in order to have an effective integration of their business with thatof the Group. The Revised Sales Model was used alongside the Group’s own salesmodel (the “Original Sales Model”). In the Original Sales Model, under which theGroup first worked with distributors, the distributors directly undertook marketingand promotional services. Under the Revised Sales Model, the Group engaged MRAsto provide marketing and promotional services; the MRAs became responsible forsettling their own expenses and the Group became responsible for settling the MRAs’fees, which were stipulated by the relevant market research services contracts (bywhich the MRAs were engaged). The selling prices of the Group’s products to thedistributors were then adjusted and increased accordingly after considering thesemarketing and promotion expenses under the Revised Sales Model.
Enquiry and internal investigation by the Audit Committee
In April 2014, the Company received an enquiry which, among others, mentioned theway that the Company had accounted for certain of the Group’s sales revenue anddistribution expenses (the “Revenue and Distribution Expenses”) in the past mighthave been inappropriate (the “Enquiry”).
In view of the matters mentioned in the Enquiry, the Company’s management haddiscussions with the Audit Committee, following which the Audit Committeeconducted the Investigation between June 2014 and May 2015. The scope of theInvestigation was determined by the Audit Committee in consultation with theAuditor. The scope includes understanding how the Group’s sales and marketing
— 53 —

activities were conducted, reviewing the accounting treatment (“AccountingTreatment”) adopted by the Company in the past in accounting for the Revenue andDistribution Expenses under the Revised Sales Model, assessing the impact (if any)to the Company’s financial reporting and other potential implications.
The Company’s management acted in compliance with the directions of the AuditCommittee during the Investigation, and also fully co-operated with the Auditor. Allthe information was provided to the Auditor and in the Investigation to the extent thatsuch information existed and was available; the Company also arranged interviews,especially with external parties, to the extent that such arrangements were possible.
Findings of the Investigation
The findings of the Investigation, concluded in around May 2015 and asmemorialised below, are that:
i. Under the Original Sales Model, the Group would supply the products to thedistributors, who would then engage independent sales representatives andsupply the products to commercial logistics companies, before the products weredistributed to hospitals;
ii. In the Revised Sales Model, the Group would engage the MRAs, some of whichare now deemed controlled by the Group, to provide marketing and promotionalservices. The marketing and promotion expenses paid by the Group to the MRAswere eventually reimbursed, directly or indirectly, by the MRAs to thedistributors or recipients designated by the distributors (the “ReimbursementActivities”);
iii. The total amount reimbursed to the distributors or their designated partiespursuant to the Reimbursement Activities in each of the years 2011, 2012 and2013 were, in all material respects, reconciled to the total amounts of marketingand promotion expenses paid to the MRAs and certain other expenses asrecorded in the books and accounts of the Group. The marketing and promotionexpenses and those other expenses were properly accrued and accounted for bythe Group as of the end of those years;
iv. Interviews conducted with some distributors and commercial logisticscompanies, all of which are external parties to the Group, acknowledged that theReimbursement Activities was attributable to the Revised Sales Model;
v. The Group did not have shareholdings in any MRAs; however certain MRAswhich were considered third parties are deemed controlled by the Group andshould be accounted for as structured entities of the Group;
— 54 —

vi. The Group had certain off-book transactions that were conducted through certainpersonal bank accounts, which were opened in the names of mostly employeesof the Group and under the control of the respective subsidiaries. These off-booktransactions were not previously accounted for and recorded in the Group’sconsolidated financial statements.
Accounting adjustments and changes on accounting treatment
Based on the findings of the Investigation which discovered that certain MRAs (inwhich the Group did not have shareholdings) were owned or part-owned byemployees and/or ex-employees of the Group (i.e. the Consolidated MRAs) and/orthat the Company had strong administrative influences over the Consolidated MRAs,which the Audit Committee were not aware of prior to its Investigation, the AuditCommittee formed an opinion that the Consolidated MRAs are deemed to becontrolled by the Group and should be consolidated into the Group’s financialaccounts (the “Consolidation”). The basis for the Audit Committee’s opinion thatcertain of the MRAs are deemed to be controlled by the Group and should beconsolidated into the Group’s financial statements is set out on pages 56 and 57 ofthis announcement. The reasons are also set out in Note 2.1(i) on page 10 of thisannouncement. Since the Company did not have any shareholdings in theConsolidated MRAs, the Company’s management previously took the view that theseConsolidated MRAs did not need to be consolidated into the Company’s accounts.
All Consolidated MRAs have been deregistered. The Group has ceased to, and doesnot currently, engage any Consolidated MRAs to distribute its products.
After considering the nature of the Reimbursement Activities as discovered in theInvestigation, the Audit Committee also formed an opinion that the AccountingTreatment of the relevant Revenue and Distribution Expenses should be modified,such that the relevant marketing and promotional expenses should have been offsetagainst revenues earned from the distributors since 2011 (“Adjustment”).
The Company’s management previously adopted an accounting treatment primarilybased on the form of the relevant transactions as opposed to their substance. TheDirectors of the Company revisited the Company’s management’s accountingjudgment on this. The Directors of the Company took a holistic view of the relevanttransactions, and considered that their substance should, on balance, prevail overtheir form. Hence, the Directors of the Company are of the opinion that the relevantmarketing and promotion expenses should be adjusted and accounted for as areduction of the revenue earned from the distributors. The Directors were promptedby the findings of the Investigation (as described in this announcement) to revisitthis.
— 55 —

As regards the use of personal bank accounts as discovered in the Investigation, inview of the business nature of the off-book transactions captured by such bankaccounts and that the accounts were used and closely monitored by the subsidiariesof the Group, the Audit Committee also considers that the Company should accountfor and record these off-book transactions in the Group’s consolidated financialstatements. The Audit Committee further considers that the Company should closethese personal bank accounts. As at the date of this announcement, all such personalbank accounts have ceased to be used by the Group and, to the extent that it is withinthe power of the Group, have been closed.
Further to the discussions among the Audit Committee, the Auditor and theCompany’s management, the board of directors of the Company (the “Board ofDirectors”) agrees with the Audit Committee that it is appropriate to consolidate theConsolidated MRAs into the Group’s financial statements, offset certain marketingand promotion expenses against revenues and account for the off-book transactionsin the financial statements. The Directors also conclude that the prior yearconsolidated financial statements should be adjusted accordingly.
Documents requested by the Auditor were provided to the extent that they were in thepossession of the Group, and all information gathered in the Investigation, includingbut not limited to the Group’s internal documentation, such as records on sales,marketing and promotional expenses and reimbursements under the Revised SalesModel, and relevant bank statements have been provided to the Auditor. In light ofthe above matters, the Auditor has performed extended procedures in the audit of the2014 Results. Details of the audit limitation have been discussed in the sectionheaded “EXTRACT OF INDEPENDENT AUDITOR’S REPORT” above.
The Audit Committee was disappointed by the Disclaimer of Opinion given by theAuditors. The view of the Audit Committee on the Disclaimer of Opinion has beenfully set out throughout the Management Response section of this announcement.
Revised Sales Model
Among other procedures, the Auditor requested third parties to furnish documentsand information. In some occasions, the requests of the Auditor could not be fullymet because the external parties either were reluctant to provide information, or didnot respond to such requests at all. In other occasions, the relevant entities have beendissolved, or the requested documents or records do not exist.
It is mentioned in the Disclaimer of Opinion that the Auditor had not receivedsatisfactory confirmation replies from the Group’s distributors and other relevantparties to confirm the Reimbursement Activities and the related transactions.
— 56 —
On this, the Audit Committee noted 18 of the Group’s distributors, 11 commerciallogistics companies and 7 recipients of the reimbursements under the Revised SalesModel were interviewed in the Investigation, and all those intervieweesacknowledged that the Reimbursement Activities were attributable to the RevisedSales Model.
Off-book business transactions conducted through employee’s personal bankaccounts
It is also as mentioned in the Disclaimer of Opinion that the Auditor could not obtainsufficient evidence to support that the personal bank accounts were held byindividuals on behalf of the Group and that there were inadequate accounting recordsand insufficient evidence to assess whether there were other off-book transactions.
On this, the Audit Committee noted that during the Investigation, 33 personal bankaccounts have been identified to be controlled by the Group. 20 personal bankaccounts have been used for the Reimbursement Activities; another 13 personal bankaccounts have been used for other business purposes of the Group from 2011 to 2014.
Bank statements of 27 bank accounts for the entire relevant period have beenprovided to the Auditor; partial information in relation to another 2 bank accounts hasalso been provided.
Further explanations regarding the prior year adjustments
Engagement of MRAs and the Reimbursement Activities under the Revised SalesModel
Before 2011, only the Original Sales Model was used throughout the Group. Whenthe Group made certain acquisitions in 2011, professional accountants and legalcounsel were engaged to advise the Group in those transactions and to conduct duediligence on the subject of the acquisitions (the “Target”).
The Target used a sales model different from the Original Sales Model used by theGroup; instead of relying on distributors, it directly engaged MRAs that wereexternal parties to provide marketing and promotional services. Under this salesmodel, the Target would adopt a higher selling price, and the marketing andpromotion expenses paid by the Target to the MRAs would be reimbursed to thedistributors.
It was agreed by the parties to the acquisitions that the sales model and marketingchannels of the Target should be retained until 2012 when the Group took overcontrol of the sales channels.
— 57 —

Also, the government monitored the retail price based on the ex-factory prices andthe National Development and Reform Committee undertook an inspection regardingthe pricing structure of the Group in 2010 and 2011. Furthermore, the localgovernment in the PRC was supportive of the Group to adopt the Revised SalesModel to increase the local fiscal revenue as the Meihekou Municipal government(梅河口市地方政府) would receive tax payments from the relevant MRAs and thehigher selling price would generally result in higher amount of value-added tax beingcharged by the local tax authorities in the PRC. In return, local government providedpreferential treatments and strong administration supports.
In light of such background, the Group adopted higher selling prices for some of theproducts. The adoption of such higher selling prices was disclosed in the 2012 annualreport, as well as in many communications to investors, including analyst meetingsand analyst communications.
It is the finding of the Investigation that the total amount reimbursed to thedistributors or their designated parties pursuant to the Reimbursement Activities ineach of the years 2011, 2012 and 2013 were, in all material respects, reconciled tothe total amounts of marketing and promotion expenses paid to the MRAs and certainother expenses as recorded in the books and records of the Group. The marketing andpromotion expenses and those other expenses were properly accrued and accountedfor by the Group as of the end of those years. And these amounts are now off-setagainst revenue in the Adjustment.
With effect from around end of 2013, the Group gradually reverted to the OriginalSales Model, with a view to (among others) increasing the competitiveness of theGroup’s products and managing operational risks based on the then prevailing marketconditions (including the government’s gradual relaxation on control over retailpricing of pharmaceutical products).
The Group has ceased all Reimbursement Activities and stopped using the RevisedSales Model in January 2015, except for the distribution of the Group’s products inFujian province of the PRC due to the requirements from the local government.
Due to requirements from the local government, the Group continues to adopt theRevised Sales Model for distribution of the Group’s products in the Fujian provinceand such transactions would only involve the use of MRAs that are not controlled bythe Group.
The Directors consider that there should be no additional tax liabilities for theConsolidated MRAs as the Consolidated MRAs paid the tax and made the relevantdeclaration in accordance with the requirements of the local tax authorities.
— 58 —

The Consolidated MRAs have been taxed in the local province for corporate incometax purposes on a deemed taxation basis. According to the Corporate Income Tax Lawof the PRC, where an entity is unable to accurately compute and report the taxableincome on an actual basis due to incomplete accounting records, inaccurate andunverifiable accounts or other reasons, the tax authorities are empowered to assessthe taxable income by “actual revenue deemed profit” method, or by reference to theprofit rate levels of entities in identical or similar industry. For a taxpayer who is ableto correctly ascertain its revenue or extrapolate its total revenue by using reasonablemethods, but is unable to correctly ascertain the relevant cost, the formula to be usedis as follows: Taxable income = total revenue amount x deemed profit rate assessedby tax authorities.
Off-book business transactions conducted through employee’s personal bankaccounts
It is the finding of the Investigation that the personal bank accounts were used by theGroup for the Reimbursement Activities and other business purposes which primarilyincluded sales of distribution rights, payments of distribution rights, deposits fromcertain distributors, and payments of salary of and other expenses incurred by certainemployees of the Group. The names of individuals holding the personal bankaccounts were mostly those of employees of the Group.
The Group used these personal bank accounts for the Reimbursement Activities andother business purposes, because it was of lower costs to maintain such accounts, andthey provided administrative convenience. The finance and commercial departmentsof certain subsidiaries of the Group were responsible for, and were involved in,monitoring these personal bank accounts.
During the Investigation, 33 personal bank accounts have been identified by theCompany’s management to be controlled by the Group, out of which bank statementsor partial information of 29 bank accounts were provided for analysis purpose.
The Audit Committee formed no view as to the reasons given by the Group for usingthe personal bank accounts for Reimbursement Activities and other business purpose,but was of the view that the Company should close the personal accounts and shouldaccount for and record the off-book transactions in the Group’s consolidatedstatements.
The Company’s management confirms that, to the best of their knowledge and belief,apart from the 33 personal bank accounts identified in the Investigation, the Groupdoes not control any other personal bank account that is being used for theReimbursement Activities and other business purposes.
— 59 —

The Company’s management also confirms that to the best of their knowledge andbelief, the adjustments made for the off-book transactions are accurate.
Review conducted in the Investigation and measures adopted
Following the Investigation, the Company has considered the findings of theInvestigation, the Reimbursement Activities, the sales models of the Group and theuse of personal bank accounts by the Group.
The Company has adopted the following measures to address the findings in theInvestigation and to further enhance its corporate governance:
i. all Consolidated MRAs have been deregistered as at the date of thisannouncement;
ii. all personal bank accounts controlled by the Group have ceased to be used by theGroup and, to the extent that it is within the power of the Group, have beenclosed as at the date of this announcement;
iii. the Group has ceased all Reimbursement Activities and stopped using theRevised Sales Model in January 2015, except for distribution of the Group’sproducts in the Fujian province of the PRC due to requirements of the localgovernment (which would only involve the use of MRAs that are not controlledby the Group); and
iv. the Group has set up a special committee led by the Chairman of the Group toprovide recommendations to management of the Company with a view to furtherenhancing the corporate governance of the Group.
ANNUAL GENERAL MEETING
The notice of the annual general meeting (“AGM”) will be published on theCompany’s website and the Stock Exchange’s website and sent to the Shareholdersin due course after the date of the forthcoming AGM has been determined. TheCompany will also publish further announcement in respect of the closure of registerof members for AGM in due course.
DIVIDEND
The Board recommended the payment of a final cash dividend of RMB1.3 cents pershare for the year ended 31 December 2014 in return for Shareholders’ support,subject to approval by the Shareholders at the forthcoming AGM. Together with an
— 60 —

interim cash dividend of RMB1.3 cents per share, the total cash dividend for the year
ended 31 December 2014 will be RMB2.6 cents per share. The Company will publish
further announcement in respect of the closure of register of members for the
entitlement of final cash dividend in due course.
SCOPE OF WORK OF PRICEWATERHOUSECOOPERS
The figures in respect of the Group’s consolidated balance sheet, consolidated
statement of comprehensive income, consolidated statement of changes in equity,
consolidated statement of cash flow and the related notes thereto for the year ended
31 December 2014 as set out in the preliminary announcement have been agreed by
the Group’s auditor, PricewaterhouseCoopers, to the amounts set out in the Group’s
audited consolidated financial statements for the year. The work performed by
PricewaterhouseCoopers in this respect did not constitute an assurance engagement
in accordance with Hong Kong Standards on Auditing, Hong Kong Standards on
Review Engagements or Hong Kong Standards on Assurance Engagements issued by
the Hong Kong Institute of Certified Public Accountants and consequently no
assurance has been expressed by PricewaterhouseCoopers on the preliminary
announcement.
PUBLICATION OF INFORMATION ON THE STOCK EXCHANGE WEBSITE
This announcement is published on the websites of the Company(www.sihuanpharm.com) and the Stock Exchange (www.hkexnews.hk). The annualreport of the Company for the year ended 31 December 2014 will be dispatched toShareholders and available on the above websites in due course.
EVENTS AFTER THE REPORTING PERIOD
In June 2015, the Group entered into a share acquisition agreement with independentthird parties for the acquisition of 70.7% equity interest in a hospital in Beijing fora consideration of RMB90,740,000. The Group is in the process of assessing theaccounting treatment for such acquisition.
APPRECIATION
The Board would like to express its sincere appreciation to our Shareholders,customers and suppliers for their continued support of the Group. The Board alsowishes to thank the Group’s management and staff for achieving remarkable progressin the Group’s business and their dedication and commitment for improving theGroup’s management.
— 61 —

CONTINUED SUSPENSION OF TRADING
Trading in the Company’s shares on the Stock Exchange has been suspended since
9:00 a.m. on 27 March 2015. Trading in the shares of the Company on the Stock
Exchange will remain suspended until further notice.
By order of the BoardSihuan Pharmaceutical Holdings Group Ltd.
Dr. Che FengshengChairman and Executive Director
Hong Kong, 2 August 2015
As at the date of this announcement, our executive Directors are Dr. Che Fengsheng (Chairman), Dr.
Guo Weicheng (Deputy Chairman and Chief Executive Officer) and Mr. Meng Xianhui; our
non-executive Directors are Dr. Zhang Jionglong and Mr. Homer Sun; and our independent
non-executive Directors are Mr. Patrick Sun, Mr. Tsang Wah Kwong and Mr. Zhu Xun.
— 62 —