Embed Size (px)
Citation preview
Q1
Q2
Q3
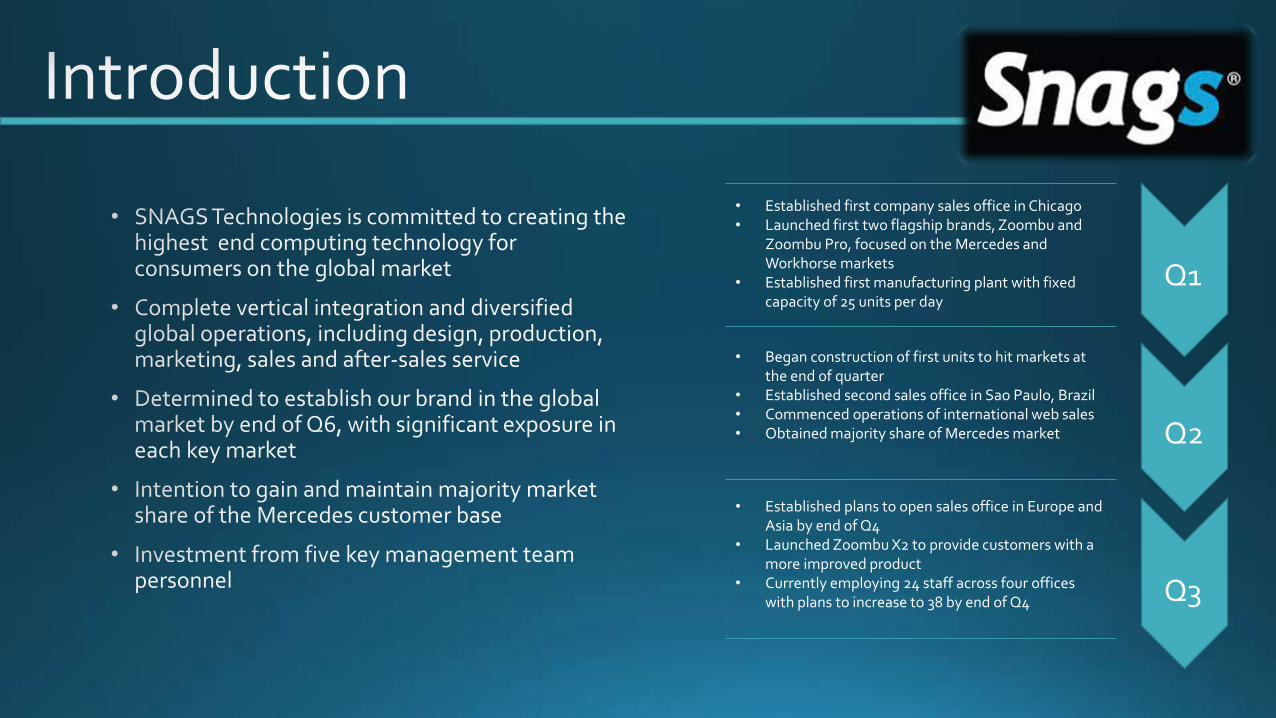
• Established first company sales office in Chicago• Launched first two flagship brands, Zoombu and
Zoombu Pro, focused on the Mercedes and Workhorse markets
• Established first manufacturing plant with fixed capacity of 25 units per day
• Established plans to open sales office in Europe and Asia by end of Q4
• Launched Zoombu X2 to provide customers with a more improved product
• Currently employing 24 staff across four offices with plans to increase to 38 by end of Q4
• Began construction of first units to hit markets at the end of quarter
• Established second sales office in Sao Paulo, Brazil• Commenced operations of international web sales• Obtained majority share of Mercedes market
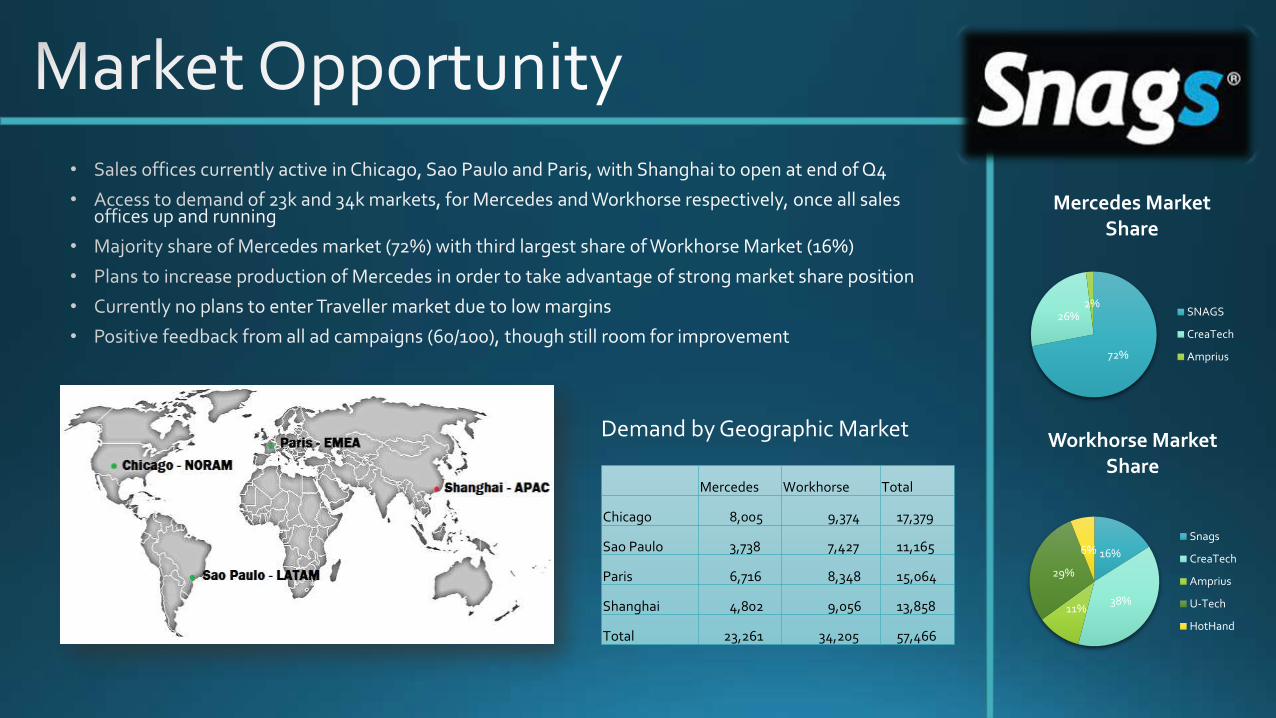
Demand by Geographic Market
Mercedes Workhorse Total
Chicago 8,005 9,374 17,379
Sao Paulo 3,738 7,427 11,165
Paris 6,716 8,348 15,064
Shanghai 4,802 9,056 13,858
Total 23,261 34,205 57,466
72%
26%2%
Mercedes Market Share
SNAGS
CreaTech
Amprius
16%
38%11%
29%
6%
Workhorse Market Share
Snags
CreaTech
Amprius
U-Tech
HotHand
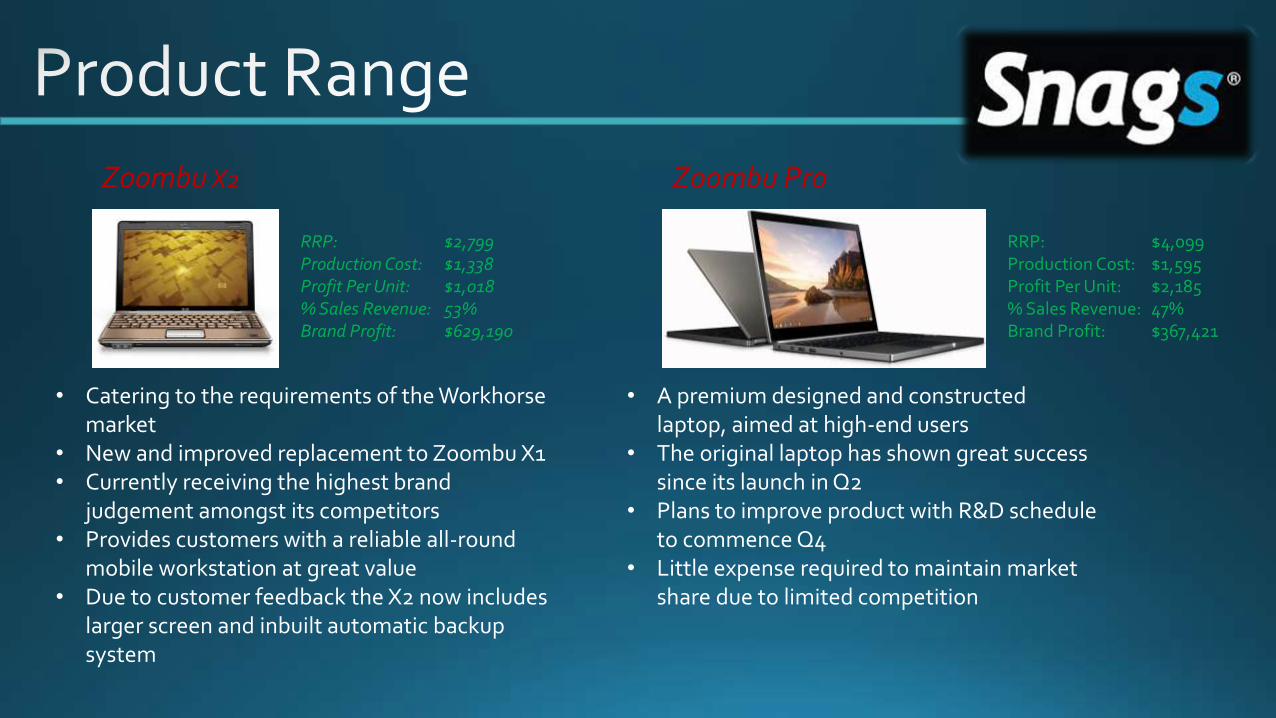
Zoombu X2 Zoombu Pro
• Catering to the requirements of the Workhorse market
• New and improved replacement to Zoombu X1• Currently receiving the highest brand
judgement amongst its competitors• Provides customers with a reliable all-round
mobile workstation at great value• Due to customer feedback the X2 now includes
larger screen and inbuilt automatic backup system
• A premium designed and constructed laptop, aimed at high-end users
• The original laptop has shown great success since its launch in Q2
• Plans to improve product with R&D schedule to commence Q4
• Little expense required to maintain market share due to limited competition
RRP: $2,799Production Cost: $1,338Profit Per Unit: $1,018% Sales Revenue: 53%Brand Profit: $629,190
RRP: $4,099Production Cost: $1,595Profit Per Unit: $2,185% Sales Revenue: 47%Brand Profit: $367,421
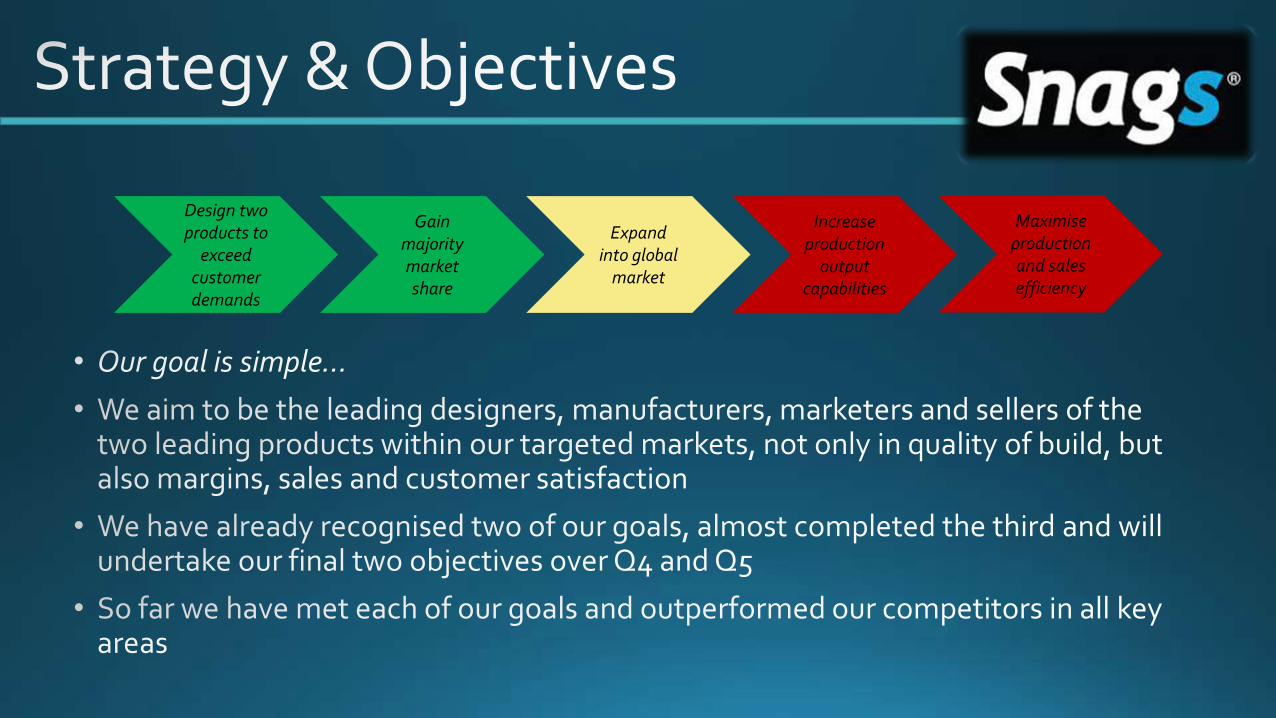
Design two products to
exceed customer demands
Gain majority market share
Expand into global
market
Increase production
output capabilities
Maximise production and sales efficiency
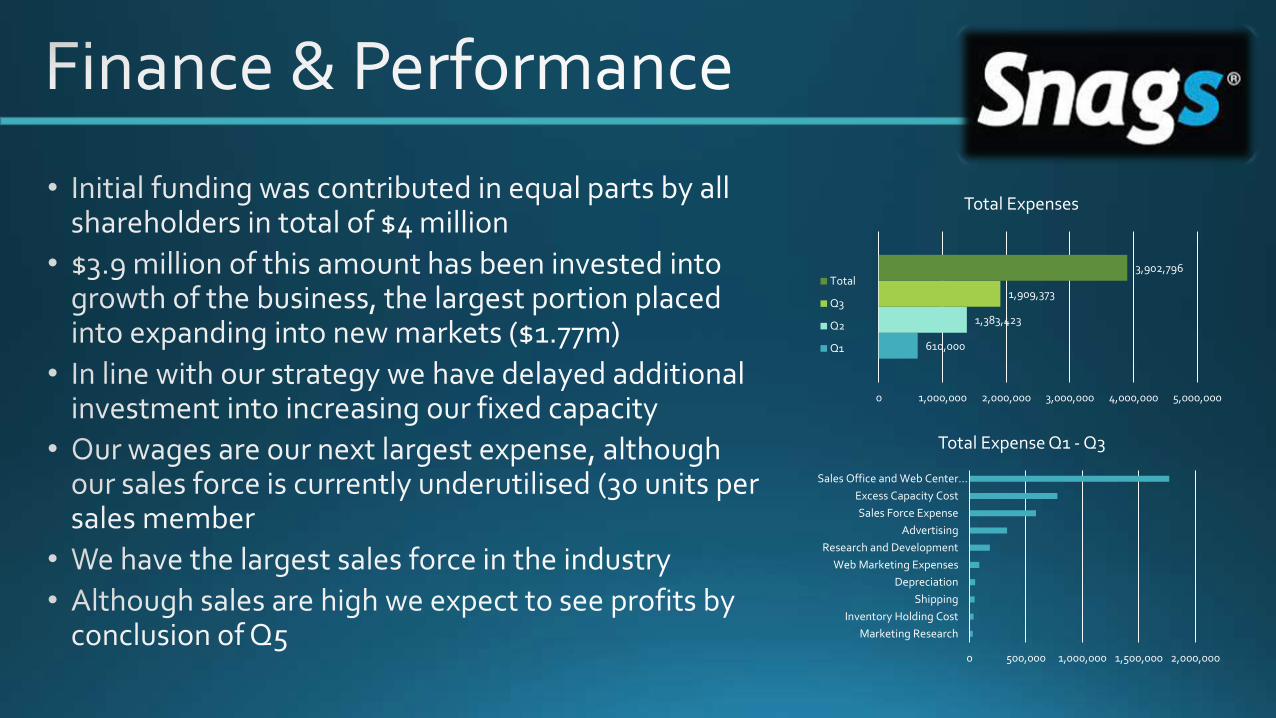
0 500,000 1,000,000 1,500,000 2,000,000
Marketing Research
Inventory Holding Cost
Shipping
Depreciation
Web Marketing Expenses
Research and Development
Advertising
Sales Force Expense
Excess Capacity Cost
Sales Office and Web Center…
Total Expense Q1 - Q3
610,000
1,383,423
1,909,373
3,902,796
0 1,000,000 2,000,000 3,000,000 4,000,000 5,000,000
Total Expenses
Total
Q3
Q2
Q1
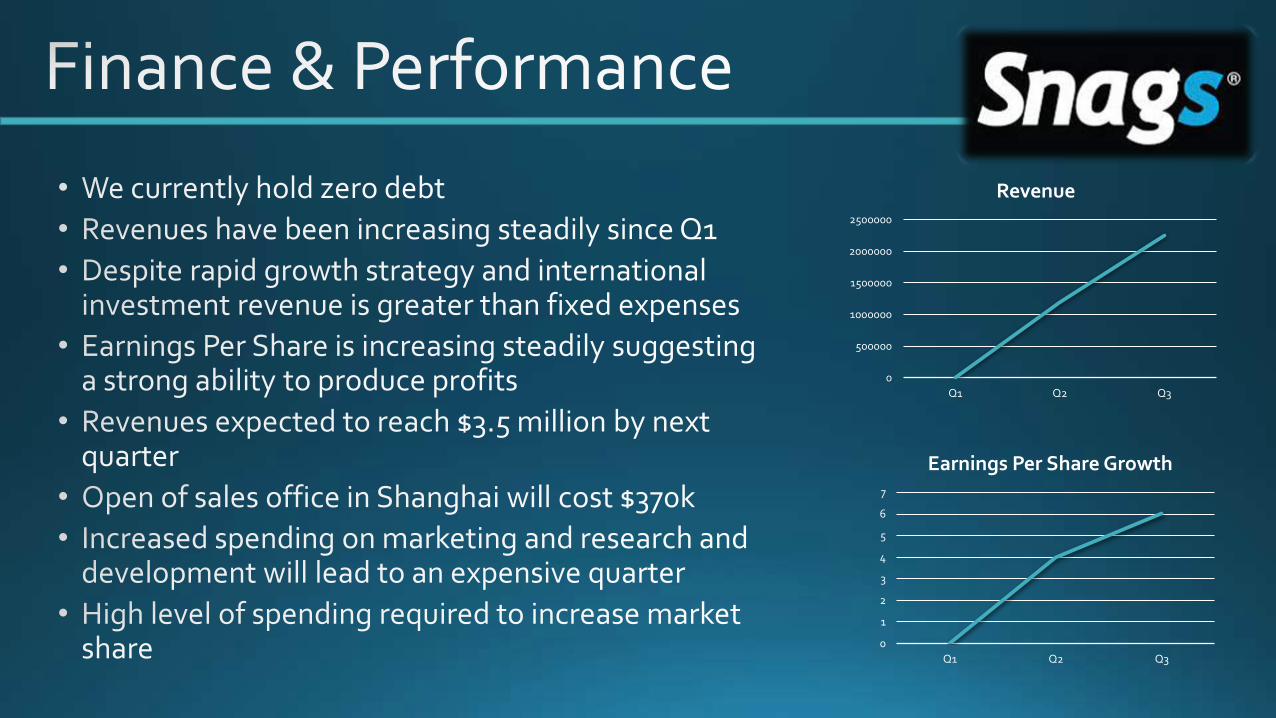
0
500000
1000000
1500000
2000000
2500000
Q1 Q2 Q3
Revenue
0
1
2
3
4
5
6
7
Q1 Q2 Q3
Earnings Per Share Growth
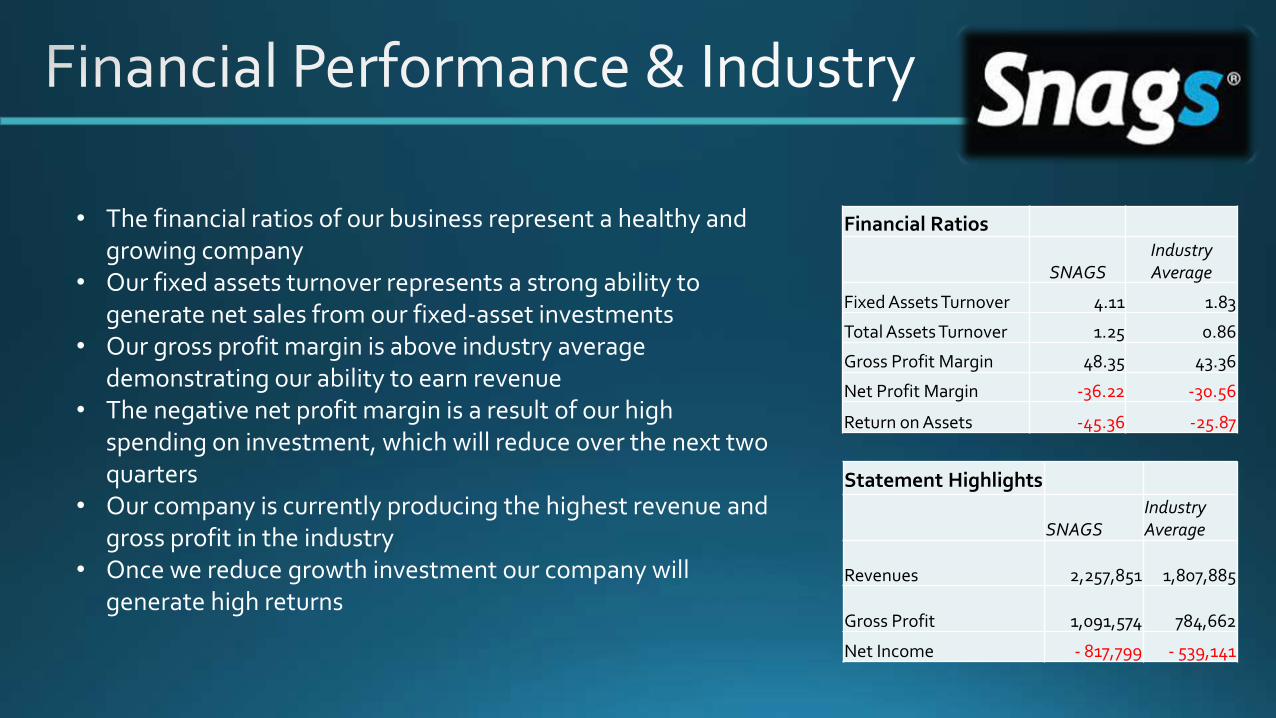
• The financial ratios of our business represent a healthy and growing company
• Our fixed assets turnover represents a strong ability to generate net sales from our fixed-asset investments
• Our gross profit margin is above industry average demonstrating our ability to earn revenue
• The negative net profit margin is a result of our high spending on investment, which will reduce over the next two quarters
• Our company is currently producing the highest revenue and gross profit in the industry
• Once we reduce growth investment our company will generate high returns
Financial Ratios
SNAGSIndustry Average
Fixed Assets Turnover 4.11 1.83
Total Assets Turnover 1.25 0.86
Gross Profit Margin 48.35 43.36
Net Profit Margin -36.22 -30.56
Return on Assets -45.36 -25.87
Statement Highlights
SNAGSIndustry Average
Revenues 2,257,851 1,807,885
Gross Profit 1,091,574 784,662
Net Income - 817,799 - 539,141
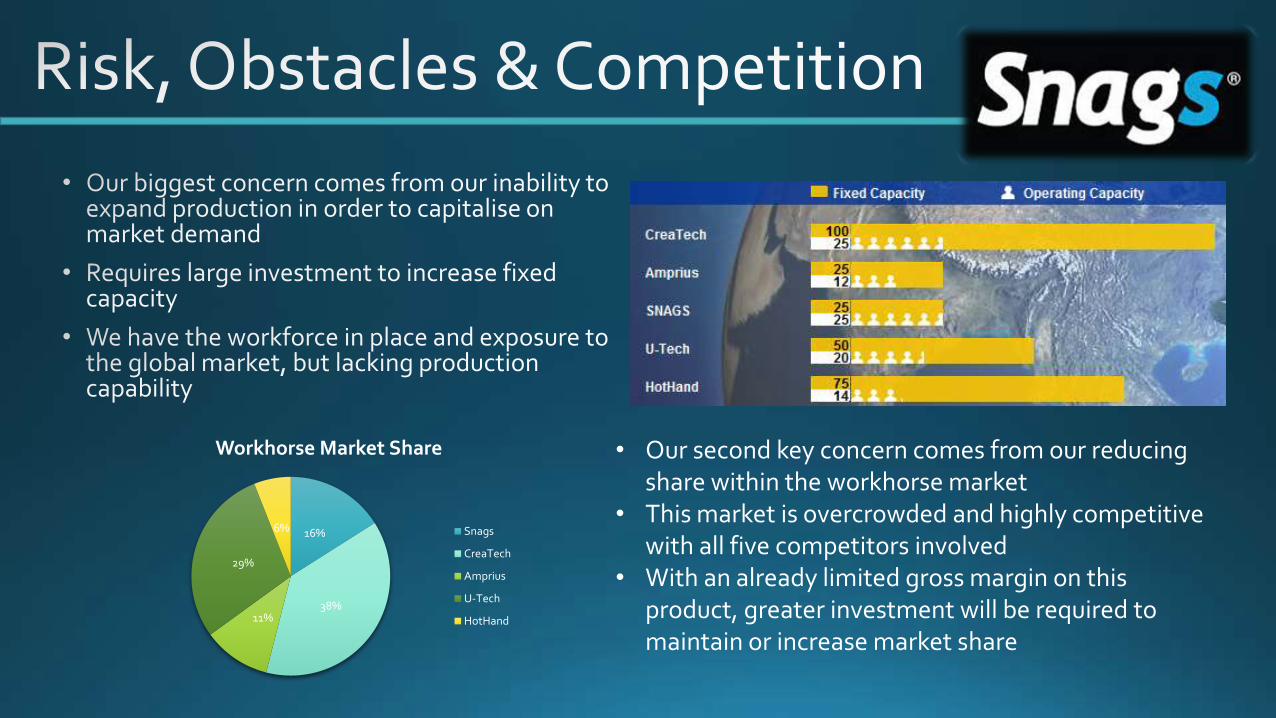
16%
38%11%
29%
6%
Workhorse Market Share
Snags
CreaTech
Amprius
U-Tech
HotHand
• Our second key concern comes from our reducing share within the workhorse market
• This market is overcrowded and highly competitive with all five competitors involved
• With an already limited gross margin on this product, greater investment will be required to maintain or increase market share
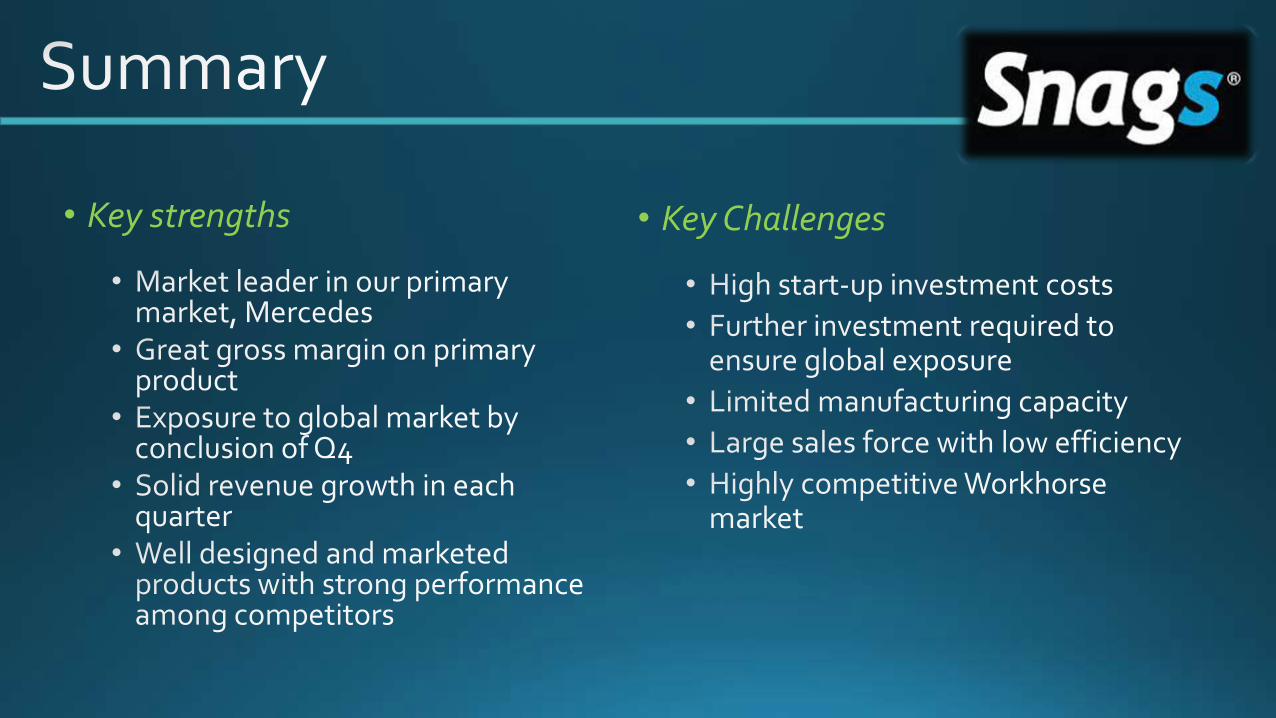
• Key strengths • Key Challenges
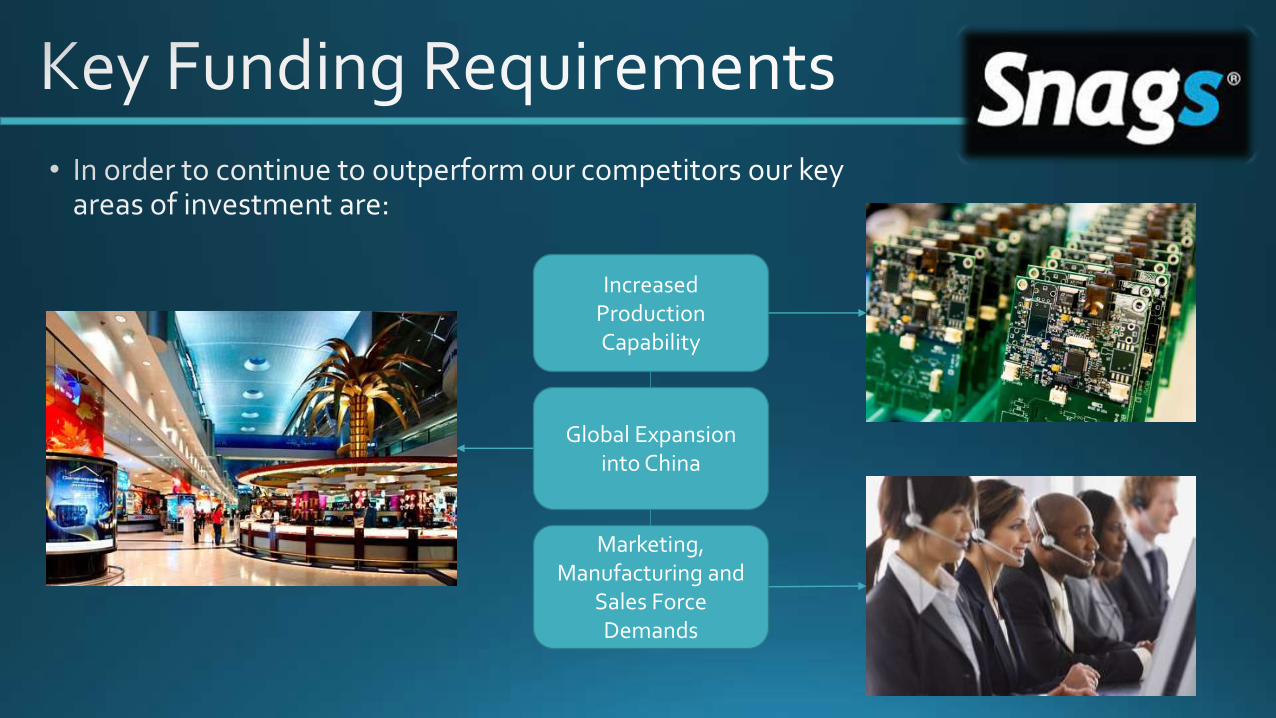
Increased Production Capability
Marketing, Manufacturing and
Sales Force Demands
Global Expansion into China
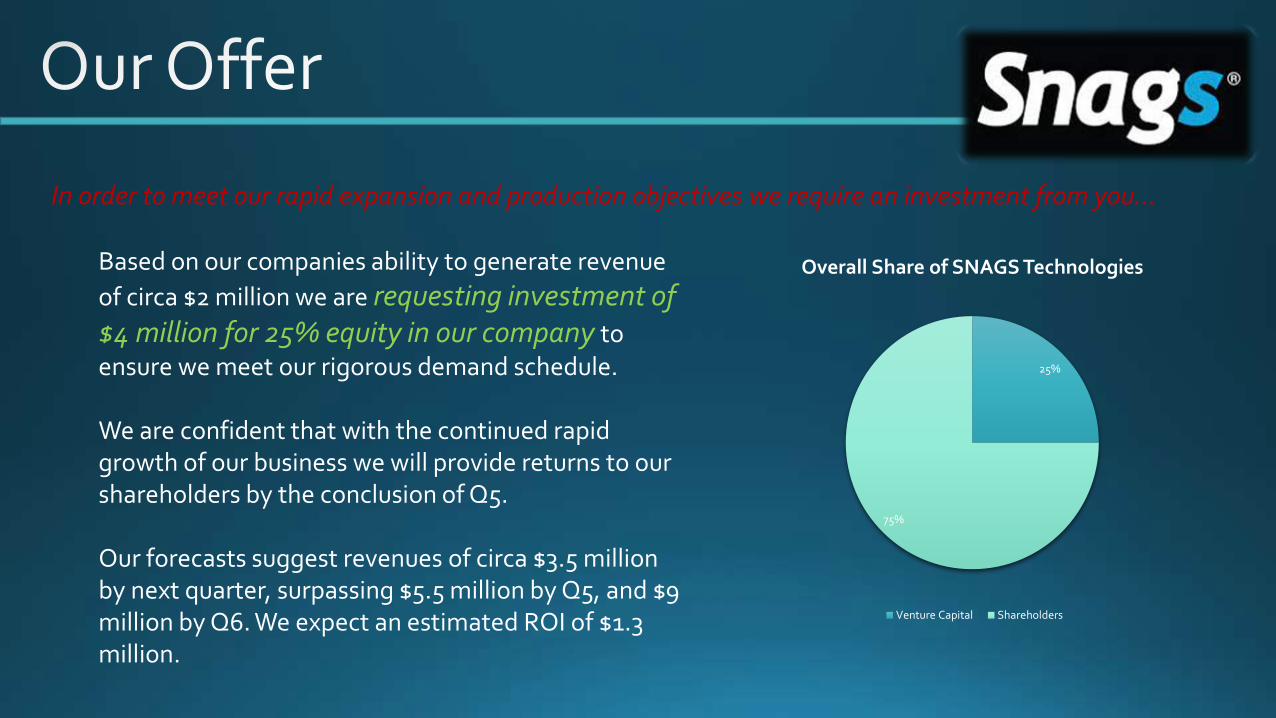
In order to meet our rapid expansion and production objectives we require an investment from you…
Based on our companies ability to generate revenue
of circa $2 million we are requesting investment of $4 million for 25% equity in our company to ensure we meet our rigorous demand schedule.
We are confident that with the continued rapid growth of our business we will provide returns to our shareholders by the conclusion of Q5.
Our forecasts suggest revenues of circa $3.5 million by next quarter, surpassing $5.5 million by Q5, and $9 million by Q6. We expect an estimated ROI of $1.3 million.
25%
75%
Overall Share of SNAGS Technologies
Venture Capital Shareholders