Embed Size (px)
Citation preview
VERTEX® Construction Services, Inc. www.vertexeng.com
2009STATE OF THE
CONSTRUCTION & SURETY INDUSTRY REPORT
prepared by:
William J. McConnell, PE President
Table of Contents
I. Executive Summary……………………………………………………………………….1 II. State of the U.S. Economy…………………………………….…………………………..2
A. Definition of a Recession…………………………………………………….……2
B. Historical Recessionary Cycles……………………………………………...…….2
C. Federal Action to Combat the Current Recession…………………………………4
D. Economic Indicators that Signify the Start of a Recession……………………..…4
E. Economic Indicators that Signify the End of a Recession…………...………..…..6
F. Economic Forecast……………………………………………………….………..7
III. State of the Construction Industry……………………………………………………..….8
A. Contractor Profitability………………………………………………………...….9
B. Materials & Labor Escalation………………………………………………..…..12
C. Construction Failure………………………………………………………....…...15
D. Construction Legislation………………………………………………………….16
E. Market Sector Review…………………………………………………………....17
F. Current Trends in the Construction Industry….................................................…19
IV. State of the Surety Industry………………………………………….…………………...21
A. Surety Growth……………………………………………………………...……21
B. Surety Losses……………………………………………………………….…...21
C. Loss Cycle Review………………………………………………………...…….22
D. Surety Losses by Region…………………………………………………..….…23
E. Surety Consolidation…………………………………………………….….…...24
F. Subcontractor Default Insurance…………………………………………..…….25
Page 1 of 26
February - 2009 I. Executive Summary
The U.S. economy slipped into a recession in December of 2007. This current recession was caused in large part by subprime lending practices that fueled the residential construction boom that took place after the recession of 2001. Since the start of the current recession, the U.S. unemployment rate has nearly doubled and Consumer Price Index growth has slowed significantly. I predict that the current recession will end this summer, making it the longest recessionary cycle since 1933.
The private construction industry experienced one of its greatest booms between 2003 and 2007. During this period, construction materials and wage inflation increased considerably. Since 2007, private construction revenue has rapidly declined due to the limited availability of financing. Until banks loosen up lending practices, private construction will continue to languish.
In 2008, contractor profitability also started to decline. Publicly traded residential
contractors mounted record losses in 2008; while public general contractors, public heavy contractors, and large subcontractors recorded thin profit margins. I anticipate that contractor profit margins will continue to shrink in 2009 and 2010 due to increased competition for the limited work available. The markets most affected by the recession include residential, commercial, office, and lodging sectors.
In contrast, the public construction industry grew at a robust pace in 2007 and 2008.
Although the public construction industry is forecasted to drag in 2009, the $787 billion stimulus package recently passed by Congress should inject approximately $131 billion of funding for a broad range of public construction projects for the next several years.
The surety industry recorded record profits in 2006 and 2007. 2008 bodes to be extremely profitable as well, albeit less so than 2006 and 2007. The continued reductions in contractor profit margin will lead to increasing surety losses in 2009 through 2011.
The surety industry loss ratio will likely trend up to approximately 50% by 2011, which
is considerably less than the 73% loss ratio recorded during the peak of the last loss cycle. This reduction in severity can be attributed to the tightening of underwriting standards since 2004. Surety losses historically peak several years after a recession because contractors take on additional risk through economic downturns in order generate revenue, rather than downsize to accommodate market conditions. Over the last several years, surety losses were concentrated in the South and to a lesser extent, the North. The Midwest, Mountain, and Pacific regions experienced minimal losses in 2006 and 2007.
Surety consolidation picked up in 2008 with Liberty Mutual Group’s acquisition of
Safeco Corporation. The top ten providers of surety products currently have a 67% market share of written premium – this is up from a 42% market share in 1990.
Page 2 of 26
II. State of the U.S. Economy A. Definition of a Recession The technical definition of a recession varies from economist to economist. One accepted definition is the reduction of a country’s gross domestic product (“GDP”) for at least two consecutive quarters, otherwise known as the “two quarter rule.”1 Under the two quarter rule, the U.S. entered into a recession in July-2008, as the GDP was down 0.5% in the third quarter of 2008 and down another 3.8% in the forth quarter of 2008.
A second definition of recession, which is now more widely accepted than the two quarter rule, is from The National Bureau of Economic Research (“NBER”), which defines a recession as "a significant decline in [the] economic activity spread across the economy, lasting more than a few months, normally visible in real GDP growth, real personal income, employment (non-farm payrolls), industrial production, and wholesale-retail sales."2 The federal government accepts NBER’s definition of a recession.
According to NBER, the U.S. economy fell into a recession in December of 2007, which
represents the 23rd recession since 1900.3 For the purpose of this report, I use NBER’s definition of a recession. B. Historical Recessionary Cycles Subsequent to the Great Depression, the average recession lasts 10.4 months. The shortest recession lasted 6 months and the longest lasted 16 months. As of January-2009, the current recession is in its 14th month. Based on NBER’s empirical data, the economy should start expanding no later than the summer of 2009.
I would be remiss; however, if I failed to note that the Great Depression caused a contraction that lasted 43 months, or 3.5 years. The following is a list of recessionary cycles since the Great Depression:
Aug-29 to Mar-33: 43 months Dec-69 to Nov-70: 11 months May-37 to Jun-38: 13 months Nov-73 to Mar-75: 16 months Feb-45 to Oct-45: 8 months Jan-80 to Jul-80: 6 months Nov-48 to Oct-49: 11 months Jul-81 to Nov-82: 16 months Jul-53 to May-54: 10 months Jul-90 to Mar-91: 8 months Aug-57 to Apr-58: 8 months Mar-2001 to Nov-2001: 8 months Apr-60 to Feb-61: 10 months Dec-2007 to ?: 14 months as of Jan-2009
1 BusinessDictionary.com 2 http://www.nber.org/cycles/dec2008.html 3 http://wwwdev.nber.org/cycles/cyclesmain.html
Page 3 of 26
1964
1965
1966
1967
1968
1969
1970
1971
1972
1973
1974
1975
1976
1977
1978
1979
1980
1981
1982
1983
1984
1985
1986
1987
1988
1989
1990
1991
1992
1993
1994
1995
1996
1997
1998
1999
2000
2001
2002
2003
2004
2005
2006
2007
2008
2009
2010
2011
1964
1965
1966
1967
1968
1969
1970
1971
1972
1973
1974
1975
1976
1977
1978
1979
1980
1981
1982
1983
1984
1985
1986
1987
1988
1989
1990
1991
1992
1993
1994
1995
1996
1997
1998
1999
2000
2001
2002
2003
2004
2005
2006
2007
2008
2009
2010
2011
Year
$1.0 $1.0
$2.0 $2.0
$3.0 $3.0
$4.0 $4.0
$5.0 $5.0
$6.0 $6.0
$7.0 $7.0
$8.0 $8.0
$9.0 $9.0
$10.0 $10.0
Real
Gros
s Dom
estic
Pro
duct
in T
rillio
ns
Put I
n Pl
ace C
onst
ruct
ion
in B
illion
s
$12.0 $12.0
$11.0 $11.0
U.S. Gross Domestic Product v. Dow Jones Industrial Average
$13.0 $13.0
$1.0
$6.0
$5.0
$4.0
$3.0
$2.0
$12.0
$11.0
$10.0
$9.0
$8.0
$7.0
$100
$600
$500
$400
$1,200
$1,100
$1,000
$900
$200
$800
$700
Year
$13.0
U.S. Gross Domestic Product v. Put In Place Construction Growth
$1,300
Real
Gros
s Dom
estic
Pro
duct
in T
rillio
ns
Put I
n Pl
ace C
onst
ruct
ion
in B
illion
s
$300
Real Gross Domestic Product
Put In Place Construction
Takeaways:
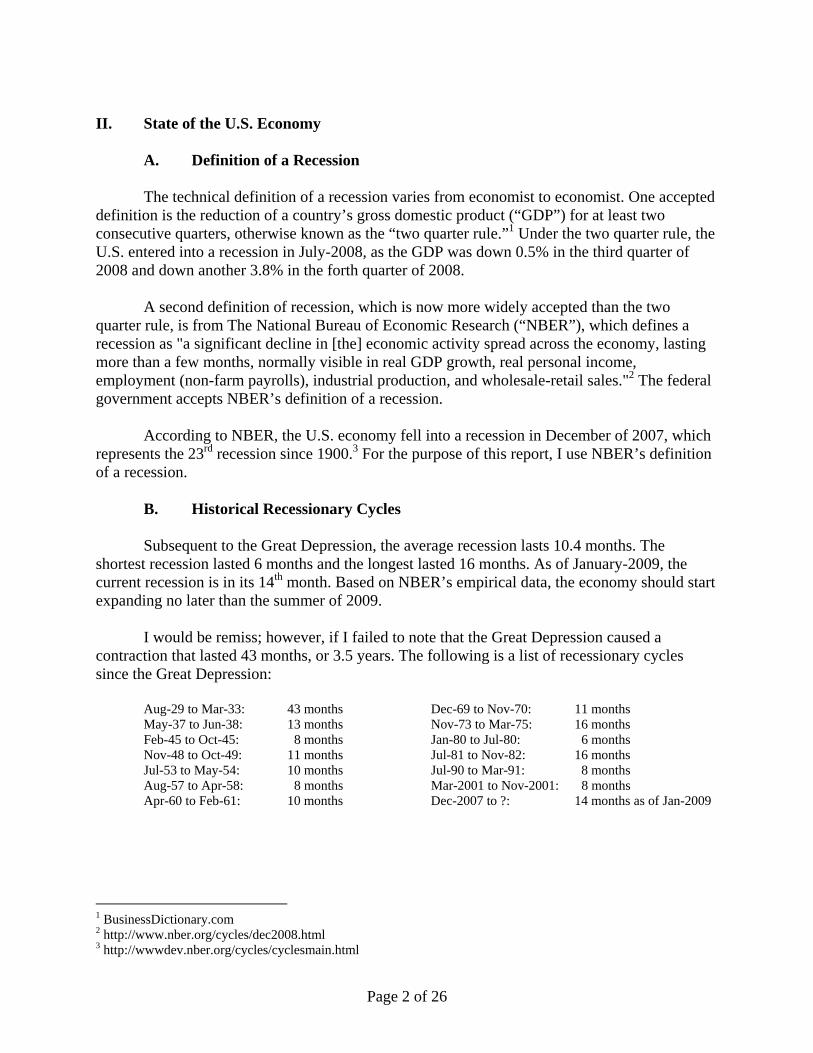
*The US Economy and the Construction Industry trend proportionally. Since 1964: the GDP increased from ~$3T to ~$12T (~$9T increase); and the Construction Industry increased from ~$100B to ~$1T (~$.9T increase).
*When the Construction Industry substantially outperforms the GDP, the Construction Industry subsequently corrects.
Real GDP
DJIA
Takeaways:
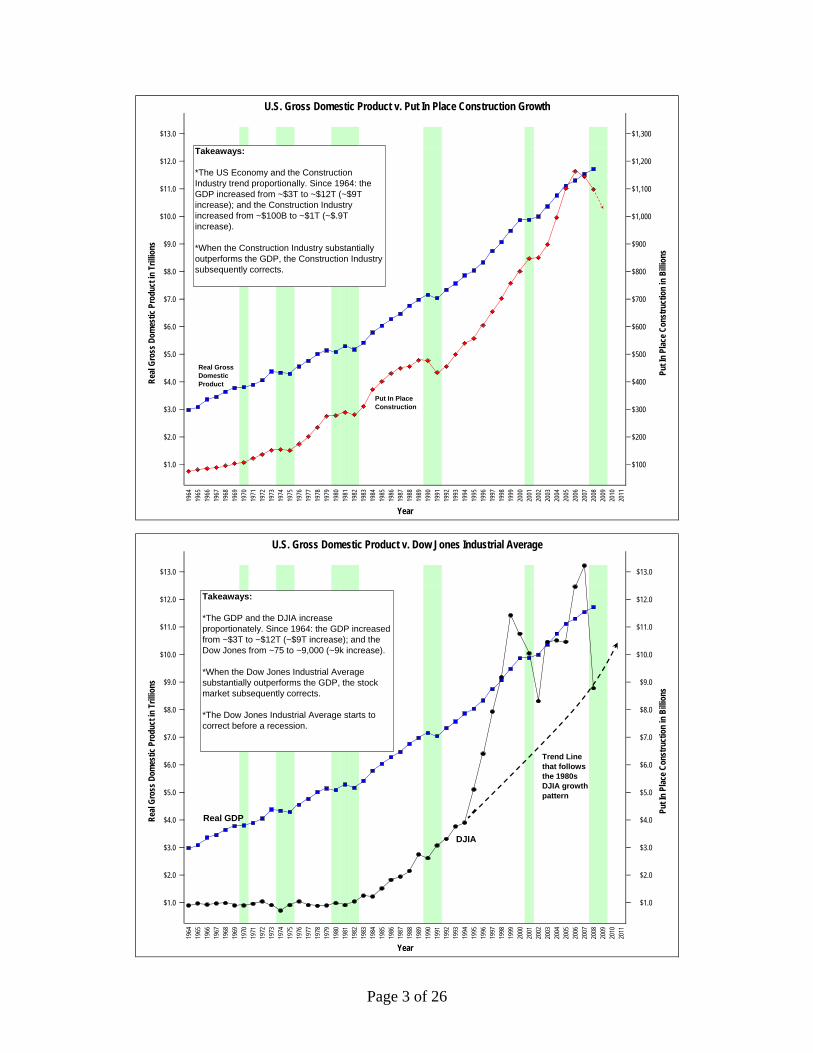
*The GDP and the DJIA increase proportionately. Since 1964: the GDP increased from ~$3T to ~$12T (~$9T increase); and the Dow Jones from ~75 to ~9,000 (~9k increase).
*When the Dow Jones Industrial Average substantially outperforms the GDP, the stock market subsequently corrects.
*The Dow Jones Industrial Average starts to correct before a recession.
Trend Line that follows the 1980s DJIA growth pattern
Page 4 of 26
C. Federal Action to Combat the Current Recession
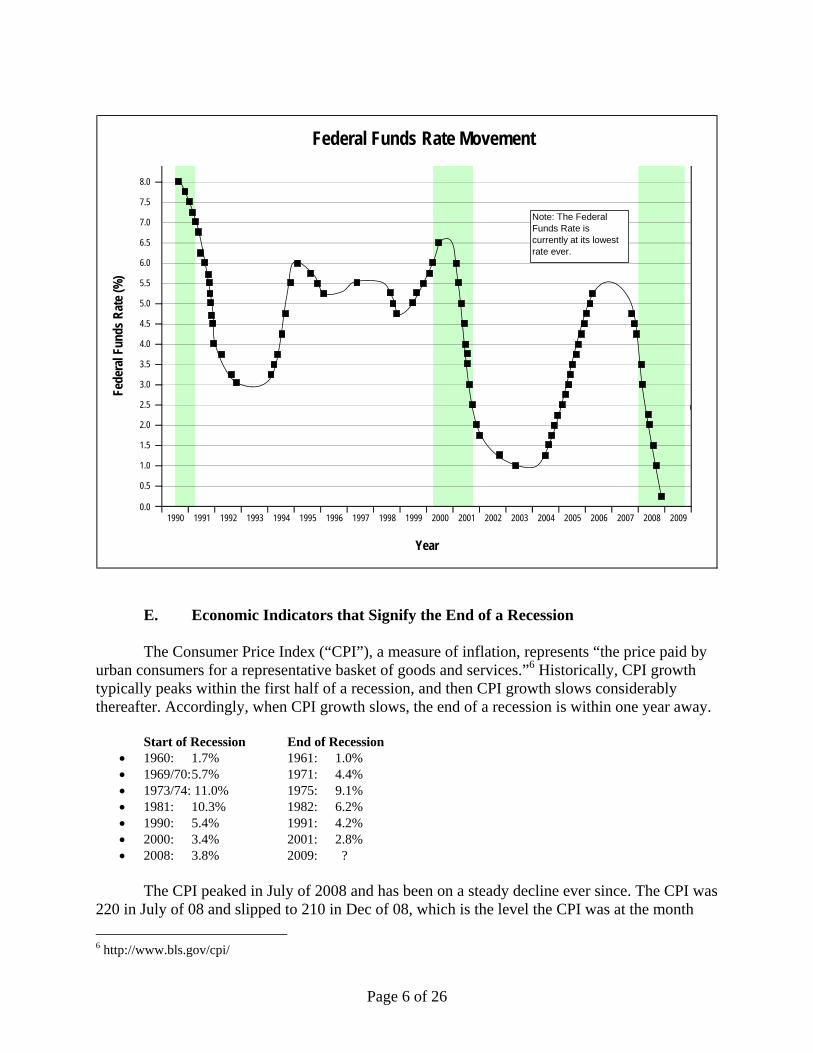
The modern reaction from the federal government to a recessionary cycle is swift when compared to its reaction time in the first half of the 20th century. At the first sign of recessionary pressures, the Federal Open Market Committee slashes the Federal Funds Rate (the rate at which the Federal Reserve lends money to banks) to increase lending in the private sector. In addition, Congress swiftly passes spending legislation to stimulate the economy.
The Federal Funds Rate currently stands at 0.25% - the lowest level it has ever been. This all time low rate should allow many homeowners to refinance their homes to reduce monthly mortgage payments and provide citizens with disposable income to bolster the economy. On the legislative front, the $787 billion stimulus package passed House and Senate vote. Approximately $131 billion of the proposed bill relates to construction spending. Construction is the largest services category of the GDP. Economists believe the stimulus package will prevent the unemployment rate from hitting double digits, and may even cause a reduction of 1.7%.4
D. Economic Indicators that Signify the Start of a Recession
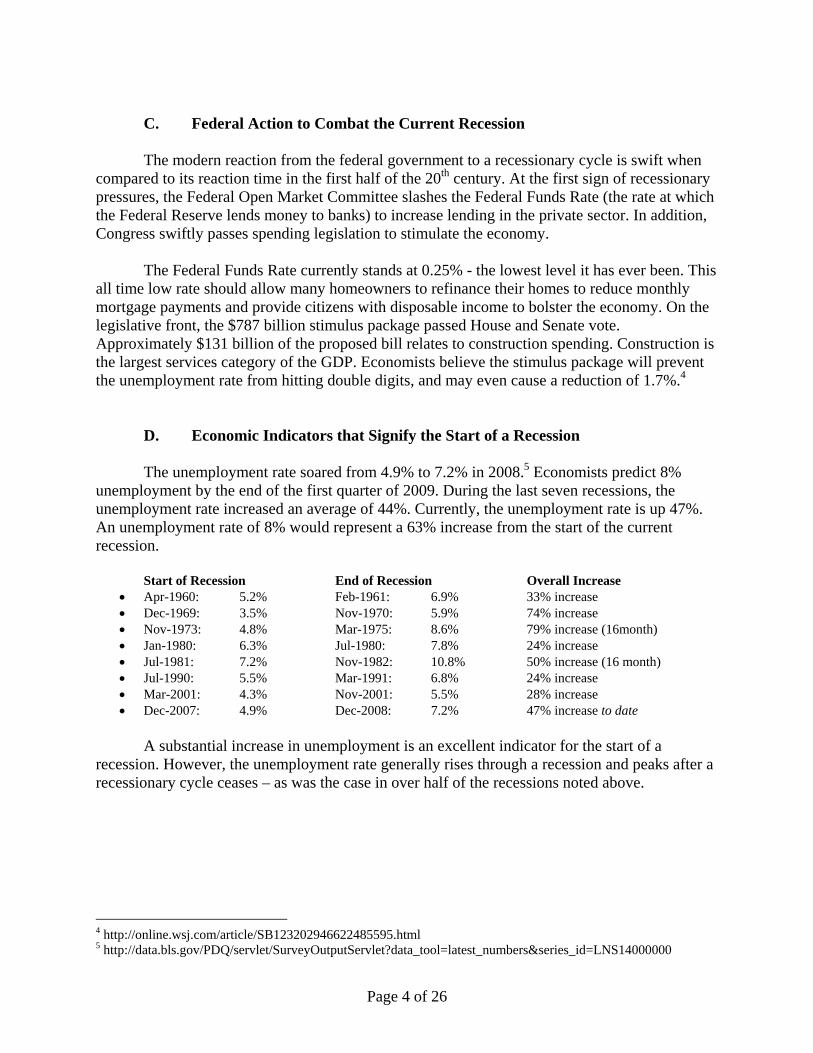
The unemployment rate soared from 4.9% to 7.2% in 2008.5 Economists predict 8% unemployment by the end of the first quarter of 2009. During the last seven recessions, the unemployment rate increased an average of 44%. Currently, the unemployment rate is up 47%. An unemployment rate of 8% would represent a 63% increase from the start of the current recession. Start of Recession End of Recession Overall Increase
• Apr-1960: 5.2% Feb-1961: 6.9% 33% increase • Dec-1969: 3.5% Nov-1970: 5.9% 74% increase • Nov-1973: 4.8% Mar-1975: 8.6% 79% increase (16month) • Jan-1980: 6.3% Jul-1980: 7.8% 24% increase • Jul-1981: 7.2% Nov-1982: 10.8% 50% increase (16 month) • Jul-1990: 5.5% Mar-1991: 6.8% 24% increase • Mar-2001: 4.3% Nov-2001: 5.5% 28% increase • Dec-2007: 4.9% Dec-2008: 7.2% 47% increase to date
A substantial increase in unemployment is an excellent indicator for the start of a
recession. However, the unemployment rate generally rises through a recession and peaks after a recessionary cycle ceases – as was the case in over half of the recessions noted above. 4 http://online.wsj.com/article/SB123202946622485595.html 5 http://data.bls.gov/PDQ/servlet/SurveyOutputServlet?data_tool=latest_numbers&series_id=LNS14000000
Page 5 of 26
1964
1965
1966
1967
1968
1969
1970
1971
1972
1973
1974
1975
1976
1977
1978
1979
1980
1981
1982
1983
1984
1985
1986
1987
1988
1989
1990
1991
1992
1993
1994
1995
1996
1997
1998
1999
2000
2001
2002
2003
2004
2005
2006
2007
2008
2009
2010
2011
1964
1965
1966
1967
1968
1969
1970
1971
1972
1973
1974
1975
1976
1977
1978
1979
1980
1981
1982
1983
1984
1985
1986
1987
1988
1989
1990
1991
1992
1993
1994
1995
1996
1997
1998
1999
2000
2001
2002
2003
2004
2005
2006
2007
2008
2009
2010
2011
U.S. Unemployment Rate
9.2%
10.0%
10.4%
10.8%
8.0%
8.8%
8.4%
7.2%
7.6%
6.4%
6.8%
Year
9.6%
4.8%
5.2%
6.0%
Consumer Price Index Movement
Unem
ploy
men
t Rat
e (%
)
3.6%
4.4%
4.0%
5.6%
10.50%
7.00%
10.00%
9.50%
8.00%
7.50%
6.00%
9.00%
8.50%
2.50%
2.00%
Year
Cons
umer
Pric
e Ind
ex M
ovem
ent (
Year
to Y
ear a
s a %
)
3.00%
4.50%
1.50%
3.50%
11.00%
4.00%
5.50%
5.00%
6.50%
Takeaways:
*Unemployment peaks at the end, or after, a recessionary cycle.
*Unemployment increases drastically during a recessionary cycle.
*Based on past recessions, unemployment should increase in 2009 - and possibly peak in 2010
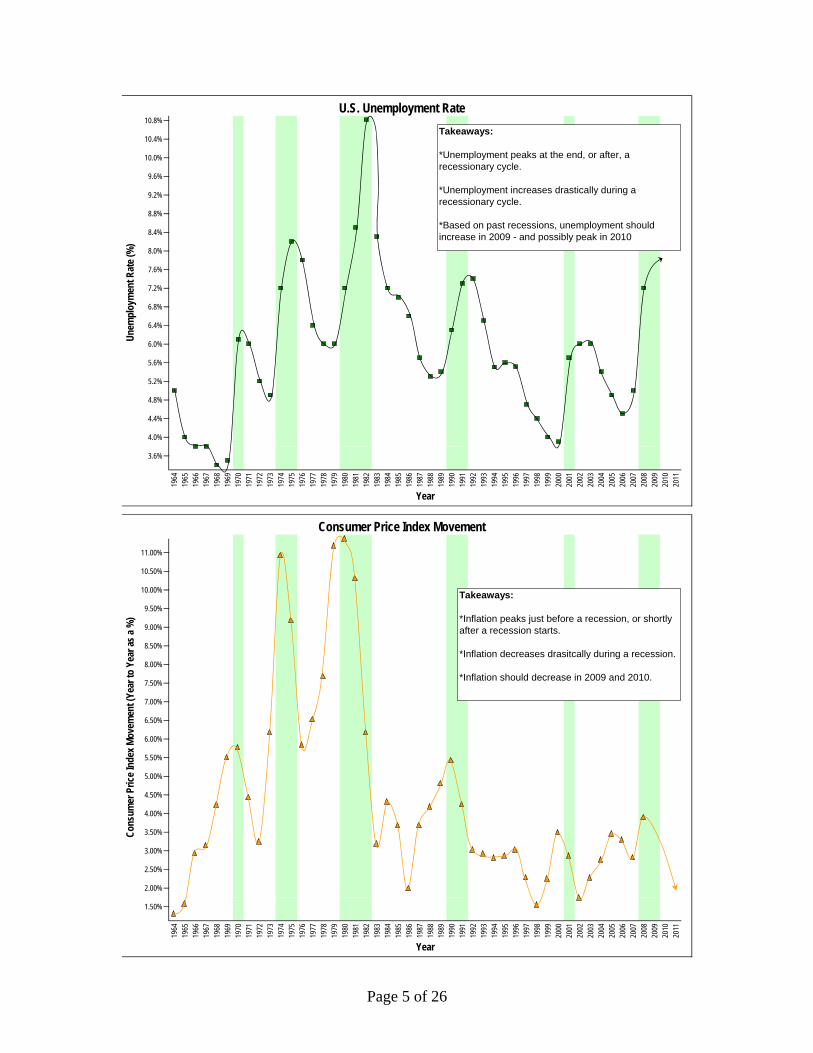
Takeaways:
*Inflation peaks just before a recession, or shortly after a recession starts.
*Inflation decreases drasitcally during a recession.
*Inflation should decrease in 2009 and 2010.
Page 6 of 26
E. Economic Indicators that Signify the End of a Recession
The Consumer Price Index (“CPI”), a measure of inflation, represents “the price paid by urban consumers for a representative basket of goods and services.”6 Historically, CPI growth typically peaks within the first half of a recession, and then CPI growth slows considerably thereafter. Accordingly, when CPI growth slows, the end of a recession is within one year away.
Start of Recession End of Recession
• 1960: 1.7% 1961: 1.0% • 1969/70: 5.7% 1971: 4.4% • 1973/74: 11.0% 1975: 9.1% • 1981: 10.3% 1982: 6.2% • 1990: 5.4% 1991: 4.2% • 2000: 3.4% 2001: 2.8% • 2008: 3.8% 2009: ?
The CPI peaked in July of 2008 and has been on a steady decline ever since. The CPI was
220 in July of 08 and slipped to 210 in Dec of 08, which is the level the CPI was at the month 6 http://www.bls.gov/cpi/
6.0
8.0
6.5
7.0
7.5
Year
2005 2006 2007 20082001 2002 2003 20041998 1999 2000 20091994 1995 1996 19971991 19920.0
1993
0.5
2.0
1.5
1990
Federal Funds Rate MovementFe
dera
l Fun
ds R
ate (
%)
5.0
4.5
4.0
3.0
2.5
3.5
5.5
1.0
Note: The Federal Funds Rate is currently at its lowest rate ever.

Page 7 of 26
before the recession started in Nov of 07. Based on historical data, the current recession should cease by July of 2009. The CPI index does not account for food and energy due to the price volatility of these sectors.
The construction industry is heavily affected by the price of oil. Similar to the CPI, the
average price of crude oil typically peaks in the first half of a recession and drops in the second half of the recession. One exception to this rule was the 1973 – 1975 recession. The Yom Kippur War started with an attack on Israel by Syria and Egypt on October 5, 1973. The U.S. and many countries in the western world showed support for Israel. As a result of this support several Arab exporting nations imposed an embargo on the countries supporting Israel, thus increasing the average price of oil.7
Start of Recession End of Recession
• 1960: $20.88/barrel 1961: $20.25/barrel • 1969/70: $19.22/barrel 1971: $18.88/barrel • 1973/74: $40.29/barrel 1975: $48.21/barrel (does not follow trend due to Yom Kippur War) • 1981: $83.54/barrel 1982: $70.07/barrel • 1990: $37.69/barrel 1991: $31.51/barrel • 2000: $33.79/barrel 2001: $27.59/barrel • 2008: $99.65/barrel 2009: $32.94/barrel (as of Jan-2009)
F. Economic Forecast
Empirical data suggests that 2009 is a classic second half recessionary year and that the
U.S. economy should work itself out of the current recession by the summer of 2009. This projection is based on the fact that: CPI growth peaked in 2008; oil prices peaked in 2008; and a drastic swing in unemployment took place in 2008. In addition, Congress recently passed a stimulus package to increase federal spending for domestic programs.
Moreover, the equity markets should be less volatile in the latter part of 2009 as the
general public is now accustomed to bad news, which should remove emotion from stock valuation. The P/E ratio of the S&P 500 was at 15.39 as of December of 2008 – its lowest level since 1988. This recession certainly has unique elements when compared to past recessions, but that could be argued for every recession. The U.S. economy is remarkably resilient and economic growth should trend upwards in the second half of 2009. 7 http://www.wtrg.com/prices.htm
Page 8 of 26
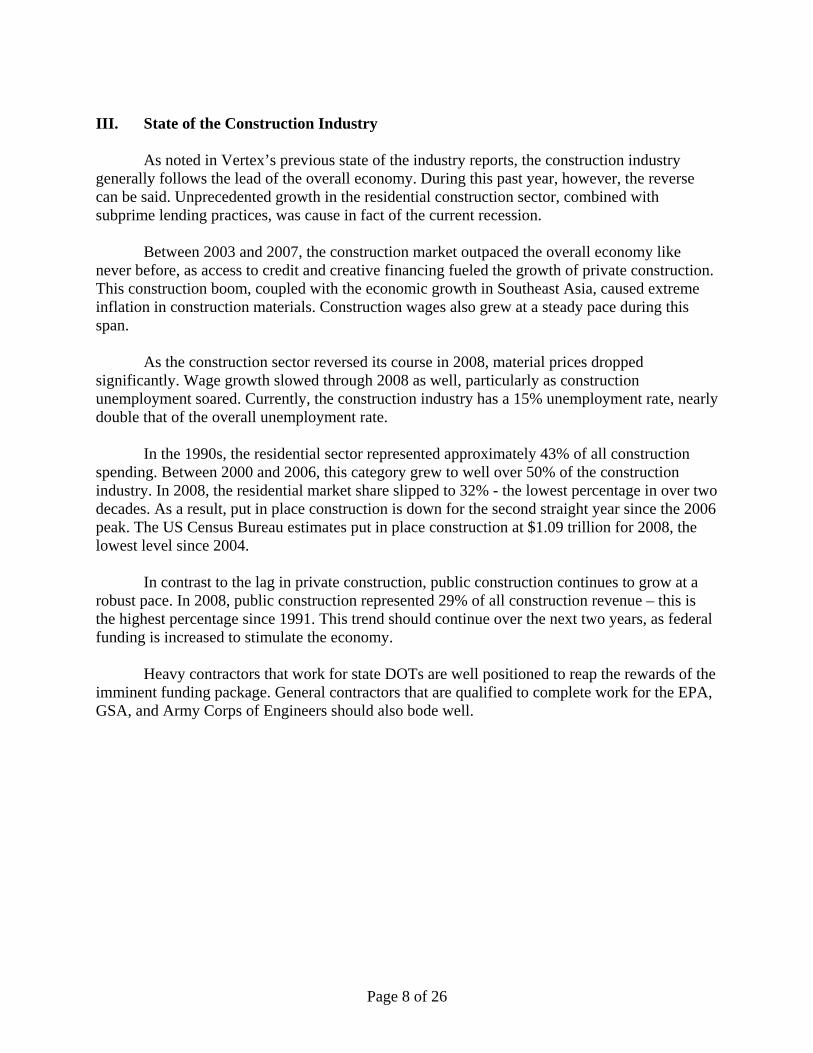
III. State of the Construction Industry As noted in Vertex’s previous state of the industry reports, the construction industry generally follows the lead of the overall economy. During this past year, however, the reverse can be said. Unprecedented growth in the residential construction sector, combined with subprime lending practices, was cause in fact of the current recession.
Between 2003 and 2007, the construction market outpaced the overall economy like never before, as access to credit and creative financing fueled the growth of private construction. This construction boom, coupled with the economic growth in Southeast Asia, caused extreme inflation in construction materials. Construction wages also grew at a steady pace during this span.
As the construction sector reversed its course in 2008, material prices dropped significantly. Wage growth slowed through 2008 as well, particularly as construction unemployment soared. Currently, the construction industry has a 15% unemployment rate, nearly double that of the overall unemployment rate.
In the 1990s, the residential sector represented approximately 43% of all construction spending. Between 2000 and 2006, this category grew to well over 50% of the construction industry. In 2008, the residential market share slipped to 32% - the lowest percentage in over two decades. As a result, put in place construction is down for the second straight year since the 2006 peak. The US Census Bureau estimates put in place construction at $1.09 trillion for 2008, the lowest level since 2004. In contrast to the lag in private construction, public construction continues to grow at a robust pace. In 2008, public construction represented 29% of all construction revenue – this is the highest percentage since 1991. This trend should continue over the next two years, as federal funding is increased to stimulate the economy.
Heavy contractors that work for state DOTs are well positioned to reap the rewards of the imminent funding package. General contractors that are qualified to complete work for the EPA, GSA, and Army Corps of Engineers should also bode well.

Page 9 of 26
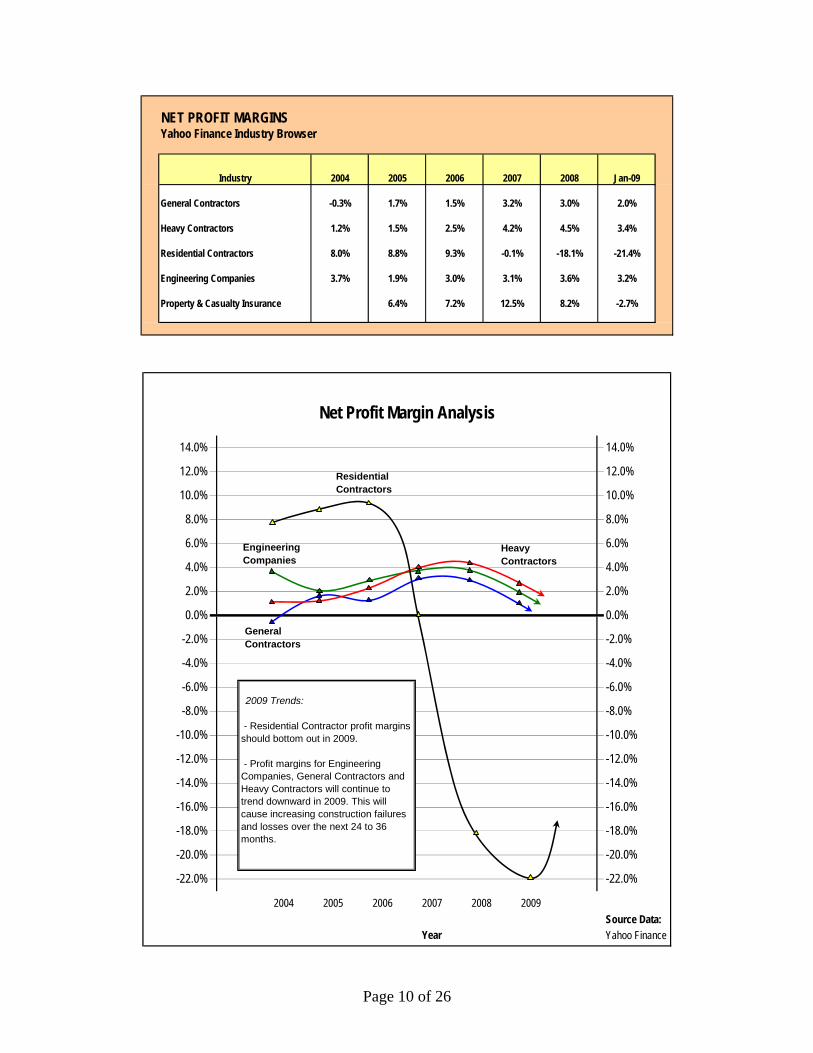
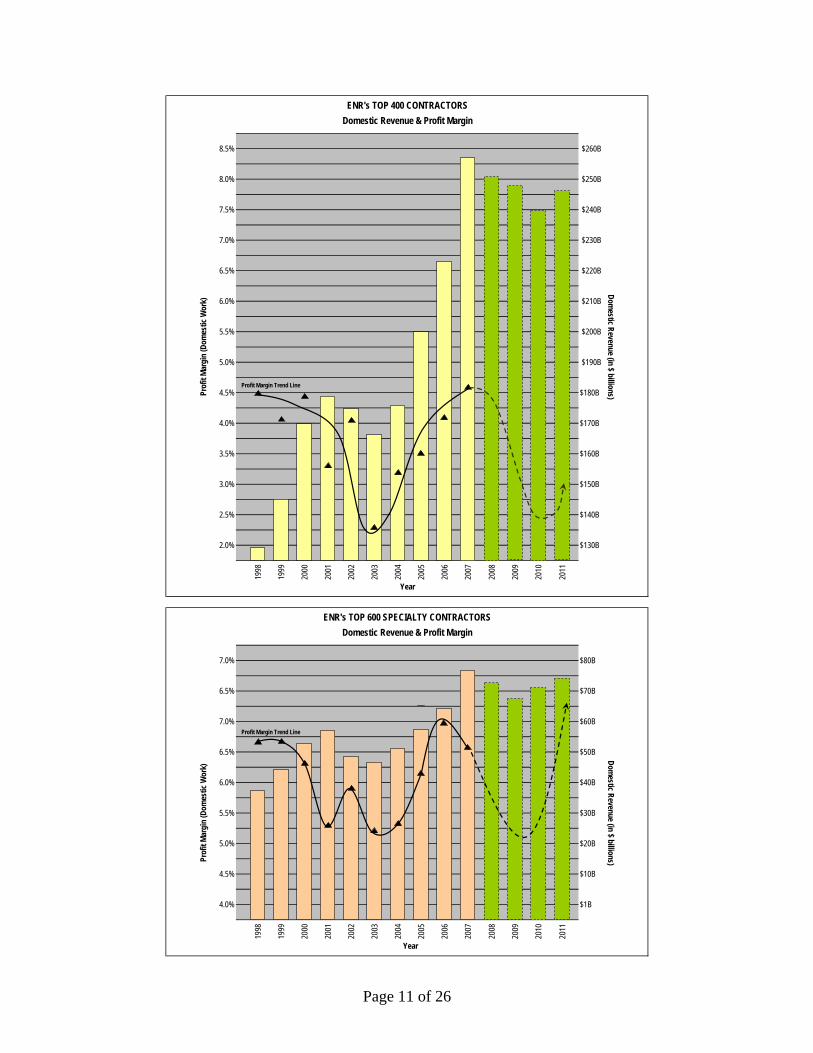
A. Contractor Profitability Contractor profitability started to trend upward in 2003 and peaked in 2007. A downward trend in profitability started in 2008, which will likely continue through 2010. 1. General Contractors Net profit margins for publicly traded general contractors trended upward from 2004 through 2007, peaking at 3.2%. Net profit margins slipped slightly in 2008 to 3.0%. Through the first month of 2009, net profit margins are down to 2.0%. Continued reduction is forecasted through 2010 as backlogs shrink and competition increases for the limited work that is available. 2. Heavy Contractors Net profit margins for publicly traded Heavy Contractor peaked in mid 2008 at 4.5%; through January of 2009, profit margins pulled back to 3.44% - margins were forecasted to slip further in 2008 but the reduction in oil prices over the past six months has had a positive effect on profitability. Heavy Contractor margins will continue to trend downward in 2009 as backlog shrinks and competition increases. With the increase in public works funding scheduled over the next several years, heavy contractors should fair better than residential contractors and general contractors in 2010. 3. Engineering Companies Net profit margins for publicly traded engineering companies peaked in mid 2008 at 3.60% - this concluded a four-year run of increasing profitability. The third quarter of 2008 started a downward trend as profits declined to 3.2%. Profit margins should bottom out in 2009. 4. Specialty Contractors ENR publishes its Top 600 Specialty Contractor list in October of each year, which lists the average profit margin for the prior year. Profit margin was slightly off in 2007 - from 6.9% in 2006 to 6.3% in 2007. Profit margins for specialty contractors will likely fall below 5.5% percent in 2008 and 2009. Specialty contractors continue to shed workers in order to downsize due to current market conditions. Profit margins will likely bottom out in 2009.
5. Residential Contractors 2008 was a horrific year for residential contractors - net profit margins for public residential contractors averaged –18.1%. In 2006, the average profit margin for a public residential contractor was 9.3% - this is a remarkably high figure for construction standards. In 2007, residential contractors broke even. Through the first month of 2009, net profit margins slipped further to –21.40%. Profit margins in this sector should trend upwards starting in 2010.
Page 10 of 26
NET PROFIT MARGINSYahoo Finance Industry Browser
Industry 2004 2005 2006 2007 2008 Jan-09
General Contractors -0.3% 1.7% 1.5% 3.2% 3.0% 2.0%
Heavy Contractors 1.2% 1.5% 2.5% 4.2% 4.5% 3.4%
Residential Contractors 8.0% 8.8% 9.3% -0.1% -18.1% -21.4%
Engineering Companies 3.7% 1.9% 3.0% 3.1% 3.6% 3.2%
Property & Casualty Insurance 6.4% 7.2% 12.5% 8.2% -2.7%
2004 2005 2006 2007 2008 2009Source Data:Yahoo Finance
-18.0%
-20.0%
-22.0%
-10.0%
-12.0%
-14.0%
-16.0%
-2.0%
-4.0%
-6.0%
-8.0%
6.0%
4.0%
2.0%
0.0%
14.0%
12.0%
10.0%
8.0%
-18.0%
Year
-10.0%
-12.0%
-14.0%
-16.0%
-20.0%
-22.0%
-2.0%
-4.0%
-6.0%
-8.0%
Net Profit Margin Analysis
14.0%
12.0%
10.0%
0.0%
8.0%
6.0%
4.0%
2.0%
Residential Contractors
GeneralContractors
Engineering Companies
HeavyContractors
2009 Trends:
- Residential Contractor profit margins should bottom out in 2009.
- Profit margins for Engineering Companies, General Contractors and Heavy Contractors will continue to trend downward in 2009. This will cause increasing construction failures and losses over the next 24 to 36 months.
Page 11 of 26
Profit Margin Trend Line
1998
1999
2000
2001
2002
2003
2004
2005
2006
2007
2008
2009
2010
2011
Profit Margin Trend Line
1998
1999
2000
2001
2002
2003
2004
2005
2006
2007
2008
2009
2010
2011
$150B
2.5% $140B
2.0%
$180B
4.0% $170B
3.5% $160B
$260B
Domestic Revenue (in $ billions)
8.0% $250B
7.5% $240B
7.0% $230B
6.5%
$210B
$220B
$50B
6.0%
ENR's TOP 600 SPECIALTY CONTRACTORS
$130B
5.5% $200B
5.0% $190B
Year
ENR's TOP 400 CONTRACTORSDomestic Revenue & Profit Margin
Prof
it Ma
rgin
(Dom
estic
Wor
k)
8.5%
6.0%
4.5%
3.0%
4.5%
Prof
it Ma
rgin
(Dom
estic
Wor
k)
7.0% $60B
$10B
4.0% $1B
$40B
5.5% $30B
5.0% $20B
Domestic Revenue & Profit Margin
Year
7.0% $80B
6.5% $70B
Domestic Revenue (in $ billions)
6.5%
Page 12 of 26
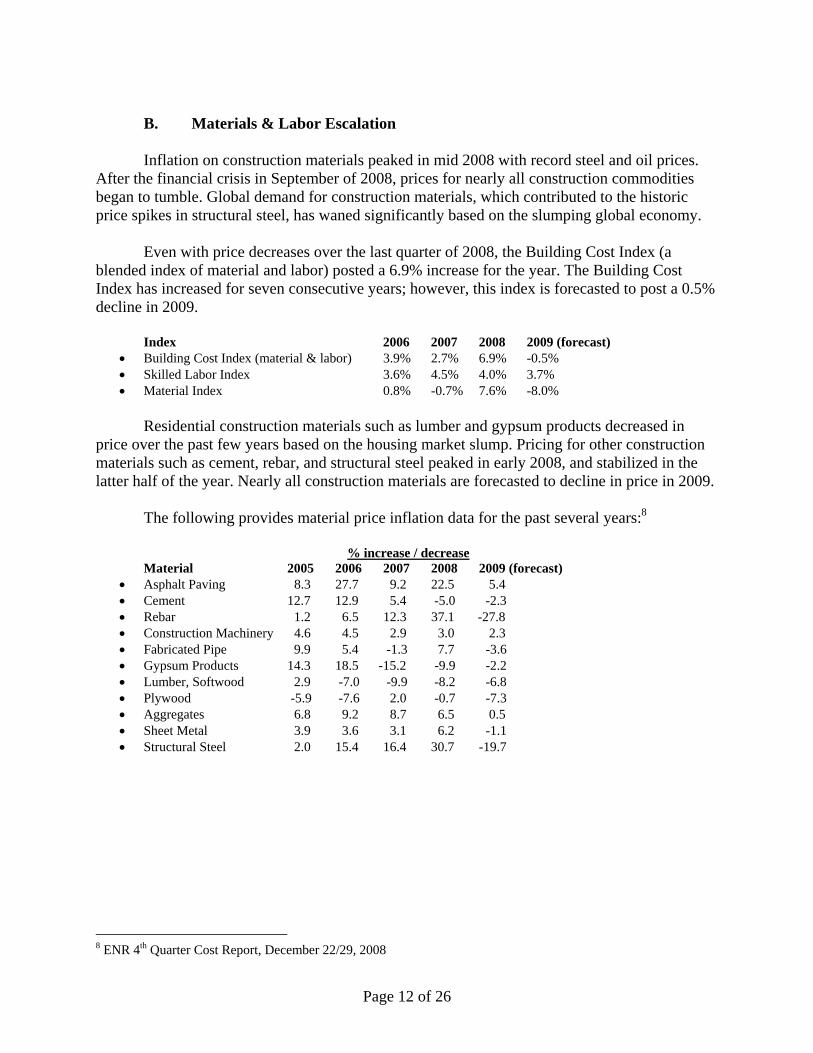
B. Materials & Labor Escalation
Inflation on construction materials peaked in mid 2008 with record steel and oil prices. After the financial crisis in September of 2008, prices for nearly all construction commodities began to tumble. Global demand for construction materials, which contributed to the historic price spikes in structural steel, has waned significantly based on the slumping global economy.
Even with price decreases over the last quarter of 2008, the Building Cost Index (a blended index of material and labor) posted a 6.9% increase for the year. The Building Cost Index has increased for seven consecutive years; however, this index is forecasted to post a 0.5% decline in 2009.
Index 2006 2007 2008 2009 (forecast)
• Building Cost Index (material & labor) 3.9% 2.7% 6.9% -0.5% • Skilled Labor Index 3.6% 4.5% 4.0% 3.7% • Material Index 0.8% -0.7% 7.6% -8.0%
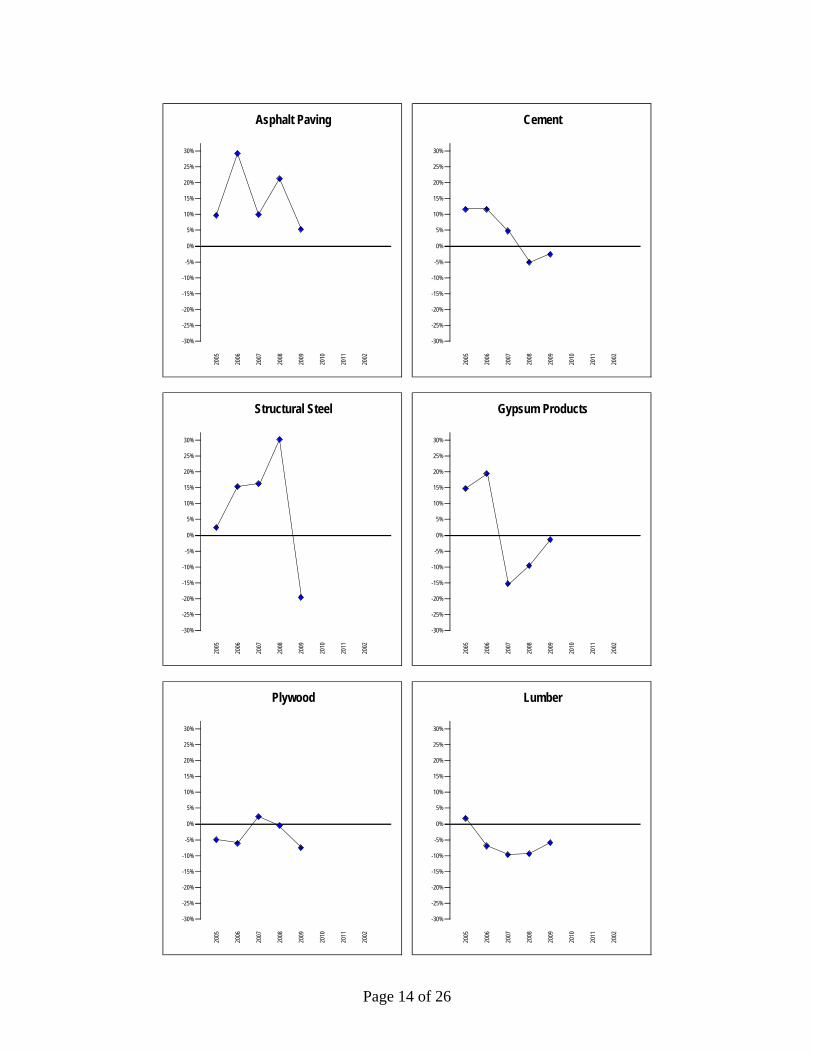
Residential construction materials such as lumber and gypsum products decreased in price over the past few years based on the housing market slump. Pricing for other construction materials such as cement, rebar, and structural steel peaked in early 2008, and stabilized in the latter half of the year. Nearly all construction materials are forecasted to decline in price in 2009.
The following provides material price inflation data for the past several years:8 % increase / decrease
Material 2005 2006 2007 2008 2009 (forecast) • Asphalt Paving 8.3 27.7 9.2 22.5 5.4 • Cement 12.7 12.9 5.4 -5.0 -2.3 • Rebar 1.2 6.5 12.3 37.1 -27.8 • Construction Machinery 4.6 4.5 2.9 3.0 2.3 • Fabricated Pipe 9.9 5.4 -1.3 7.7 -3.6 • Gypsum Products 14.3 18.5 -15.2 -9.9 -2.2 • Lumber, Softwood 2.9 -7.0 -9.9 -8.2 -6.8 • Plywood -5.9 -7.6 2.0 -0.7 -7.3 • Aggregates 6.8 9.2 8.7 6.5 0.5 • Sheet Metal 3.9 3.6 3.1 6.2 -1.1 • Structural Steel 2.0 15.4 16.4 30.7 -19.7
8 ENR 4th Quarter Cost Report, December 22/29, 2008
Page 13 of 26
1994
1995
1996
1997
1998
1999
2000
2001
2002
2003
2004
2005
2006
2007
2008
2009
2010
2011
1994
1995
1996
1997
1998
1999
2000
2001
2002
2003
2004
2005
2006
2007
2008
2009
2010
2011
1,960
Year
2,0402,0202,0001,980
2,1202,1002,0802,060
2,2002,1802,1602,140
2,2802,2602,2402,220
2,3602,3402,3202,300
2,4402,4202,4002,380
2,5202,5002,4802,460
2,6002,5802,5602,540
Material Cost Index2,7402,7202,7002,6802,6602,6402,620
5,9005,8005,7005,600
Year
5,5005,4005,3005,2005,1005,000
6,3006,2006,1006,000
6,7006,6006,5006,400
7,1007,0006,9006,800
7,5007,4007,3007,200
7,9007,8007,7007,600
Construction Cost Index8,900
8,6008,500
8,7008,800
8,000
8,4008,3008,2008,100
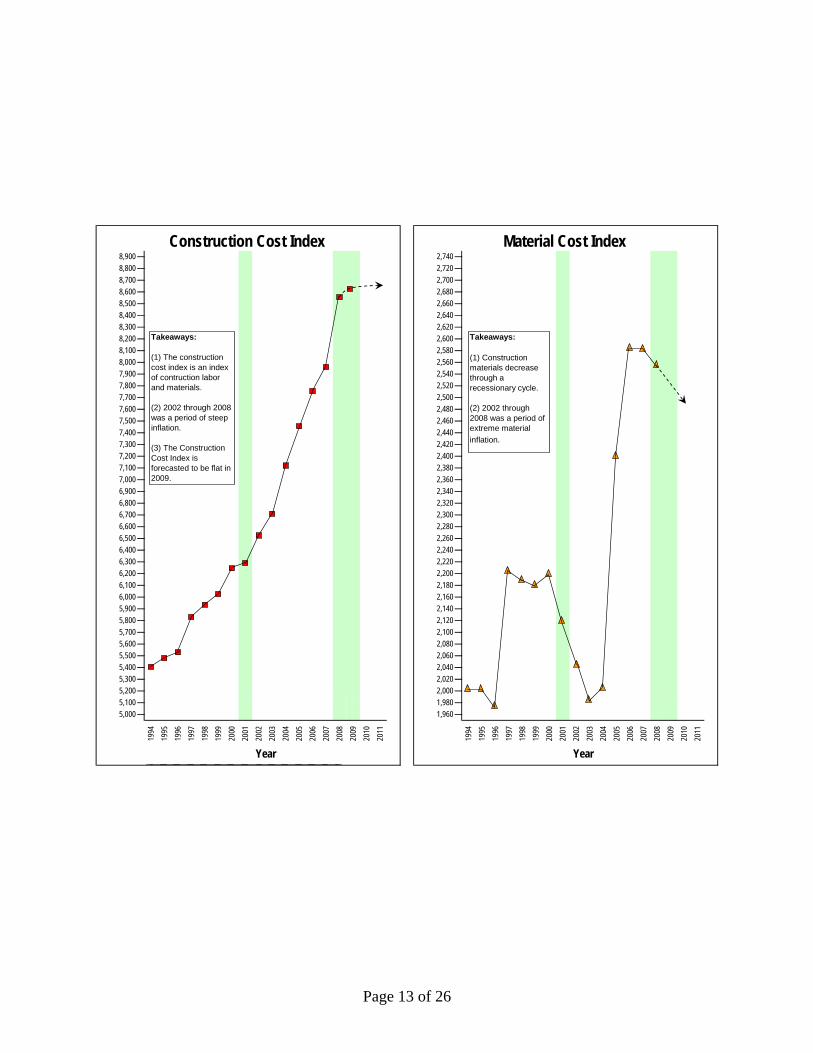
Takeaways:
(1) Construction materials decrease through a recessionary cycle.
(2) 2002 through 2008 was a period of extreme material inflation.
Takeaways:
(1) The construction cost index is an index of contruction labor and materials.
(2) 2002 through 2008 was a period of steep inflation.
(3) The Construction Cost Index is forecasted to be flat in 2009.
Page 14 of 26
2005
2006
2007
2008
2009
2010
2011
2002
2005
2006
2007
2008
2009
2010
2011
2002
2005
2006
2007
2008
2009
2010
2011
2002
2005
2006
2007
2008
2009
2010
2011
2002
2005
2006
2007
2008
2009
2010
2011
2002
2005
2006
2007
2008
2009
2010
2011
2002
Asphalt Paving Cement
30% 30%
25% 25%
20% 20%
15% 15%
10% 10%
5% 5%
0% 0%
-5% -5%
-10% -10%
-15% -15%
-20% -20%
-25% -25%
-30% -30%
Structural Steel Gypsum Products
30% 30%
25% 25%
20% 20%
15% 15%
10% 10%
5% 5%
0% 0%
-5% -5%
-10% -10%
-15% -15%
-20% -20%
-25% -25%
-30% -30%
Plywood Lumber
30% 30%
25% 25%
20% 20%
15% 15%
10% 10%
5% 5%
0% 0%
-5% -5%
-10% -10%
-15% -15%
-20% -20%
-25% -25%
-30% -30%
Page 15 of 26
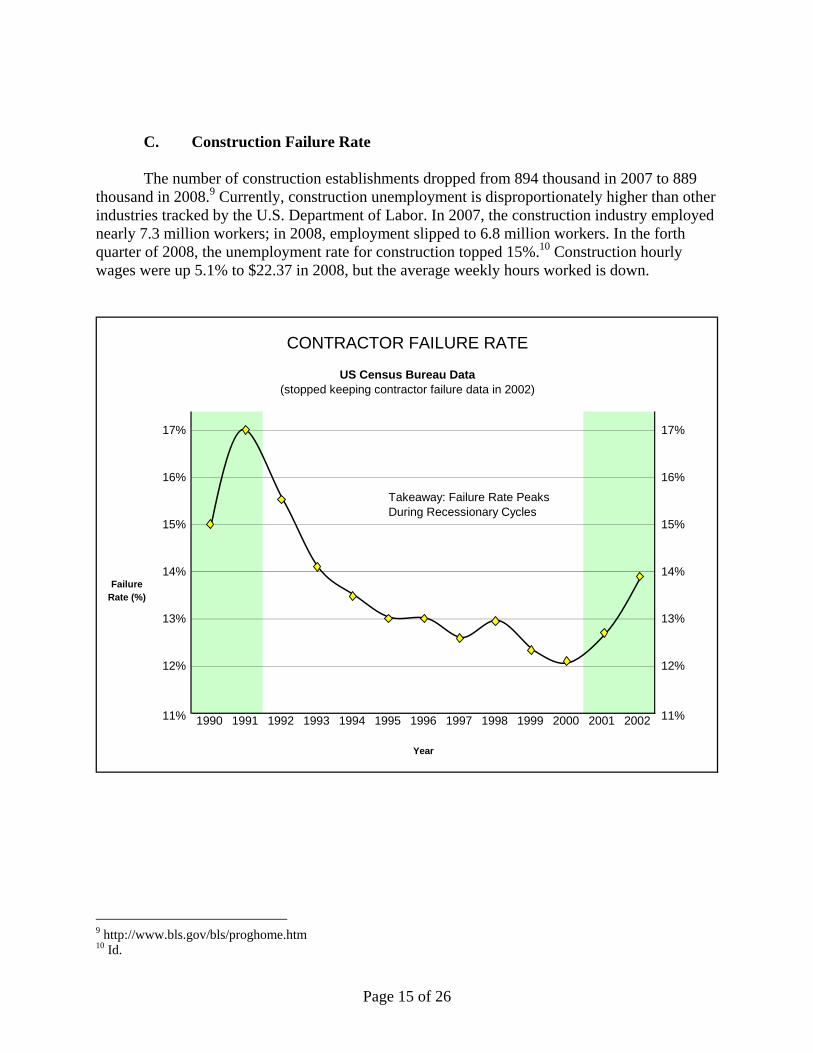
C. Construction Failure Rate
The number of construction establishments dropped from 894 thousand in 2007 to 889 thousand in 2008.9 Currently, construction unemployment is disproportionately higher than other industries tracked by the U.S. Department of Labor. In 2007, the construction industry employed nearly 7.3 million workers; in 2008, employment slipped to 6.8 million workers. In the forth quarter of 2008, the unemployment rate for construction topped 15%.10 Construction hourly wages were up 5.1% to $22.37 in 2008, but the average weekly hours worked is down.
9 http://www.bls.gov/bls/proghome.htm 10 Id.
1990 1991 1992 1993 1994 1995 1996 1997 1998 1999 2000 2001 2002
17%
16%
15%
14%
13%
12%
11%
CONTRACTOR FAILURE RATE
US Census Bureau Data(stopped keeping contractor failure data in 2002)
Year
14%
13%
16%
17%
FailureRate (%)
15%
12%
11%
Takeaway: Failure Rate Peaks During Recessionary Cycles

Page 16 of 26
D. Construction Legislation
On January 15, 2008, House Democrats published details of an $825 billion economic stimulus package to combat the current recession. The bill was subsequently reduced to $787 billion. Construction-related spending included in the stimulus package is approximately $131 billion.11 The proposed bill details funding for a broad range of construction programs, across many federal departments and agencies:
• Transportation Projects: $49 billion [majority of funds to DOT highway projects] • Energy: $31 billion [majority of funds for grid investment and renewable
energy] • School Projects: ? [there are no specific line items for construction but
11 http://enr.construction.com/business_management/finance/2009/0213-stimulusbill.htm
FailureRate(%)
2003 2004 2005 2006 2007 2008 2009 2010 2011 2012 2013 2014 2015
General ContractorsHeavy ContractorsSpecialty Contractors
10%
CONTRACTOR FAILURE RATE
BizMinor Data
30%
25%
20%
15%15%
10%
Forecast
(US Census Bureau recommends BizMinor for Failure Rate data)
30%
25%
20%
Page 17 of 26
approximately $40 billion is going to school districts for which the districts can use for upgrades]
• Water & Environ. Projects: $20 billion [majority of funds to EPA clean water projects & Army Corps eng. projects]
• Housing Projects: $10 billion [mainly for facilities improvements to HUD projects] • Defense Project: $ 8 billion [majority of funds to facilities improvements] • Buildings: $13 billion [majority of funds to new/exiting GSA buildings]
Macroeconomic Advisers, a forecasting firm, estimated that a stimulus plan totaling
$775 billion over two years would: (1) boost GDP by 3.2%; (2) reduce the unemployment rate by 1.7 percentage points; and (3) raise employment by 3.3 million jobs12
E. Market Sector Review
Aside from the Residential, Commercial, and Communication sectors, the balance of construction categories performed reasonably well in 2008. In 2009, nearly all private sector work is forecasted to slip based on the difficulties in securing construction financing. Public construction in 2009 is forecasted to be flat as tax revenue substantially declined over the past two years. Stimulus funding for public construction will not have a noticeable effect on put-in-place construction until 2010, as funding must be set in place, projects need be designed in some cases and subsequently awarded, and construction needs to commence in earnest.
The following is a brief 2008 performance review and 2009 forecast for key construction
categories.13
• Manufacturing (69% increase in revenue in 2008): Although square footage is considerably down over the past six years, construction revenue from this sector boomed in 2008 as a result of multibillion dollar oil refinery and steel processing projects. This category will retreat in 2009 as square footage is estimated to drop from 85 million square feet to 77 million square feet, and fewer mega-projects are scheduled. Key Indicator(s): The threshold average for Manufacturing is 110 million square feet. (2008 estimate: 85 million SF; 2009 projection: 77 million)
• Power (44% increase in revenue in 2008): Due to the funding provided by the Energy Policy Act of
2005, the Power category had a banner year. Although 2009 revenue will likely drop somewhat, the stimulus package should support this sector for years to come. In addition, the nuclear industry has been revitalized after being dormant for over two decades with two new power plants in the planning phase.
Key Indicator(s): Federal/State legislation; nuclear power consortium NuStart Energy (the agency that selected the two new nuclear power sites).
• Water Supply (13% increase in revenue in 2008): In 2008, this category recorded impressive gains for the sixth consecutive year. Funding for water supply and water quality projects comes from the state level. Because states currently have funding issues due to shrinking tax revenue, this sector will likely be flat in 2009. By 2010, however, the stimulus package should provide considerable funding for water projects.
Key Indicator(s): Federal/State legislation; municipal funding; Growth of the Residential sector.
12 http://online.wsj.com/article/SB123202946622485595.html 13 McGraw Hill Construction Outlook 2009 Report
Page 18 of 26
• Lodging (35% increase in revenue in 2008): The lodging sector had its fifth straight growth year. With
the tightening credit market, unemployment, reduction in occupancy rates, and reduction in business travel, this sector is forecasted to shrink considerably in 2009.
Key Indicator(s): The threshold average for hotel construction is 60 million square feet. (2008 estimate: 88 million SF; 2009 projection: 70 million SF; 2001 recession: ~40 million SF)
• Health Care (12% increase in revenue in 2008): The Health Care segment is up for the seventh
consecutive year. This segment will likely be flat in 2009 based on the weak economy causing delays to development projects. However, the demographics of the U.S., with the aging baby boomer generation, causes continued demand to support the growth of this sector for years to come.
Key indicator(s): The threshold average for healthcare facility construction is 80 million square feet. (2008 estimate: 104 million SF; 2009 projection: 98 million SF; 2001 recession: 85 million)
• Office (16% increase in revenue in 2008): The office sector had its fifth straight growth year. Because of
credit conditions and unemployment, this sector will be substantially off in 2009. In addition, vacancy rates, which continue to be reasonably low, are expected to rise in 2009.
Key indicator(s): The threshold average for office construction is 200 million square feet (2008 estimate: 180 million SF; 2009 projection: 150 million SF; 2001 recession: 155 million). The threshold for vacancy rates is approximately 12% - anything below is good, anything above bad (in 2008, the vacancy rate for downtown office building is approximately 11%, in the late 1980s, the vacancy rate was above 15%).
• Highway and Street (9% increase in revenue in 2008): Public construction remained strong in 2008 with
this sector up 9%. Decreasing tax revenue will impact this sector in 2009 but the stimulus package, coupled with the SAFETEA-LU bill, should support this category in 2010 and beyond.
Key Indicator(s): Federal/State legislation; municipal funding; Growth of the Residential sector.
• Sewage & Waste Disposal (6% increase in revenue in 2008): This sector grew for the sixth consecutive
year in 2008. Because the majority of funding for this category comes from state funding, this sector will likely retreat in 2009 but should bounce back in 2010 due to increased federal funding.
Key Indicator(s): Federal/State legislation; municipal funding; Growth of the Residential sector.
• Educational (10% increase in revenue in 2008): The educational sector recorded its fourth consecutive
year of growth. 2009 forecasted growth is 3%. The stimulus package will likely have a positive affect on this sector in 2010.
Key indicator(s): The threshold average for the education sector is 200 million square feet. (2008 estimate: 223 million SF; 2009 projection: 207 million); Growth of the Residential sector.
• Amusement & Recreation (5% increase in revenue in 2008): This category was up mildly in 2008 as
sporting areas, theaters, and convention centers that were planned years ago were largely completed. Amusement & Recreation is directly affected by the poor economy so revenue will retreat significantly in 2009.
Key Indicator(s): The threshold average for Amusement & Recreation 65 million square feet. (2008 estimate: 64 million SF; 2009 projection: 60 million)
• Commercial (8% decrease in revenue in 2008): The retail market cooled off in 2008 after consistent growth over the past four years. A slow residential market often leads to slow commercial markets as new retail centers typically follow residential developments. This sector will continue to slow as numerous large
Page 19 of 26
retail companies have filed for bankruptcy and/or are closing hundreds of stores. New store openings are also on the decline.
Key indicator(s): the threshold for an average year is 250 million square feet per year (2008 figure was 220 million square feet).
• Residential (28% decrease in revenue in 2008): The good news is the Residential market cannot get
much worse. Economists forecast this segment will finally bottom out in 2009 with a 5% drop in revenue.
Key indicator(s): The threshold for an average year in the Residential Sector is 1.2 million new single-family homes. The number of single-family homes peaked in 2006 with the construction of over 1.7 million units. In 2008, this figure dropped to 582 thousand units.
F. Current Trends in the Construction Industry
1. Green Building Standards
The American Society of Heating, Refrigeration and Air Conditioning Engineers Inc. (“ASHRAE”) is scheduled to launch the first U.S. green building standards in 2009. ASHRAE is modeling its program after the U.S. Department of Energy’s standards for building products and systems, but ASHRAE’s program is designed for buildings.
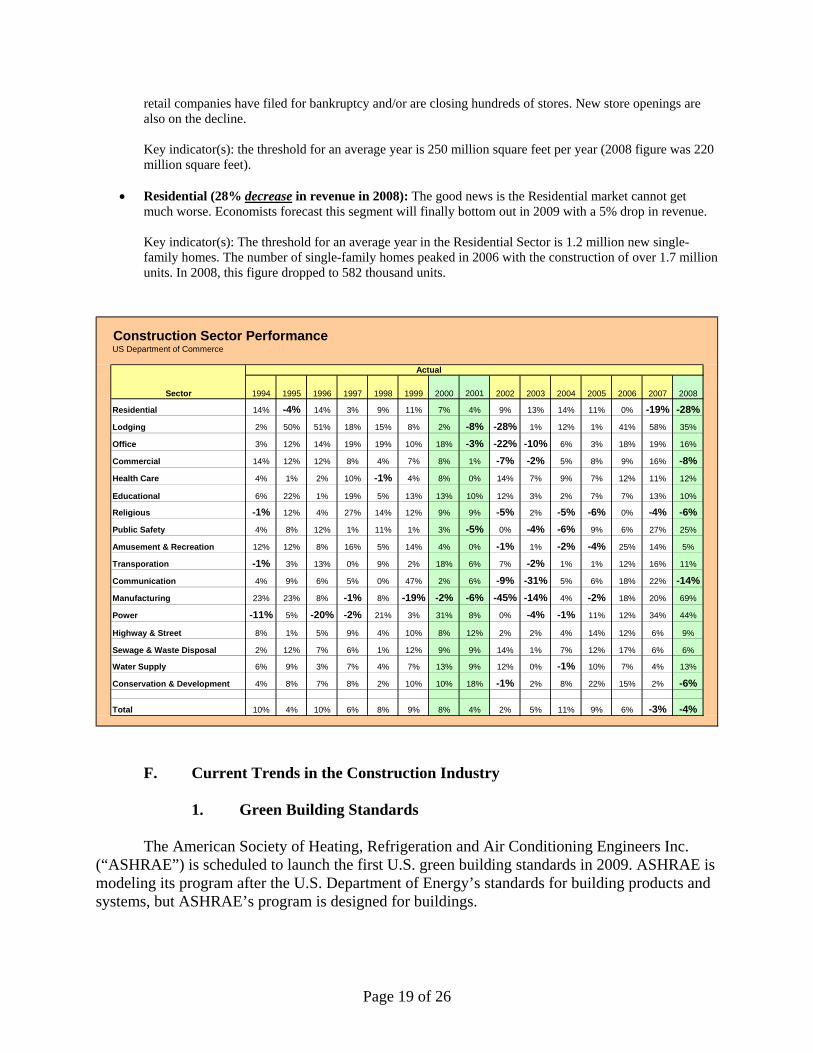
Construction Sector PerformanceUS Department of Commerce
1994 1995 1996 1997 1998 1999 2000 2001 2002 2003 2004 2005 2006 2007 2008
Residential 14% -4% 14% 3% 9% 11% 7% 4% 9% 13% 14% 11% 0% -19% -28%Lodging 2% 50% 51% 18% 15% 8% 2% -8% -28% 1% 12% 1% 41% 58% 35%
Office 3% 12% 14% 19% 19% 10% 18% -3% -22% -10% 6% 3% 18% 19% 16%
Commercial 14% 12% 12% 8% 4% 7% 8% 1% -7% -2% 5% 8% 9% 16% -8%Health Care 4% 1% 2% 10% -1% 4% 8% 0% 14% 7% 9% 7% 12% 11% 12%
Educational 6% 22% 1% 19% 5% 13% 13% 10% 12% 3% 2% 7% 7% 13% 10%
Religious -1% 12% 4% 27% 14% 12% 9% 9% -5% 2% -5% -6% 0% -4% -6%Public Safety 4% 8% 12% 1% 11% 1% 3% -5% 0% -4% -6% 9% 6% 27% 25%
Amusement & Recreation 12% 12% 8% 16% 5% 14% 4% 0% -1% 1% -2% -4% 25% 14% 5%
Transporation -1% 3% 13% 0% 9% 2% 18% 6% 7% -2% 1% 1% 12% 16% 11%
Communication 4% 9% 6% 5% 0% 47% 2% 6% -9% -31% 5% 6% 18% 22% -14%Manufacturing 23% 23% 8% -1% 8% -19% -2% -6% -45% -14% 4% -2% 18% 20% 69%
Power -11% 5% -20% -2% 21% 3% 31% 8% 0% -4% -1% 11% 12% 34% 44%
Highway & Street 8% 1% 5% 9% 4% 10% 8% 12% 2% 2% 4% 14% 12% 6% 9%
Sewage & Waste Disposal 2% 12% 7% 6% 1% 12% 9% 9% 14% 1% 7% 12% 17% 6% 6%
Water Supply 6% 9% 3% 7% 4% 7% 13% 9% 12% 0% -1% 10% 7% 4% 13%
Conservation & Development 4% 8% 7% 8% 2% 10% 10% 18% -1% 2% 8% 22% 15% 2% -6%
Total 10% 4% 10% 6% 8% 9% 8% 4% 2% 5% 11% 9% 6% -3% -4%
Sector
Actual
Page 20 of 26
Starting in 2010, all commercial real estate transactions in California will require disclosure of building energy use.14 Other states will likely follow California’s lead.
2. Public-Private Partnerships (“PPP”)
The construction industry is buzzing about the use of PPPs for public infrastructure
projects, such as public toll roads, where a project is funded and operated through a partnership of the government and private sector company(s). To date, there have been 14 notable PPPs for infrastructure projects in the U.S. – the majority involved transportation projects in California and New York. PPPs are prevalent in Australia and Europe, and are now graining traction in the U.S.
3. Assessing the Nation’s Infrastructure
The American Society of Civil Engineers’ (“ASCE”) “2008 Report Card for America’s Infrastructure” illustrates the overall poor condition of bridges, dams, rail, schools, transit, wastewater, levees, etc. ASCE issued eleven Ds and four Cs for the fifteen subject areas.15
The poor condition of the nation’s infrastructure was brought to the forefront due to
media coverage of the: (1) fifty levee and flood wall breaks in August of 2005 during Hurricane Katrina, and (2) the I-35W bridge collapse over the Mississippi River in August of 2007. Improving the nation’s infrastructure will be a hot topic for years to come.
4. Building Information Modeling (“BIM”)
BIM is the process of creating and using digital models for the design and construction of projects. The digital models provide owners, architects, and contractors a visual picture on how a building and its various systems are properly coordinated. This type of modeling is also being developed to define exact material quantities to increase the efficiency of the bidding process.
14 ENR, February 2, 2008, “Work Restarted on First U.S. Green Building Standard,” pg 16. 15 ENR, February 2, 2008, “Latest Poor Grades Reflect Dismal Conditions,” pg 16.
Page 21 of 26
IV. State of the Surety Industry
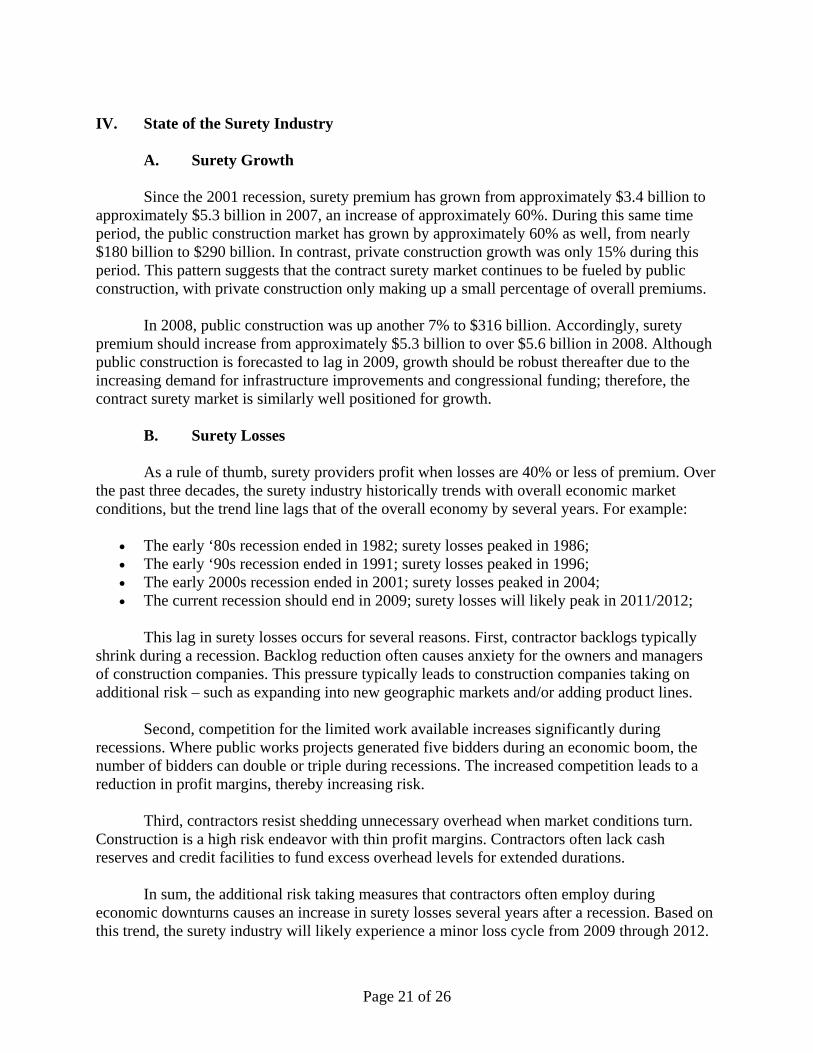
A. Surety Growth Since the 2001 recession, surety premium has grown from approximately $3.4 billion to approximately $5.3 billion in 2007, an increase of approximately 60%. During this same time period, the public construction market has grown by approximately 60% as well, from nearly $180 billion to $290 billion. In contrast, private construction growth was only 15% during this period. This pattern suggests that the contract surety market continues to be fueled by public construction, with private construction only making up a small percentage of overall premiums.
In 2008, public construction was up another 7% to $316 billion. Accordingly, surety premium should increase from approximately $5.3 billion to over $5.6 billion in 2008. Although public construction is forecasted to lag in 2009, growth should be robust thereafter due to the increasing demand for infrastructure improvements and congressional funding; therefore, the contract surety market is similarly well positioned for growth. B. Surety Losses As a rule of thumb, surety providers profit when losses are 40% or less of premium. Over the past three decades, the surety industry historically trends with overall economic market conditions, but the trend line lags that of the overall economy by several years. For example:
• The early ‘80s recession ended in 1982; surety losses peaked in 1986; • The early ‘90s recession ended in 1991; surety losses peaked in 1996; • The early 2000s recession ended in 2001; surety losses peaked in 2004; • The current recession should end in 2009; surety losses will likely peak in 2011/2012;
This lag in surety losses occurs for several reasons. First, contractor backlogs typically
shrink during a recession. Backlog reduction often causes anxiety for the owners and managers of construction companies. This pressure typically leads to construction companies taking on additional risk – such as expanding into new geographic markets and/or adding product lines.
Second, competition for the limited work available increases significantly during
recessions. Where public works projects generated five bidders during an economic boom, the number of bidders can double or triple during recessions. The increased competition leads to a reduction in profit margins, thereby increasing risk.
Third, contractors resist shedding unnecessary overhead when market conditions turn.
Construction is a high risk endeavor with thin profit margins. Contractors often lack cash reserves and credit facilities to fund excess overhead levels for extended durations.
In sum, the additional risk taking measures that contractors often employ during
economic downturns causes an increase in surety losses several years after a recession. Based on this trend, the surety industry will likely experience a minor loss cycle from 2009 through 2012.
Page 22 of 26
C. Loss Cycle Review
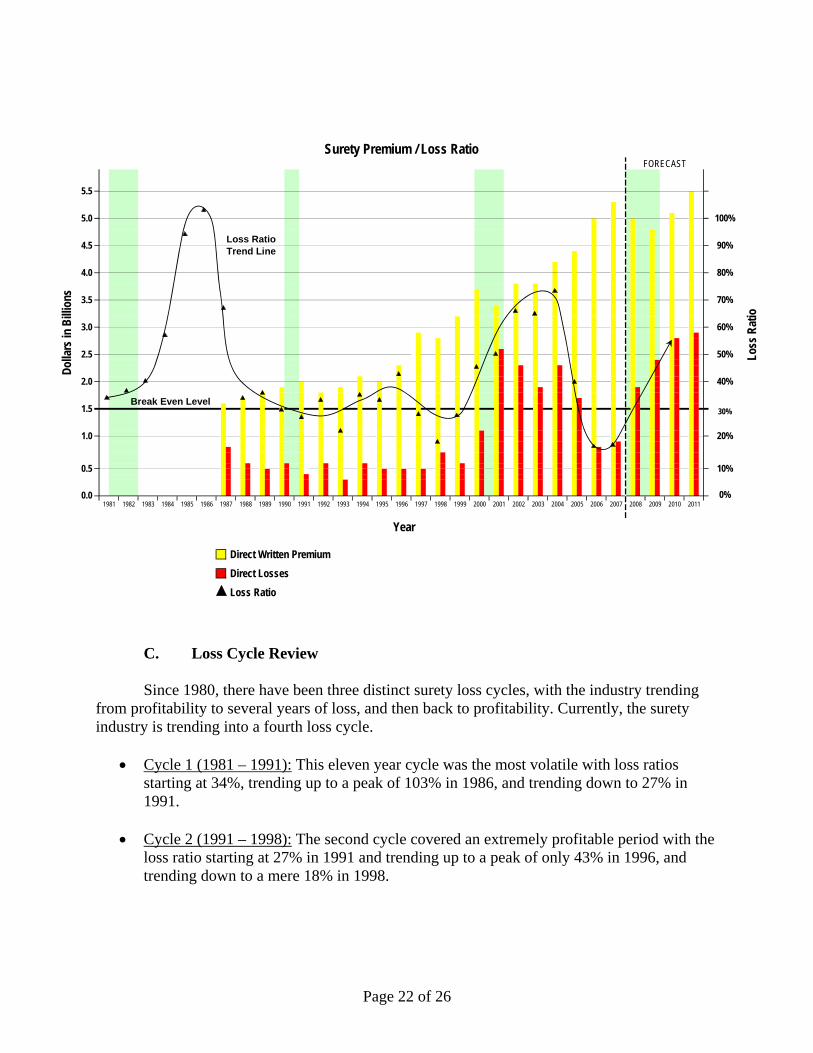
Since 1980, there have been three distinct surety loss cycles, with the industry trending from profitability to several years of loss, and then back to profitability. Currently, the surety industry is trending into a fourth loss cycle.
• Cycle 1 (1981 – 1991): This eleven year cycle was the most volatile with loss ratios starting at 34%, trending up to a peak of 103% in 1986, and trending down to 27% in 1991.
• Cycle 2 (1991 – 1998): The second cycle covered an extremely profitable period with the
loss ratio starting at 27% in 1991 and trending up to a peak of only 43% in 1996, and trending down to a mere 18% in 1998.
Direct Written Premium Direct Losses Loss Ratio
2009 2010 2011
Year
2005 2006 2007 20082001 2002 2003 20041997 1998 1999 20001993 1994 1995 19961989 1990 1991 19920.0 0%
1981 1982 1983 1984 1985 1986 1987 1988
1.0 20%
0.5 10%
2.0 40%
30%1.5
3.0 60%
2.5 50%
80%
3.5 70%
Surety Premium / Loss RatioFORECAST
Dolla
rs in
Billi
ons
Loss
Rat
io
5.5
5.0 100%
4.5 90%
4.0
Loss Ratio Trend Line
Break Even Level
Page 23 of 26
• Cycle 3 (1998 – 2007): The third cycle started in 1998 with a loss ratio of 18% and trended up to a peak of 73% in 2004, and trending down to a historical low of 16% in 2006 and 2007.
• Cycle 4 (2007 – 2016): The forth cycle started in 2007 with a loss ratio of 16% and will
likely trend up to a loss ratio of approximately 50% in 2011/2012, and trend back down for several years thereafter.
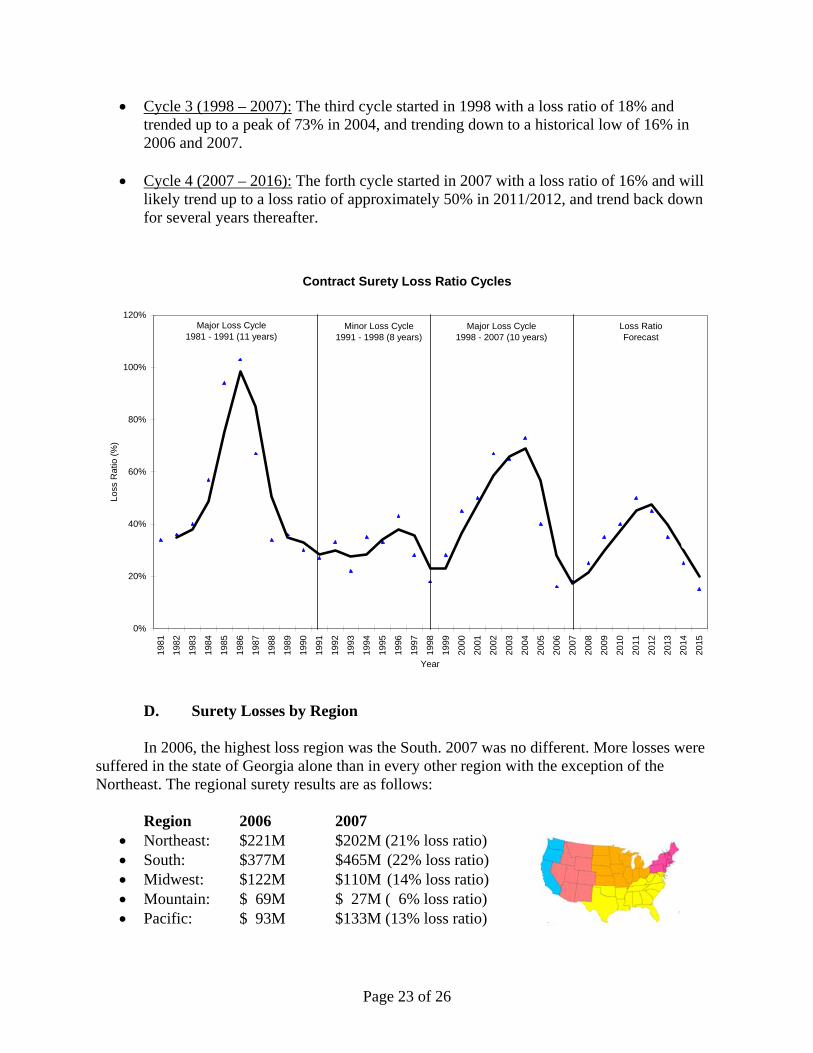
D. Surety Losses by Region
In 2006, the highest loss region was the South. 2007 was no different. More losses were suffered in the state of Georgia alone than in every other region with the exception of the Northeast. The regional surety results are as follows: Region 2006 2007
• Northeast: $221M $202M (21% loss ratio) • South: $377M $465M (22% loss ratio) • Midwest: $122M $110M (14% loss ratio) • Mountain: $ 69M $ 27M ( 6% loss ratio) • Pacific: $ 93M $133M (13% loss ratio)
Contract Surety Loss Ratio Cycles
0%
20%
40%
60%
80%
100%
120%
1981
1982
1983
1984
1985
1986
1987
1988
1989
1990
1991
1992
1993
1994
1995
1996
1997
1998
1999
2000
2001
2002
2003
2004
2005
2006
2007
2008
2009
2010
2011
2012
2013
2014
2015
Year
Loss
Rat
io (%
)
Major Loss Cycle1981 - 1991 (11 years)
Minor Loss Cycle1991 - 1998 (8 years)
Major Loss Cycle1998 - 2007 (10 years)
Loss RatioForecast
Page 24 of 26
In 2007, the majority of losses occurred in the Atlantic corridor. States/districts with unusually high loss ratios include Rhode Island (104%), Connecticut (92%), Hawaii (89%), Massachusetts (87%), Delaware (81%), and Washington D.C. (58%).
E. Surety Consolidation
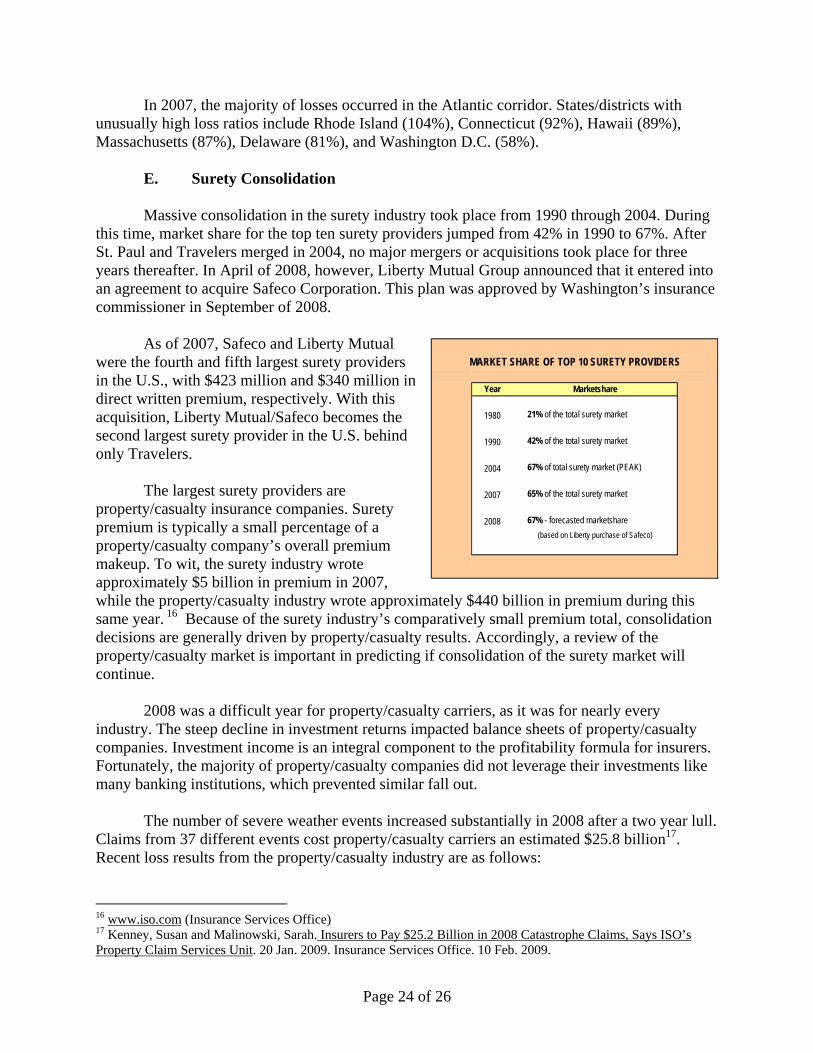
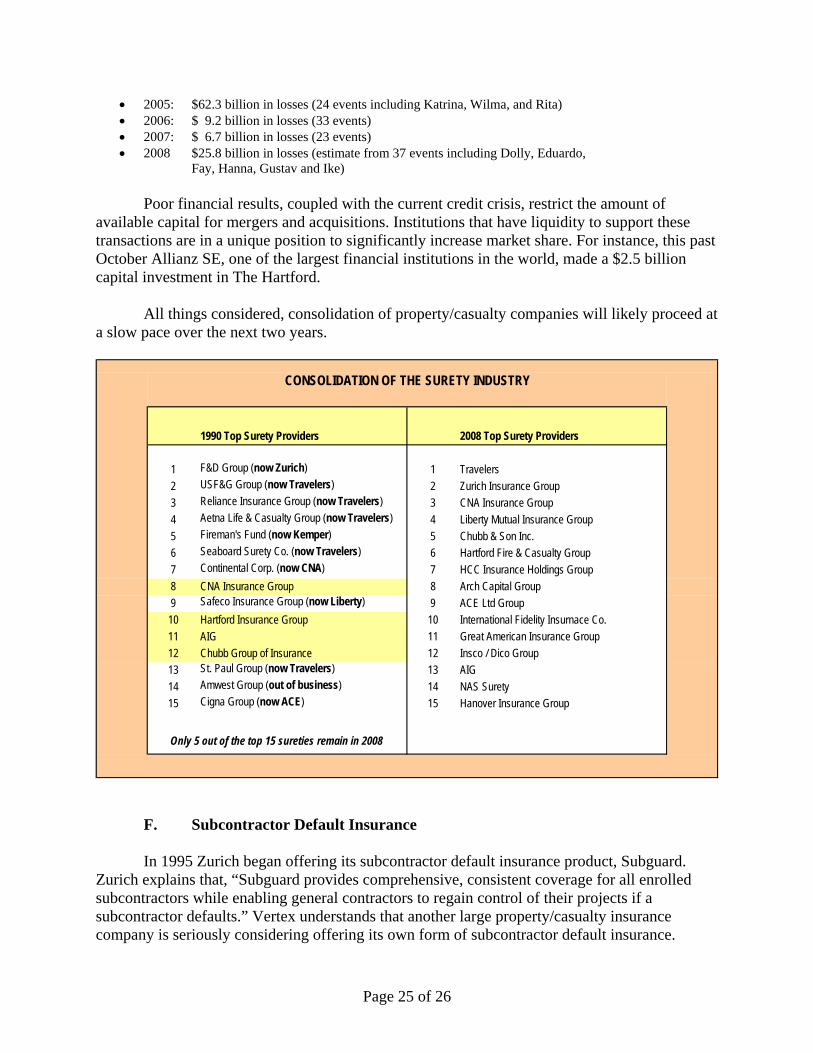
Massive consolidation in the surety industry took place from 1990 through 2004. During
this time, market share for the top ten surety providers jumped from 42% in 1990 to 67%. After St. Paul and Travelers merged in 2004, no major mergers or acquisitions took place for three years thereafter. In April of 2008, however, Liberty Mutual Group announced that it entered into an agreement to acquire Safeco Corporation. This plan was approved by Washington’s insurance commissioner in September of 2008.
As of 2007, Safeco and Liberty Mutual
were the fourth and fifth largest surety providers in the U.S., with $423 million and $340 million in direct written premium, respectively. With this acquisition, Liberty Mutual/Safeco becomes the second largest surety provider in the U.S. behind only Travelers.
The largest surety providers are
property/casualty insurance companies. Surety premium is typically a small percentage of a property/casualty company’s overall premium makeup. To wit, the surety industry wrote approximately $5 billion in premium in 2007, while the property/casualty industry wrote approximately $440 billion in premium during this same year. 16 Because of the surety industry’s comparatively small premium total, consolidation decisions are generally driven by property/casualty results. Accordingly, a review of the property/casualty market is important in predicting if consolidation of the surety market will continue.
2008 was a difficult year for property/casualty carriers, as it was for nearly every
industry. The steep decline in investment returns impacted balance sheets of property/casualty companies. Investment income is an integral component to the profitability formula for insurers. Fortunately, the majority of property/casualty companies did not leverage their investments like many banking institutions, which prevented similar fall out.
The number of severe weather events increased substantially in 2008 after a two year lull.
Claims from 37 different events cost property/casualty carriers an estimated $25.8 billion17. Recent loss results from the property/casualty industry are as follows:
16 www.iso.com (Insurance Services Office) 17 Kenney, Susan and Malinowski, Sarah. Insurers to Pay $25.2 Billion in 2008 Catastrophe Claims, Says ISO’s Property Claim Services Unit. 20 Jan. 2009. Insurance Services Office. 10 Feb. 2009.
Year Marketshare
1980 21% of the total surety market
1990 42% of the total surety market
2004 67% of total surety market (PEAK)
2007 65% of the total surety market
2008 67% - forecasted marketshare(based on Liberty purchase of Safeco)
MARKET SHARE OF TOP 10 SURETY PROVIDERS
Page 25 of 26
• 2005: $62.3 billion in losses (24 events including Katrina, Wilma, and Rita) • 2006: $ 9.2 billion in losses (33 events) • 2007: $ 6.7 billion in losses (23 events) • 2008 $25.8 billion in losses (estimate from 37 events including Dolly, Eduardo,
Fay, Hanna, Gustav and Ike)
Poor financial results, coupled with the current credit crisis, restrict the amount of available capital for mergers and acquisitions. Institutions that have liquidity to support these transactions are in a unique position to significantly increase market share. For instance, this past October Allianz SE, one of the largest financial institutions in the world, made a $2.5 billion capital investment in The Hartford.
All things considered, consolidation of property/casualty companies will likely proceed at a slow pace over the next two years.
F. Subcontractor Default Insurance In 1995 Zurich began offering its subcontractor default insurance product, Subguard.
Zurich explains that, “Subguard provides comprehensive, consistent coverage for all enrolled subcontractors while enabling general contractors to regain control of their projects if a subcontractor defaults.” Vertex understands that another large property/casualty insurance company is seriously considering offering its own form of subcontractor default insurance.
1990 Top Surety Providers 2008 Top Surety Providers
1 F&D Group (now Zurich) 1 Travelers2 USF&G Group (now Travelers) 2 Zurich Insurance Group3 Reliance Insurance Group (now Travelers) 3 CNA Insurance Group4 Aetna Life & Casualty Group (now Travelers) 4 Liberty Mutual Insurance Group5 Fireman's Fund (now Kemper) 5 Chubb & Son Inc.6 Seaboard Surety Co. (now Travelers) 6 Hartford Fire & Casualty Group7 Continental Corp. (now CNA) 7 HCC Insurance Holdings Group8 CNA Insurance Group 8 Arch Capital Group9 Safeco Insurance Group (now Liberty) 9 ACE Ltd Group10 Hartford Insurance Group 10 International Fidelity Insurnace Co.11 AIG 11 Great American Insurance Group12 Chubb Group of Insurance 12 Insco / Dico Group13 St. Paul Group (now Travelers) 13 AIG 14 Amwest Group (out of business) 14 NAS Surety15 Cigna Group (now ACE) 15 Hanover Insurance Group
Only 5 out of the top 15 sureties remain in 2008
CONSOLIDATION OF THE SURETY INDUSTRY
Page 26 of 26
Subguard is marketed to general contractors, at risk construction managers, and design
builders that have annual subcontract volume of more that $75 million (this was recently raised from $50 million). Subguard policy limits of up to $50 million per occurrence and $150 million aggregate are available. According to Zurich, Subguard fits nicely with new high rise residential and office construction projects.
Vertex understands Zurich has issued approximately 150 Subguard policies, which have
insured approximately $100 billion in construction since 1996. Vertex estimates that Subguard insurance has taken less than five percent market share from the surety industry. On public works projects, the surety industry is somewhat insulated from any threat posed by subcontractor default insurance due to statutory limitations. Moreover, Subguard is built for private construction projects, while surety premium is substantially derived from public construction projects.
_________________________________
Vertex is a worldwide provider of construction and environmental services. Vertex
Construction Services, Inc. provides consulting, construction management, and expert services on: surety claims, construction defect claims, property / casualty claims, and construction claims. Vertex Construction Services, Inc. also provides construction management services for public and private clients throughout the U.S. The Vertex companies include: Vertex Engineering Services, Vertex Construction Services, Vertex Environmental Services, Vertex Environmental Claims Services, Vertex Air Quality Services, and Vertex Government Services.
If you have any questions or comments regarding this report, please contact me at 303.623.9116 or [email protected]. In addition, a podcast that summarizes this report is located at www.vertexeng.com. VERTEX CONSTRUCTION SERVICES, INC.
William J. McConnell P.E. President