Embed Size (px)
Citation preview
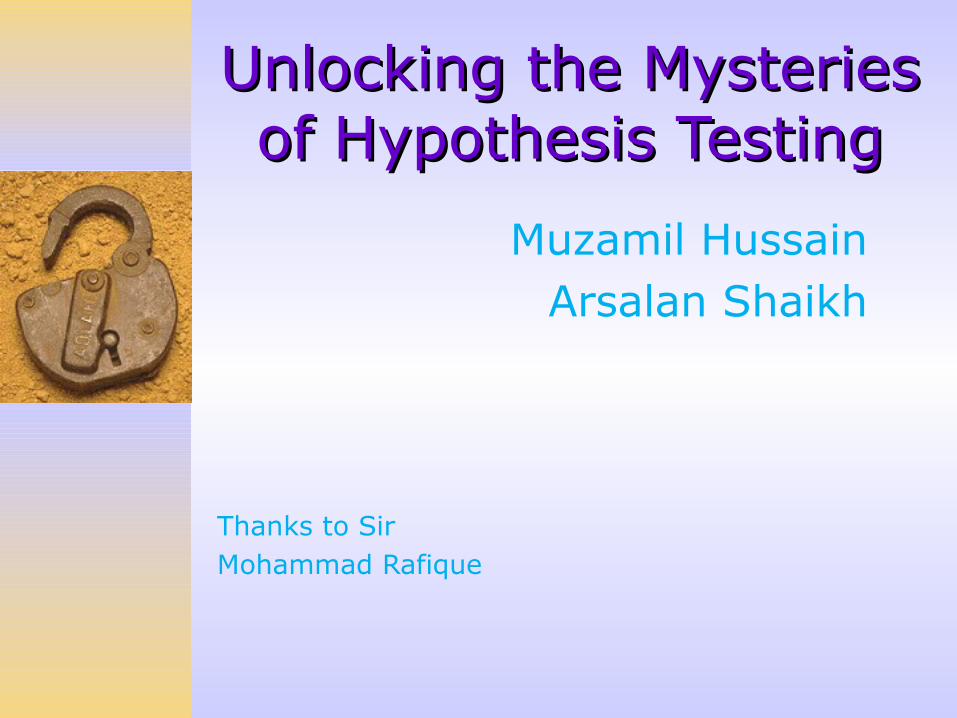
Muzamil HussainArsalan Shaikh
Thanks to Sir Mohammad Rafique
Unlocking the Mysteries Unlocking the Mysteries of Hypothesis Testingof Hypothesis Testing
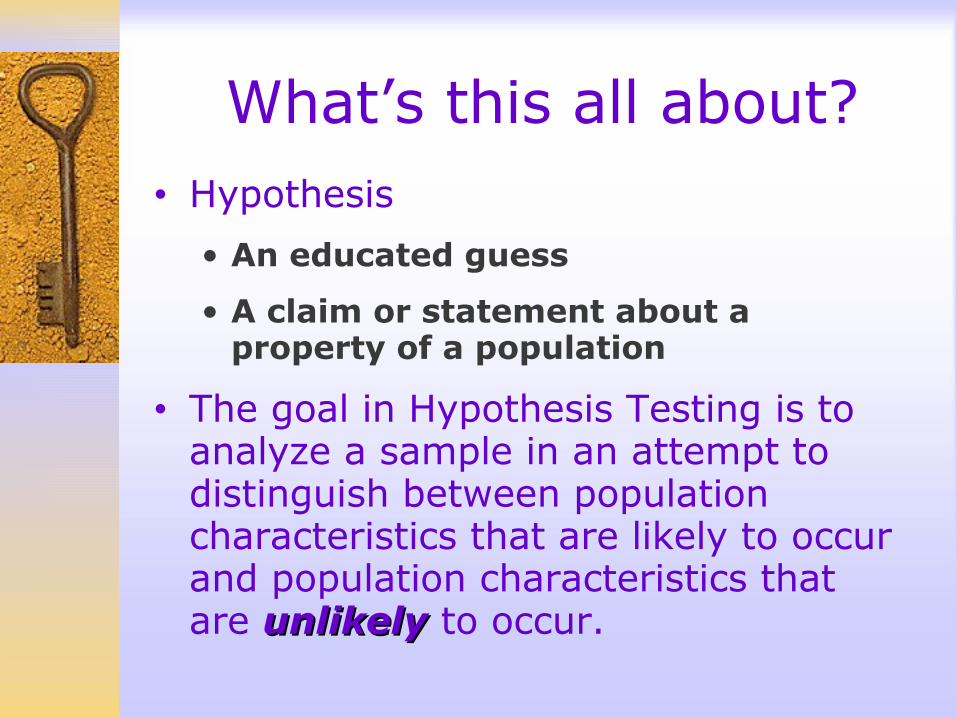
What’s this all about?• Hypothesis
• An educated guess
• A claim or statement about a property of a population
• The goal in Hypothesis Testing is to analyze a sample in an attempt to distinguish between population characteristics that are likely to occur and population characteristics that are unlikelyunlikely to occur.
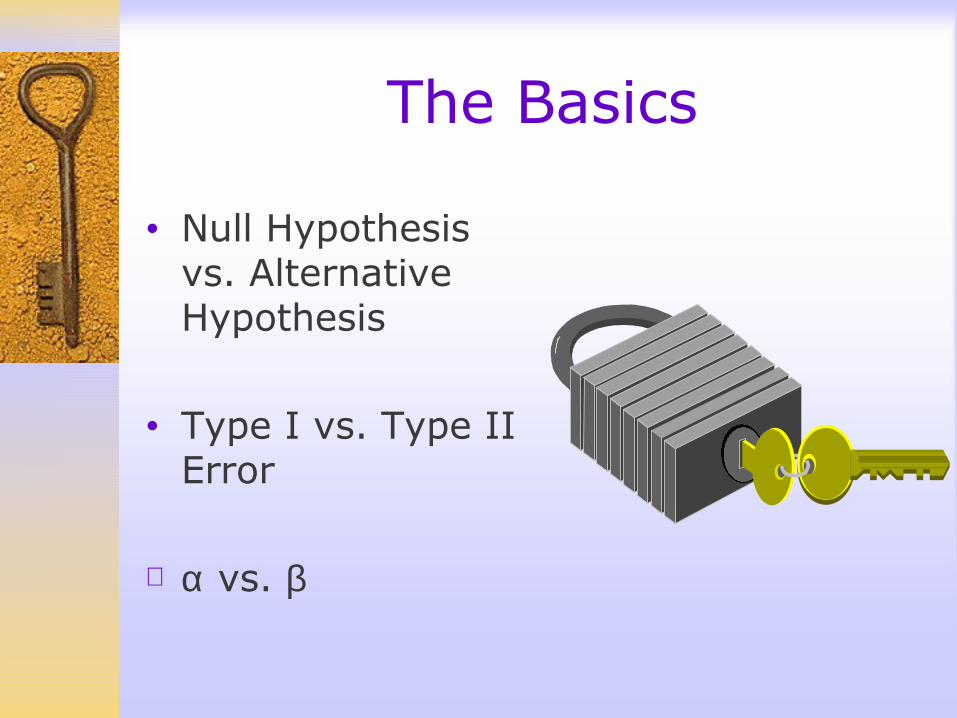
• Null Hypothesis vs. Alternative Hypothesis
• Type I vs. Type II Error
∀ α vs. β
The Basics
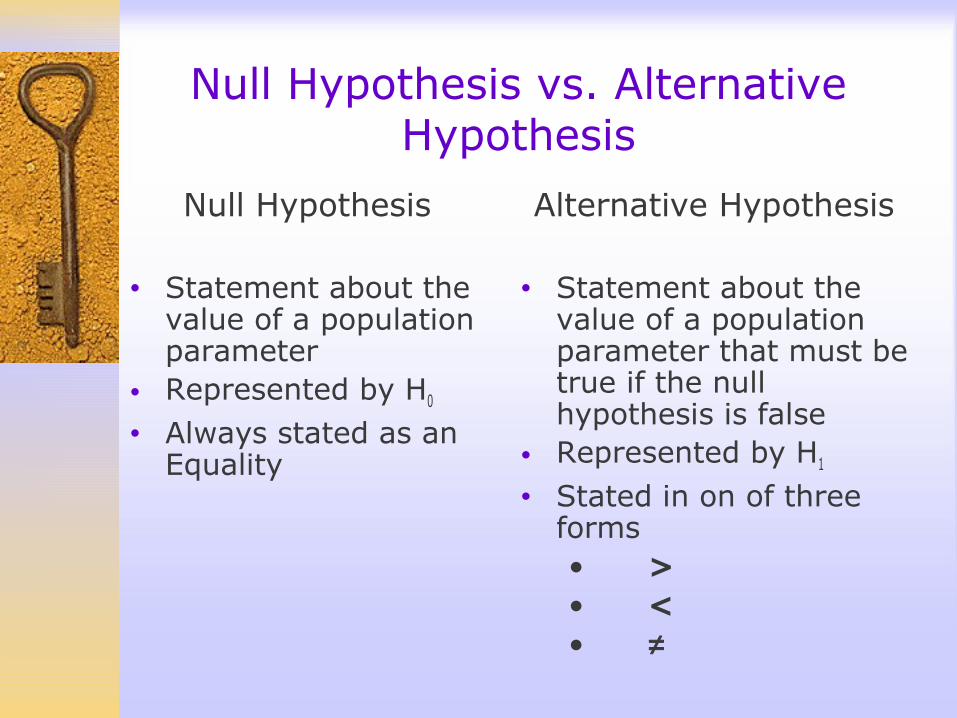
Null Hypothesis vs. Alternative Hypothesis
Null Hypothesis
• Statement about the value of a population parameter
• Represented by H0
• Always stated as an Equality
Alternative Hypothesis
• Statement about the value of a population parameter that must be true if the null hypothesis is false
• Represented by H1
• Stated in on of three forms• >• <• ≠
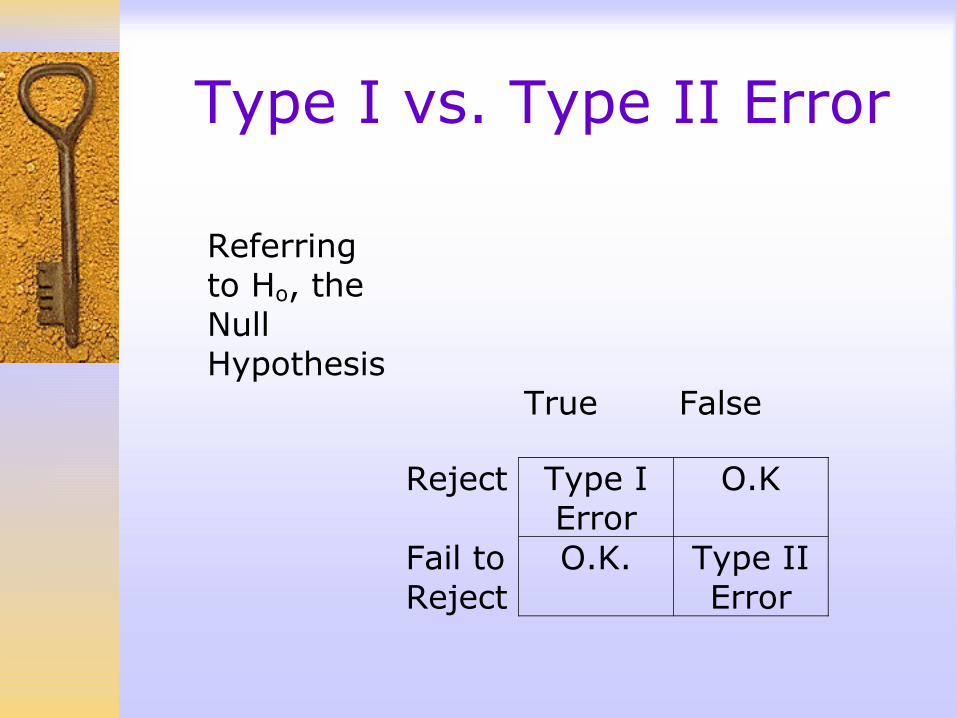
Type I vs. Type II Error
Referring to Ho, the Null Hypothesis
True False
Reject Type I Error
O.K
Fail to Reject
O.K. Type II Error
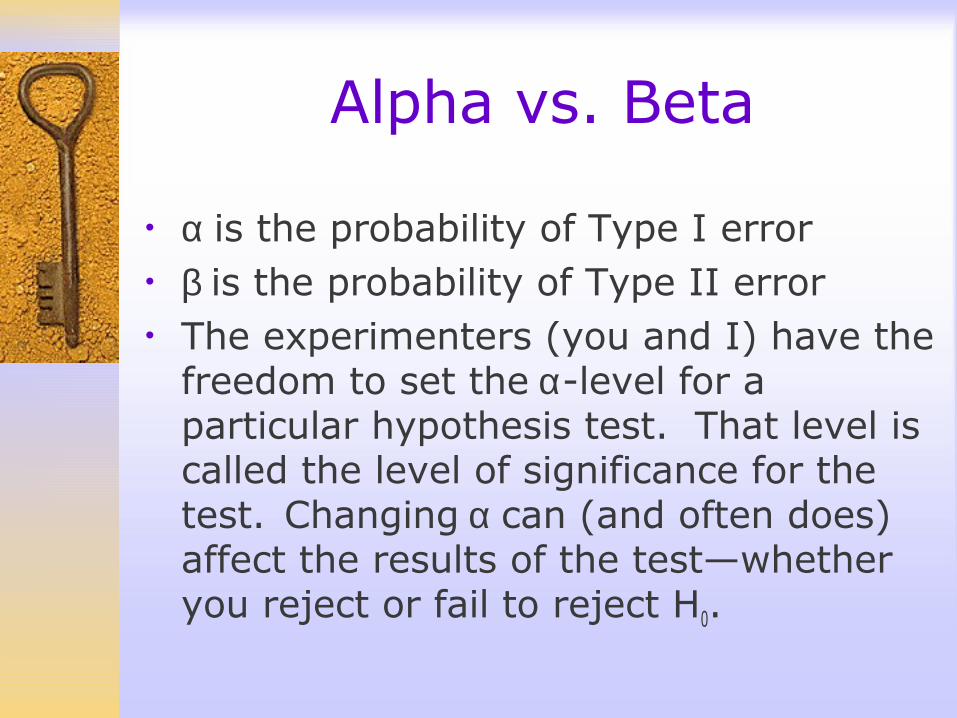
Alpha vs. Beta
• α is the probability of Type I error• β is the probability of Type II error• The experimenters (you and I) have the
freedom to set the α-level for a particular hypothesis test. That level is called the level of significance for the test. Changing α can (and often does) affect the results of the test—whether you reject or fail to reject H0.
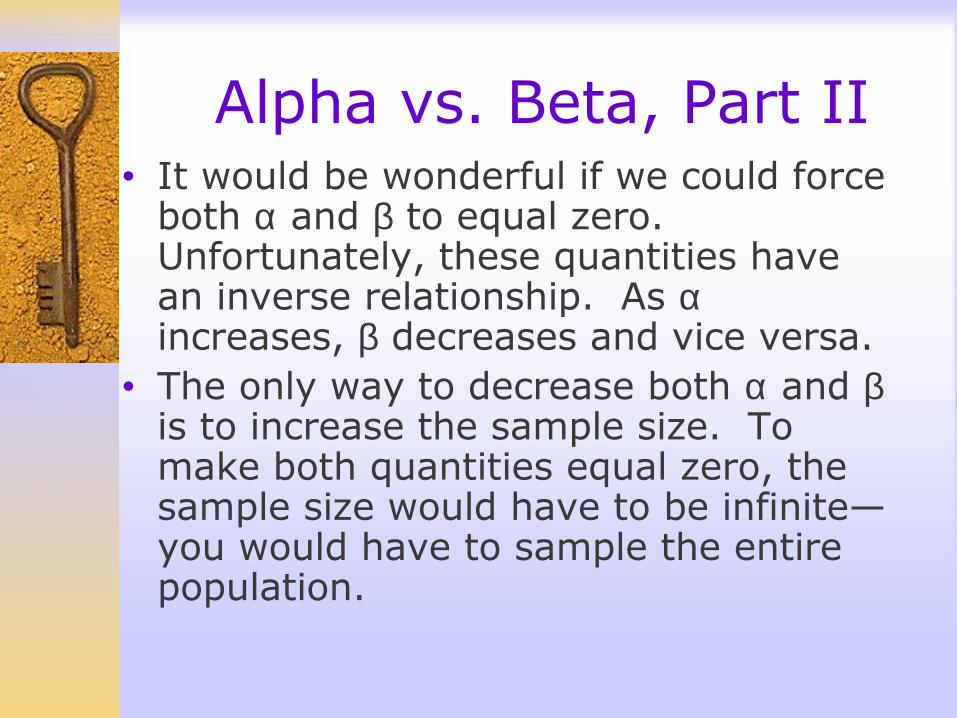
Alpha vs. Beta, Part II• It would be wonderful if we could force
both α and β to equal zero. Unfortunately, these quantities have an inverse relationship. As α increases, β decreases and vice versa.
• The only way to decrease both α and β is to increase the sample size. To make both quantities equal zero, the sample size would have to be infinite—you would have to sample the entire population.
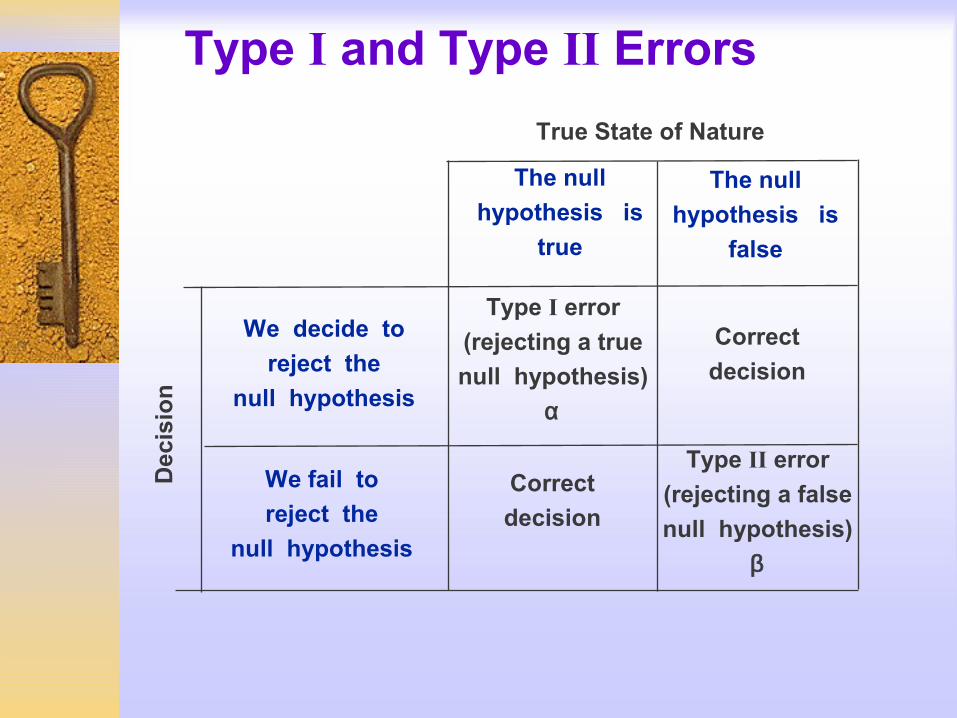
Type I and Type II Errors
True State of Nature
We decide to
reject the
null hypothesis
We fail to
reject the
null hypothesis
The null
hypothesis is
true
The null
hypothesis is
false
Type I error
(rejecting a true
null hypothesis)
α
Type II error
(rejecting a false
null hypothesis)
β
Correct
decision
Correct
decision
Dec
isio
n
Forming Conclusions
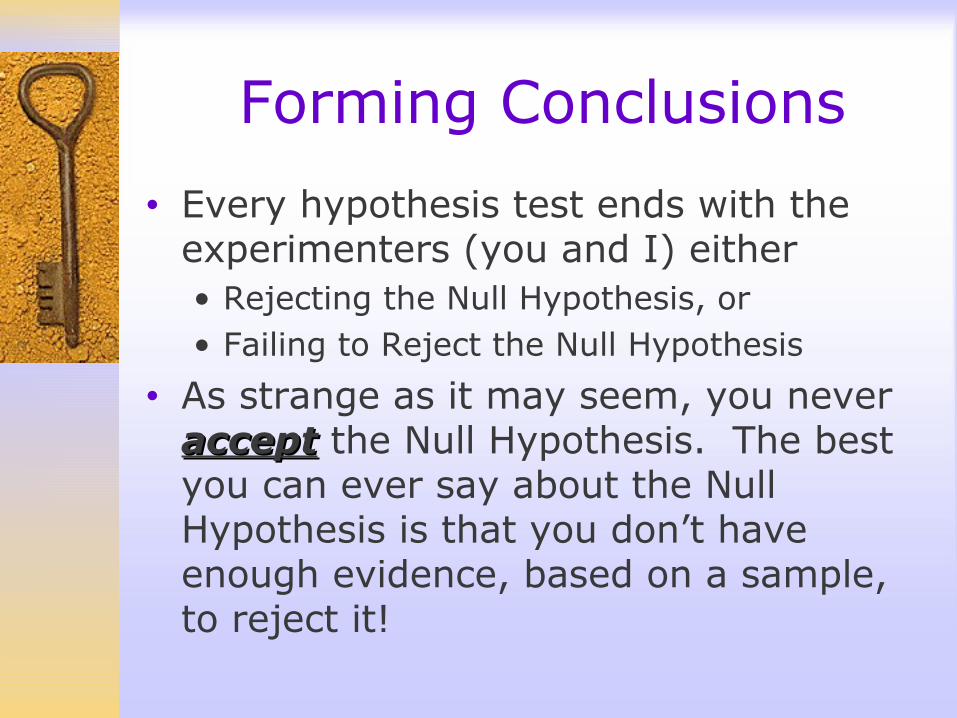
• Every hypothesis test ends with the experimenters (you and I) either• Rejecting the Null Hypothesis, or• Failing to Reject the Null Hypothesis
• As strange as it may seem, you never acceptaccept the Null Hypothesis. The best you can ever say about the Null Hypothesis is that you don’t have enough evidence, based on a sample, to reject it!
Seven Steps to Hypothesis Testing Happiness
(Traditional or Classical Method)
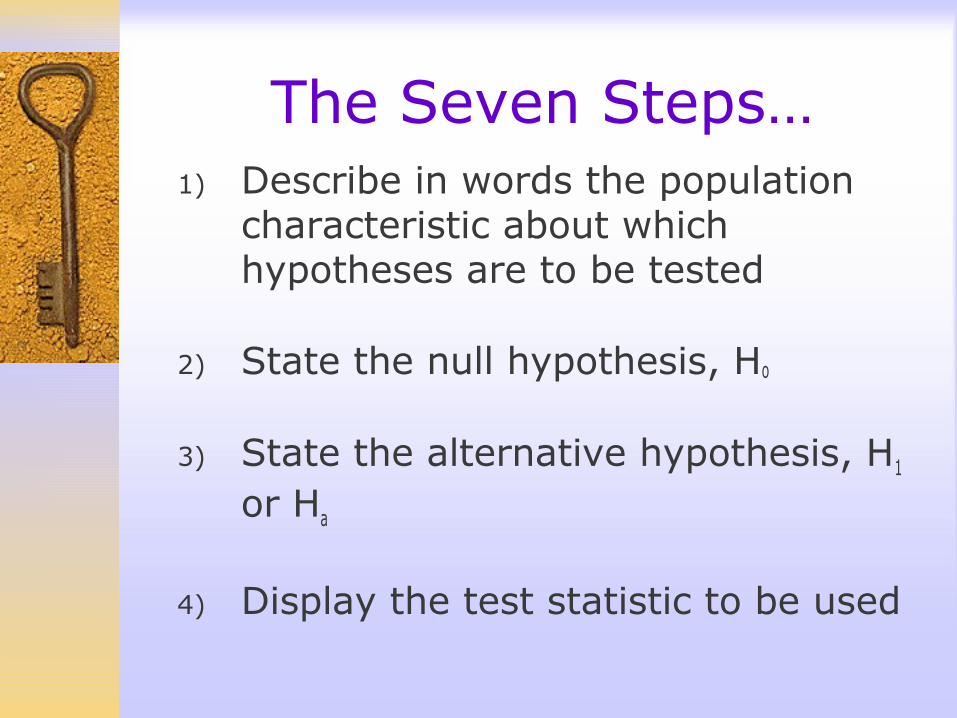
1) Describe in words the population characteristic about which hypotheses are to be tested
2) State the null hypothesis, Ho
3) State the alternative hypothesis, H1 or Ha
4) Display the test statistic to be used
The Seven Steps…
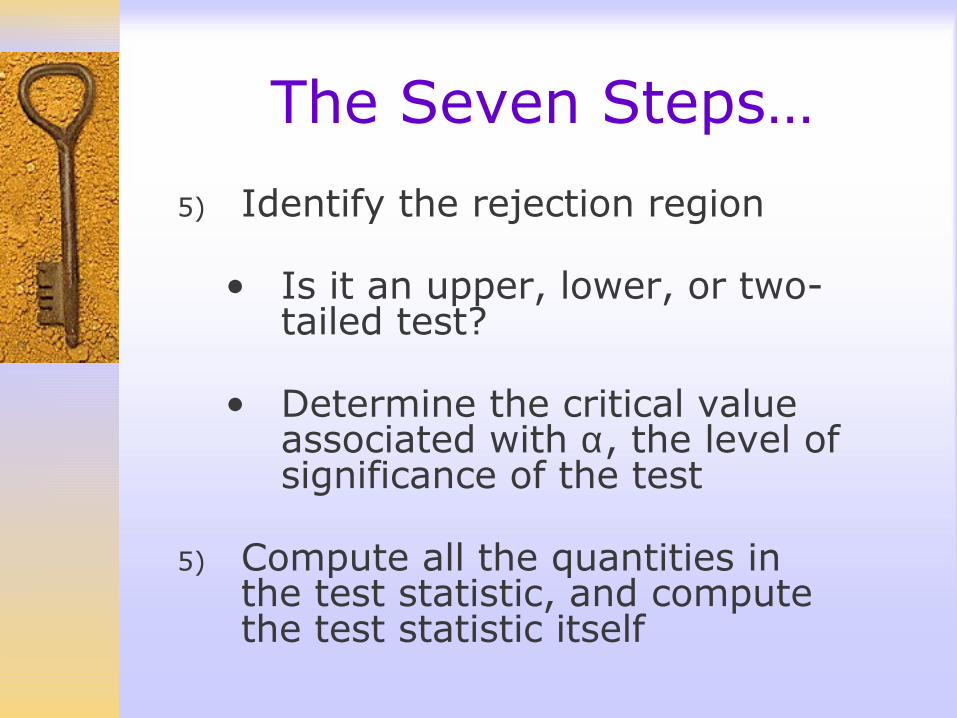
5) Identify the rejection region
• Is it an upper, lower, or two-tailed test?
• Determine the critical value associated with α, the level of significance of the test
5) Compute all the quantities in the test statistic, and compute the test statistic itself
The Seven Steps…
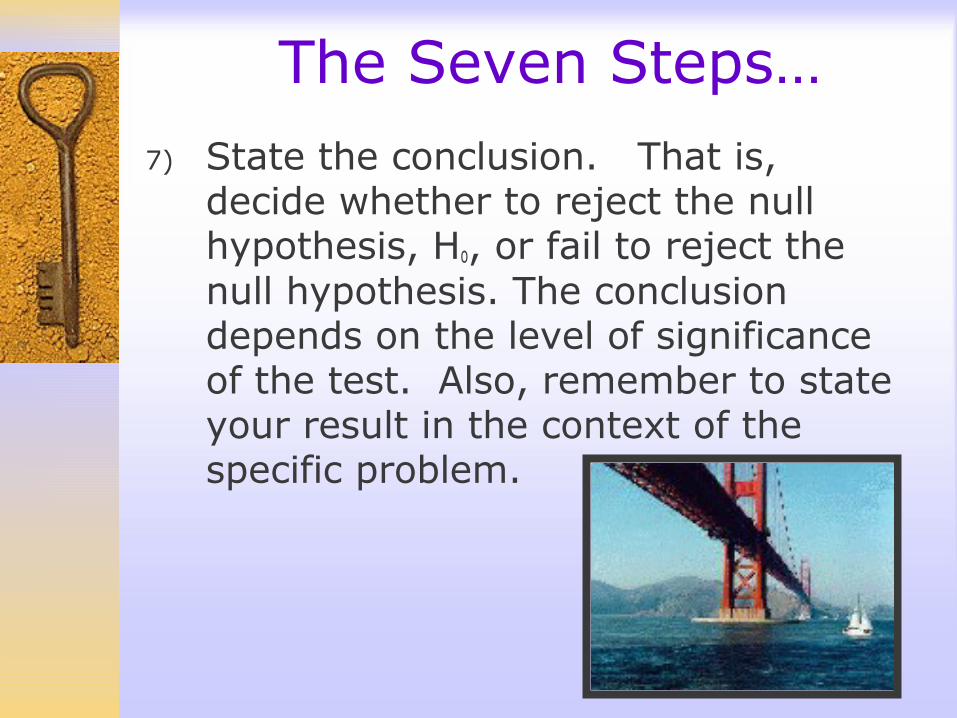
The Seven Steps…7) State the conclusion. That is,
decide whether to reject the null hypothesis, Ho, or fail to reject the null hypothesis. The conclusion depends on the level of significance of the test. Also, remember to state your result in the context of the specific problem.
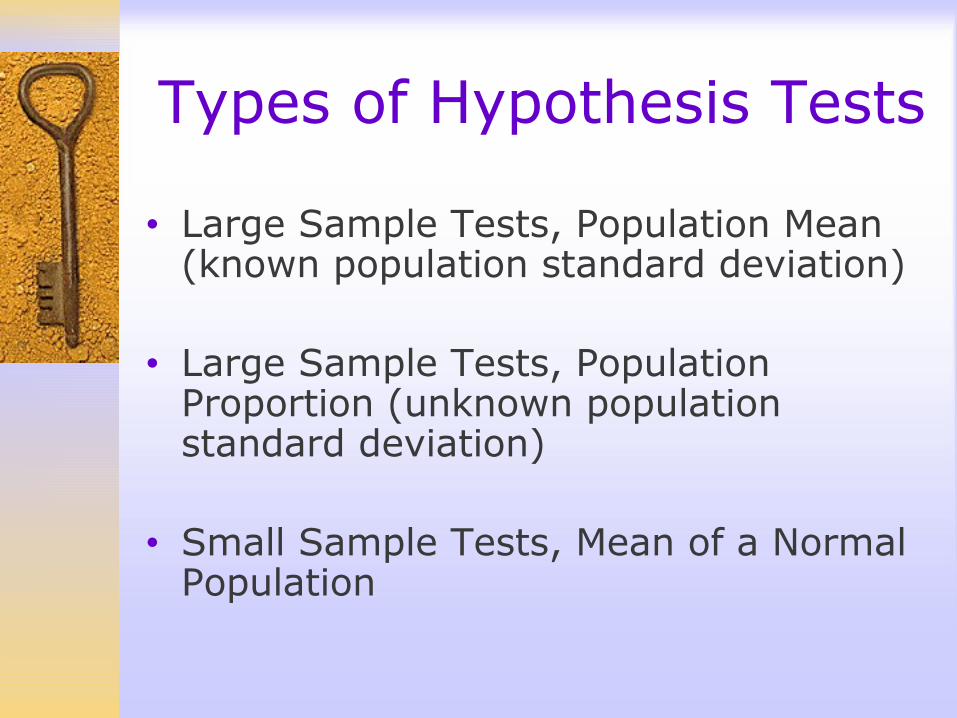
Types of Hypothesis Tests
• Large Sample Tests, Population Mean (known population standard deviation)
• Large Sample Tests, Population Proportion (unknown population standard deviation)
• Small Sample Tests, Mean of a Normal Population
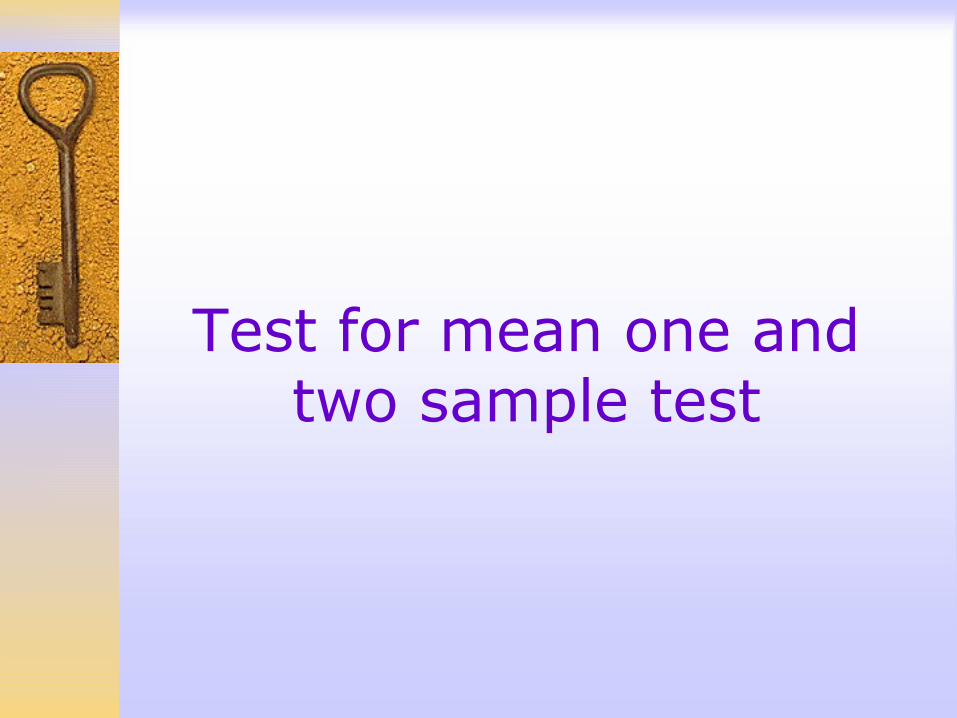
Test for mean one and two sample test
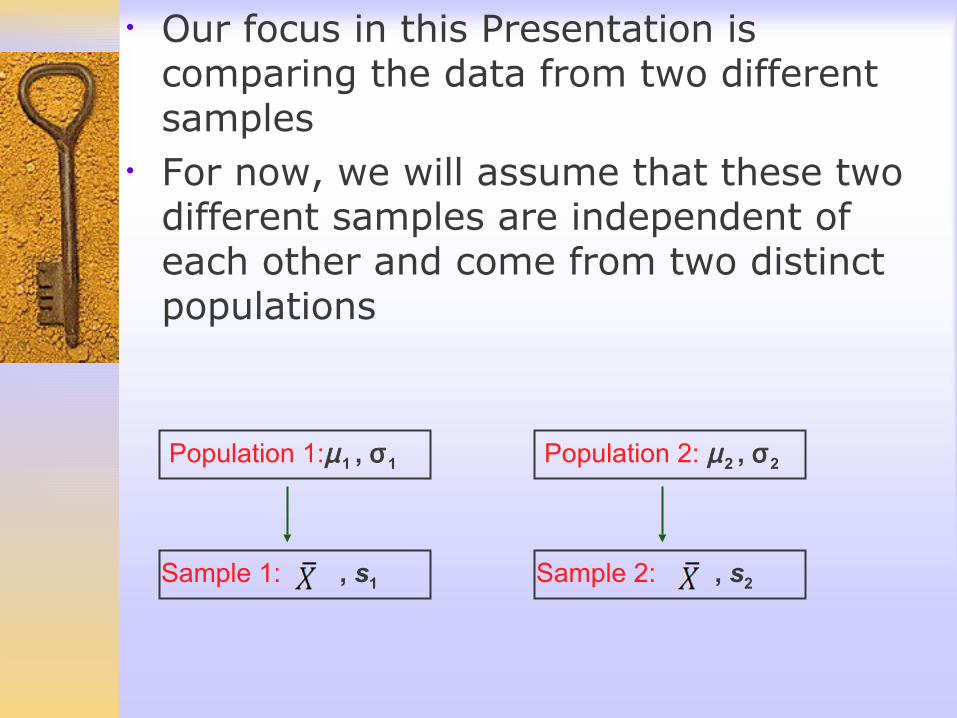
• Our focus in this Presentation is comparing the data from two different samples
• For now, we will assume that these two different samples are independent of each other and come from two distinct populations
Population 1:µ1 , σ1
Sample 1: , s1
Population 2: µ2 , σ2
Sample 2: , s2
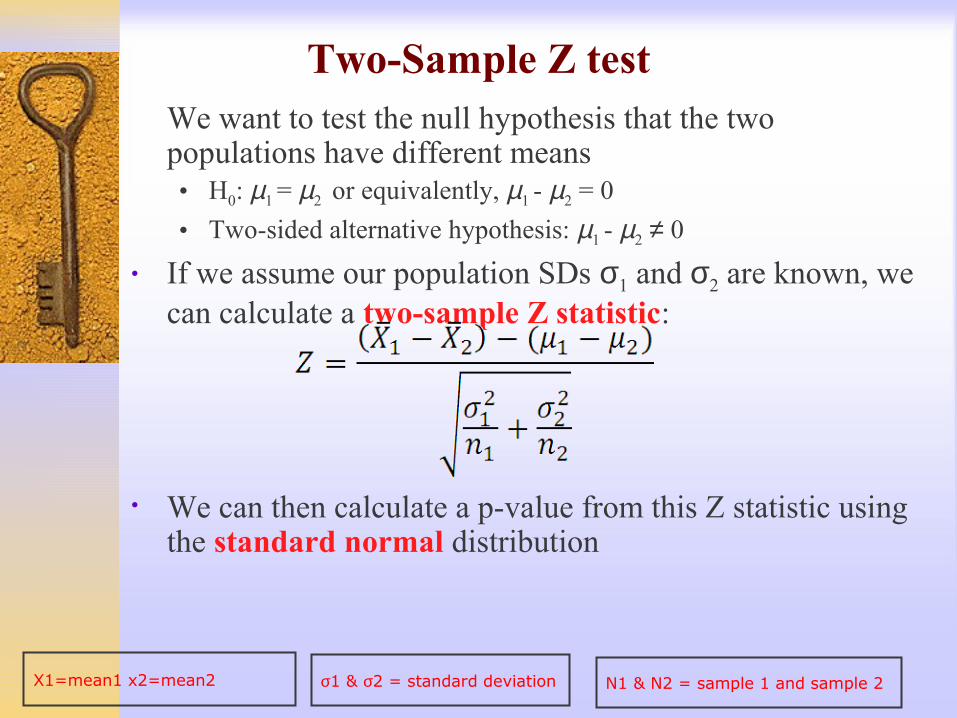
� We want to test the null hypothesis that the two populations have different means• H0: µ1 = µ2 or equivalently, µ1 - µ2 = 0
• Two-sided alternative hypothesis: µ1 - µ2 ≠ 0
• If we assume our population SDs σ1 and σ2 are known, we can calculate a two-sample Z statistic:
• We can then calculate a p-value from this Z statistic using the standard normal distribution
Two-Sample Z test
X1=mean1 x2=mean2 σ1 & σ2 = standard deviation N1 & N2 = sample 1 and sample 2
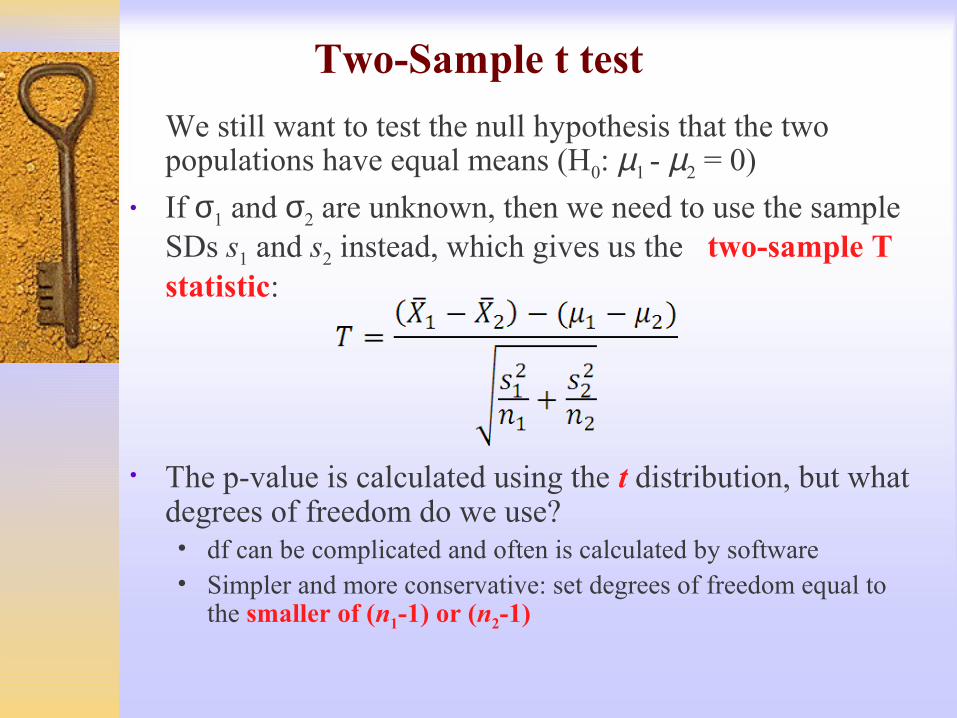
� We still want to test the null hypothesis that the two populations have equal means (H0: µ1 - µ2 = 0)
• If σ1 and σ2 are unknown, then we need to use the sample SDs s1 and s2 instead, which gives us the two-sample T statistic:
• The p-value is calculated using the t distribution, but what degrees of freedom do we use? • df can be complicated and often is calculated by software• Simpler and more conservative: set degrees of freedom equal to
the smaller of (n1-1) or (n2-1)
Two-Sample t test


The End
Actually, it’s just the beginning...