Embed Size (px)
Citation preview

1 2012 TeensTALK® | © STAMATS 2012
Presented byEric Sickler
Associate Vice President for Client Services
[email protected](319) 431-5043(800) 553-8878
2012 TeensTALK® FindingsA Comprehensive Look at Teen Trends, Attitudes, Lifestyles, and Knowledge with Special Focus on College Search and Selection

2 2012 TeensTALK® | © STAMATS 2012
About Stamats
Research, Planning, and Consulting• Brand clarification and development• Image and perception studies • Tuition pricing elasticity and brand
value studies • Recruiting and marketing
assessments, plans, and counsel
Strategic Creative• Institutional, admission, and
advancement web sites• Mobile and social media solutions • Recruiting and advancement
campaigns and publications• Virtual and experiential tours• Institutional identity • Advertising campaigns• TV, video, and radio
Stamats is recognized and respected as the nation’s higher education integrated marketing thought leader. Our comprehensive array of innovative products and services has set the standard for pairing insightful, research-based strategic counsel with compelling creative solutions.
Our approach is simple: recognize the unique needs and expectations of each client and draw on more than 50 years of higher education experience for every project we undertake.
At all times, we promise the highest level of professional service and attention to detail in the industry because, in the end, we know our success is measured entirely by the success of our clients.

3 2012 TeensTALK® | © STAMATS 2012

4 2012 TeensTALK® | © STAMATS 2012

5 2012 TeensTALK® | © STAMATS 2012

6 2012 TeensTALK® | © STAMATS 2012
Teen Types

7 2012 TeensTALK® | © STAMATS 2012
Teen Type #1 - TeacupsTeacup parenting has produced teacup kids who are extremely fragile and nuanced to their own discomforts or problems. They have a very difficult time handling criticism or rejection and tend to fear anything in which they might not succeed. When they get to jobs, college, or difficult high school classes they tend to break down or need huge amounts of outside support.Teen Type #2 - ToastiesThese kids were heavily overloaded starting from a very young age. Dance class, violin class, band, volleyball, college entrance exam prep courses…you name it and they were doing it. They worked so hard from such a young age, they never really had time to play. And as they get older, they become more and more burnt-out. They tend to pick jobs and careers that sound or pay great, but have no idea what their true passions are. They feel exhausted most of their lives.
Source: www.radicalparenting.com; Vanessa Van Petten is a CNN columnist, winner of the Mom’s Choice Award and an author with Penguin Books.
Vanessa Van Petten

8 2012 TeensTALK® | © STAMATS 2012
Teen Type #3 - TurtlesThese are kids who assume “everything will all work out just fine.” They invest very little of themselves, and just hope for the best. They do the least that is required of them and shirk all kinds of discomfort or responsibility by pulling into their personal shells. They tend to be lazy, apathetic, and passionless…unless, of course, it has something to do with their video games.Teen Type #4 - TyrantsParents have spent a lifetime telling them they’re special and their poo smells like roses. They want the best, they expect the best, and they are going to get the best. They tend to be very aggressive and assume they are the center of everyone’s attention and their names are on the tips of everyone’s tongues. They are willing to work a little, but fully expect to see big rewards and be generously congratulated on their hard work.
Source: www.radicalparenting.com; Vanessa Van Petten is a CNN columnist, winner of the Mom’s Choice Award and an author with Penguin Books.
Vanessa Van Petten
9 2012 TeensTALK® | © STAMATS 2012
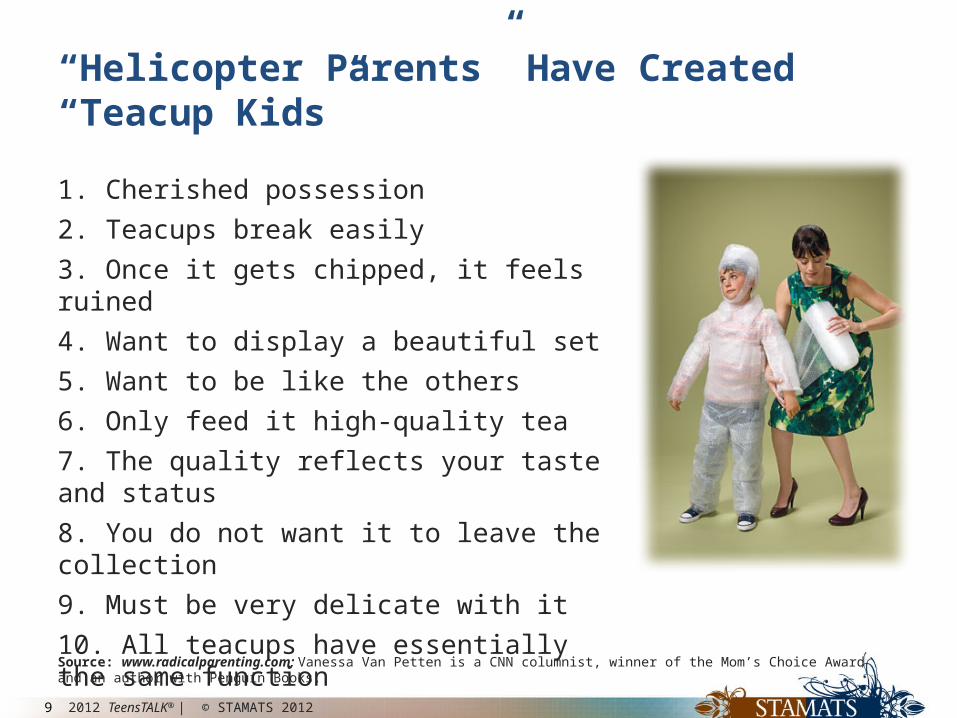
“Helicopter Parents” Have Created “Teacup Kids”
1. Cherished possession2. Teacups break easily3. Once it gets chipped, it feels ruined4. Want to display a beautiful set5. Want to be like the others6. Only feed it high-quality tea7. The quality reflects your taste and status8. You do not want it to leave the collection9. Must be very delicate with it10. All teacups have essentially the same function
Source: www.radicalparenting.com; Vanessa Van Petten is a CNN columnist, winner of the Mom’s Choice Award and an author with Penguin Books.
10 2012 TeensTALK® | © STAMATS 2012
2012 Teen Snapshot

11 2012 TeensTALK® | © STAMATS 2012
2012 Teen Snapshot• Teens carry $30 and have $742.70 in their bank and savings accounts• They primarily get money by asking their parents (51%), via an
allowance (29%), from gifts (43%), and from a job (30%) (Source: C&R Research)
• They are most likely to spend their money on eating out (25%), snacks (23%), beverages (21%), and candy (14%) (Source: C&R Research)
• Teens are a prized demographic for marketers: they have more autonomy over their purchases than tweens, yet also don’t have the full responsibilities (e.g. auto insurance or transportation, meals) as their older counterparts (Source: C&R Research)
• During the summer months, teens split their time between work, the mall, camp, and gathering around bodies of water (Source: C&R Research)
• Teens’ favorite brands showcase their priorities: Reese’s Peanut Butter Cups, iPod, Google, M&M’s, and Oreo’s are teens’ most loved brands, followed by Subway, Hershey’s Milk Chocolate, Target, Sprite, and Microsoft (Source: Harris Interactive)

12 2012 TeensTALK® | © STAMATS 2012
2012 Teen Snapshot• American Eagle is teens’ top clothing brand, followed by Forever 21,
Aeropostale, Hollister, and Levi’s (Source: C&R Research)
• Three in four teens discuss media or entertainment brands at least once a day (Source: Keller Fay)
• Teens are receptive to most forms of advertising; 70% recall they saw a digital video display in the past month (Source: Arbitron, Edison Research)
• Teens’ friends wield the most influence over their preferences and purchases
• Influential teens exist in every single peer group and are perceived by their friends as “on top of trends and able to sway opinions”
• Influential teens also tend to have older siblings, middle- to upper-class backgrounds, and are attractive
• The key to reaching the cool kids is similar to dating: desperation and trying too hard are ultimate turnoffs, while being aloof and mysterious are attractive
13 2012 TeensTALK® | © STAMATS 2012
2012 Teen Snapshot• Teens have pretty regular routines regarding their daily activities and
behaviors• They spend nearly 10 hours a day sleeping and three hours engaged in
educational activities (Source: Bureau of Labor Statistics)
• Boys spend one more hour a day on leisure and sports activities, while girls spend 12 more minutes eating (Source: Bureau of Labor Statistics)
• Among those able to join the workforce, girls are most likely working as camp counselors or babysitters, while boys work as day laborers or landscapers (Source: C&R Research)
• About 40% of teens spend 3 to 6 hours a day online, mostly visiting:– Facebook (41%)– Flickr (34%)– YouTube (31%)– Google (25%) and – Twitter (21%) (Source: Buzz Marketing)
14 2012 TeensTALK® | © STAMATS 2012
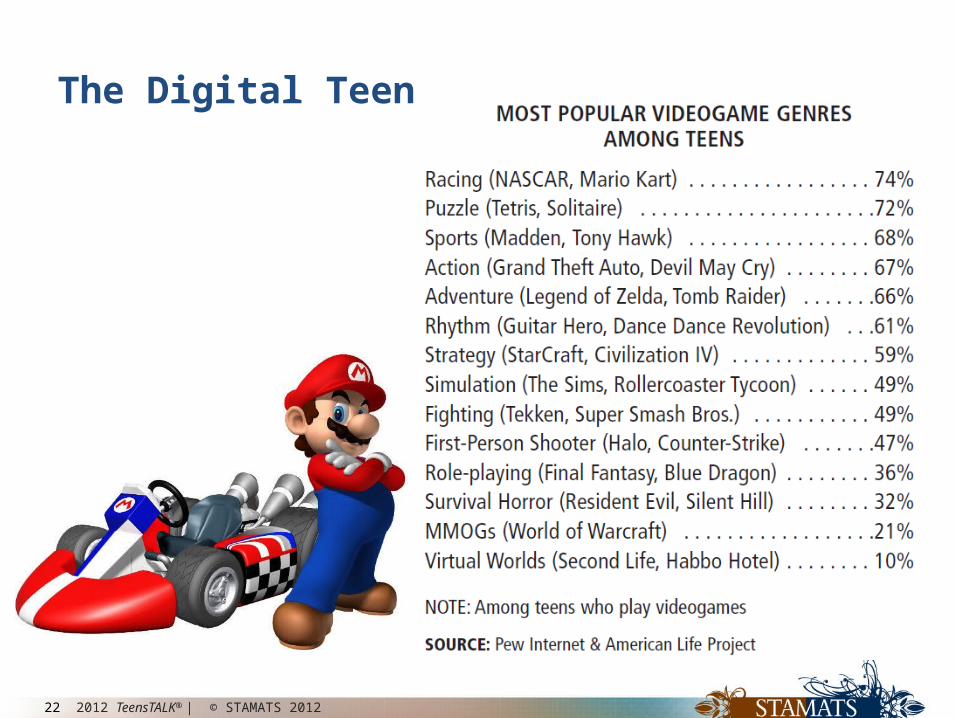
2012 Teen Snapshot• Teens routinely watch online video and play video games, usually those
having to do with racing• Nearly all teens have cell phones, with 38% claiming they will upgrade
to an iPhone within the next six months (Source: Piper Jaffray)
• They send 3,339 text messages a month (Source 5 Nielsen, AOL)
• 58% send text messages while on the toilet (Source: TextPlus)
• There’s little to suggest teens are getting bored with Facebook; they continue to post, update, and check the social network every day
• Among their average 500 Facebook friends, however, there’s one teens wish they didn’t have…
29% wish they could “unfriend” their parent (Source: Nielsen)

15 2012 TeensTALK® | © STAMATS 2012
Teens By The Numbers
16 2012 TeensTALK® | © STAMATS 2012
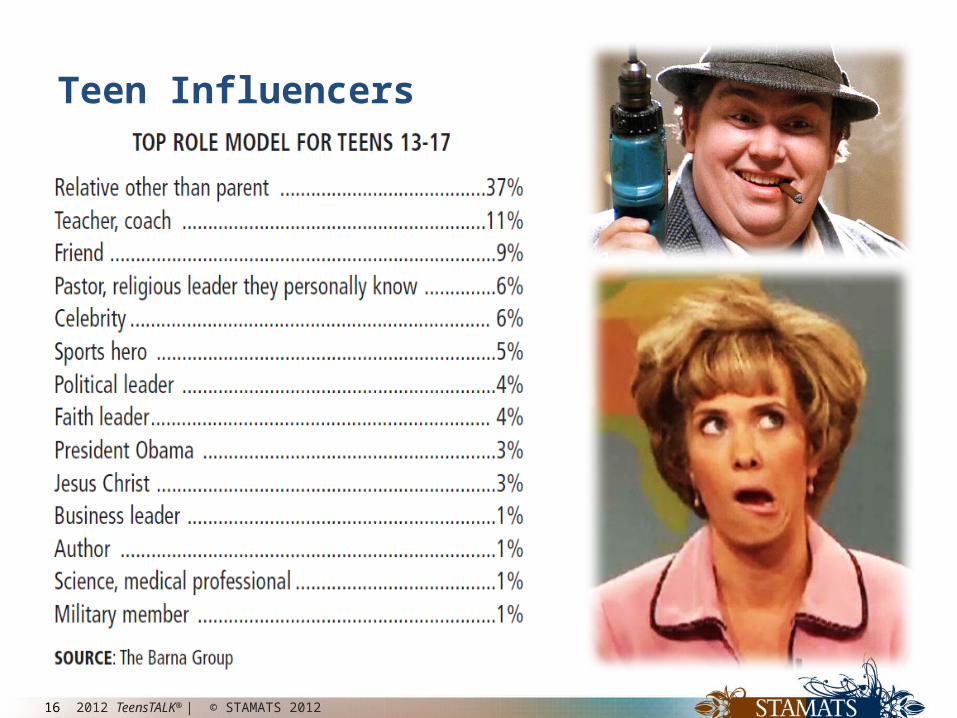
Teen Influencers

17 2012 TeensTALK® | © STAMATS 2012
Teen Media Habits

18 2012 TeensTALK® | © STAMATS 2012
Teen Media Habits

19 2012 TeensTALK® | © STAMATS 2012
Teen Media Habits
20 2012 TeensTALK® | © STAMATS 2012
The Digital Teen

21 2012 TeensTALK® | © STAMATS 2012
The Digital Teen
22 2012 TeensTALK® | © STAMATS 2012
The Digital Teen

23 2012 TeensTALK® | © STAMATS 2012
The Digital Teen

24 2012 TeensTALK® | © STAMATS 2012
Teen Saving and Spending

25 2012 TeensTALK® | © STAMATS 2012
Despite some early signs of improvement in the economy, college-bound high school students still report high levels of concern about the U.S. economy Source: 2011 College Decision Impact Survey | March 2011 | Maguire Associates & Fastweb
Teen Saving and Spending

26 2012 TeensTALK® | © STAMATS 2012
Teen Saving and Spending

27 2012 TeensTALK® | © STAMATS 2012
Teen Saving and Spending
Source: C&R Research

28 2012 TeensTALK® | © STAMATS 2012Source: C&R Research

29 2012 TeensTALK® | © STAMATS 2012Source: C&R Research

30 2012 TeensTALK® | © STAMATS 2012
Teen Saving and Spending

31 2012 TeensTALK® | © STAMATS 2012
Teen Brand Loyalties

32 2012 TeensTALK® | © STAMATS 2012
Teen Brand Loyalties

33 2012 TeensTALK® | © STAMATS 2012
Teen Brand Loyalties68% of 15- to 17-year-olds receive at least one permission-based email a day compared to 95% of 18- to 24-year-olds who receive at least one such email daily
32% of teens are fans of at least one company on Facebook, but only 3% ofteens with a Twitter account follow at least one brand via Twitter

34 2012 TeensTALK® | © STAMATS 2012
College Search

35 2012 TeensTALK® | © STAMATS 2012
2012 TeensTALK® Methodology
• A nationwide telephone survey of 496 high school seniors who will attend college as first-time, first-year students in fall 2012. Based on the national population of college-bound fall 2012 first-time freshmen, the margin of error is plus or minus 4.4% at the 95% confidence level
– Data collected in February 2012– Sampling at random (probability sample) to provide a rigorous data set for
accurate assessment of the college-selection process• Main topics covered in this survey:
1. Profile of institutions considered and preferred2. Number of admission applications submitted3. Absolute and relative importance of specific factors impacting the college-
selection decision4. Acceptable and preferred communication channels5. Involvement and relative influence of others in college-selection6. The use of—and expectations for—smartphones and mobile devices in the
college search process

36 2012 TeensTALK® | © STAMATS 2012
• Surveys completed in Hawaii and Alaska as well
Distribution of 2012 TeensTALK® Respondents

37 2012 TeensTALK® | © STAMATS 2012
2012 TeensTALK® Demographics – Gender and Race
Base: All 2012 TeensTALK® respondents (n=496)
Asian; 8%African Ameri-
can; 12%
Two or more races; 18%
White / Caucasian
62%Female;
55%
Male; 45%
Other %
American Indian 1%
Pacific Islander 1%
Hispanic 4%
38 2012 TeensTALK® | © STAMATS 2012
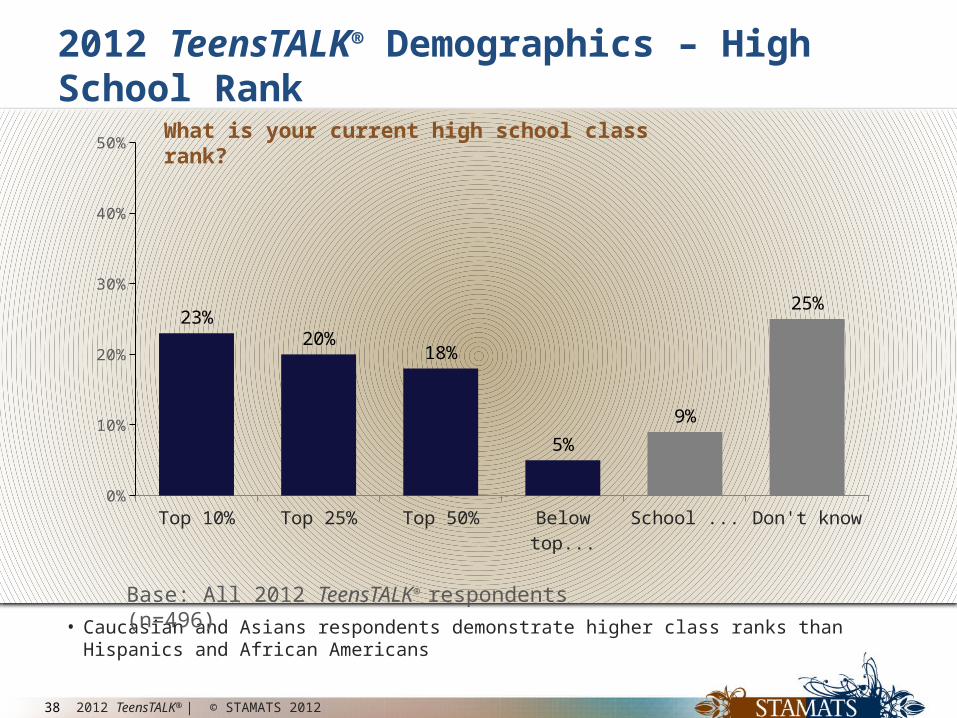
• Caucasian and Asians respondents demonstrate higher class ranks than Hispanics and African Americans
2012 TeensTALK® Demographics – High School Rank
Base: All 2012 TeensTALK® respondents (n=496)
Top 10% Top 25% Top 50% Below top 50% School does not provide
rank
Don't know0%
10%
20%
30%
40%
50%
23%20%
18%
5%9%
25%
What is your current high school class rank?

39 2012 TeensTALK® | © STAMATS 2012
2012 TeensTALK® Demographics – SAT Exam
Base: All 2012 TeensTALK® respondents (n=496)
Took SAT; 55%
Did not take SAT; 45%
1000 or less 1001 to 1150
1151 to 1300
1301 to 1450
1451+0%
20%
40%
60%
80%
100%
20% 20%27%
18% 15%
Percent of Respondents with SAT score of:
Mean Score: 1179Median Score: 1210
Note: Respondents who gave ‘0’ as their SAT score have been excluded from the above calculation. (n=212)
Have you taken the SAT? What was your combined math and critical reading score on the SAT?
• Caucasian, Asian, and Hispanic respondents score significantly higher than African Americans
40 2012 TeensTALK® | © STAMATS 2012
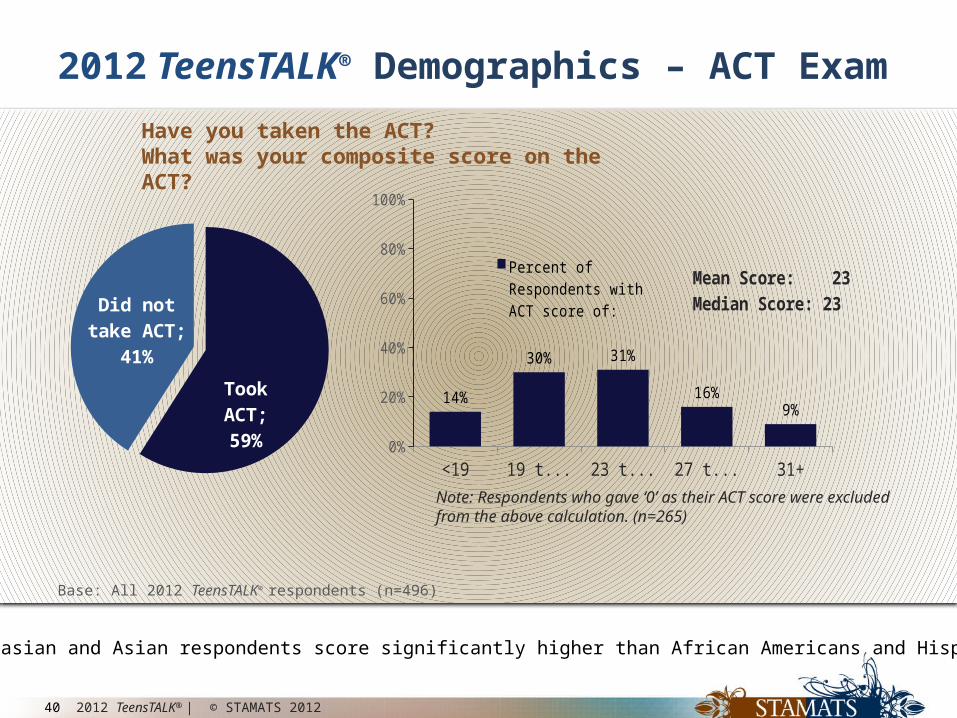
2012 TeensTALK® Demographics – ACT Exam
Base: All 2012 TeensTALK® respondents (n=496)
Took ACT; 59%
Did not take ACT; 41%
<19 19 to 22 23 to 26 27 to 30 31+0%
20%
40%
60%
80%
100%
14%
30% 31%
16%9%
Percent of Respondents with ACT score of:
Mean Score: 23Median Score: 23
Note: Respondents who gave ‘0’ as their ACT score were excluded from the above calculation. (n=265)
Have you taken the ACT? What was your composite score on the ACT?
• Caucasian and Asian respondents score significantly higher than African Americans and Hispanics
41 2012 TeensTALK® | © STAMATS 2012
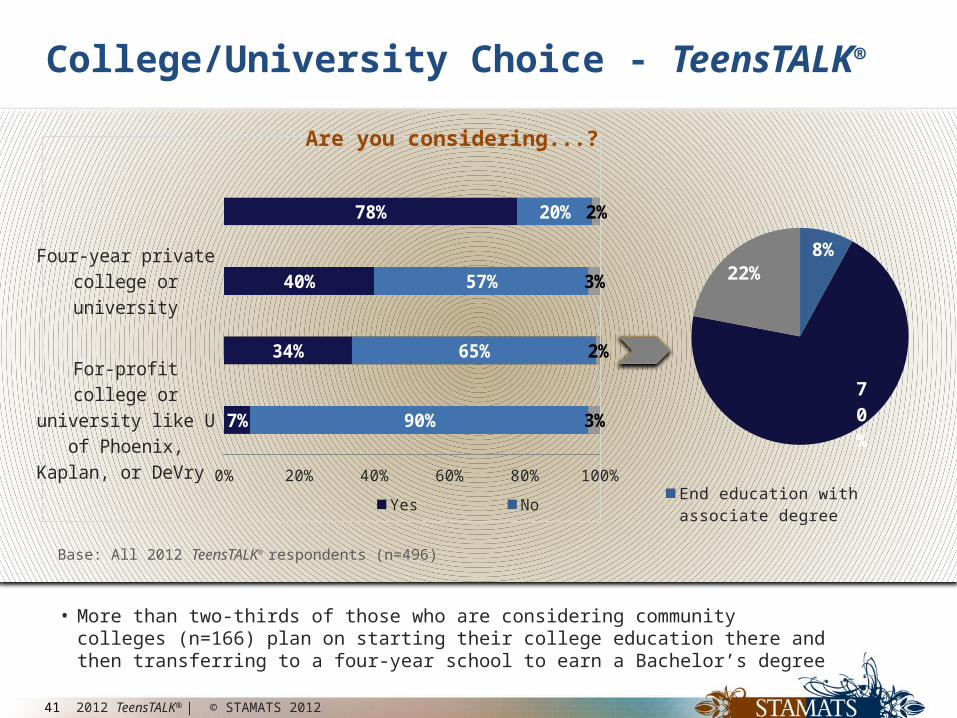
For-profit college or university like U of Phoenix, Kaplan, or DeVry
Community or technical college
Four-year private college or university
Four-year public college or university
0% 20% 40% 60% 80% 100%
7%
34%
40%
78%
90%
65%
57%
20%
3%
2%
3%
2%
Yes No Don't know
College/University Choice - TeensTALK®
Are you considering...?
• More than two-thirds of those who are considering community colleges (n=166) plan on starting their college education there and then transferring to a four-year school to earn a Bachelor’s degree
8%
70%
22%
End education with associate degreeStart college career and transfer laterDon't know
Base: All 2012 TeensTALK® respondents (n=496)
42 2012 TeensTALK® | © STAMATS 2012
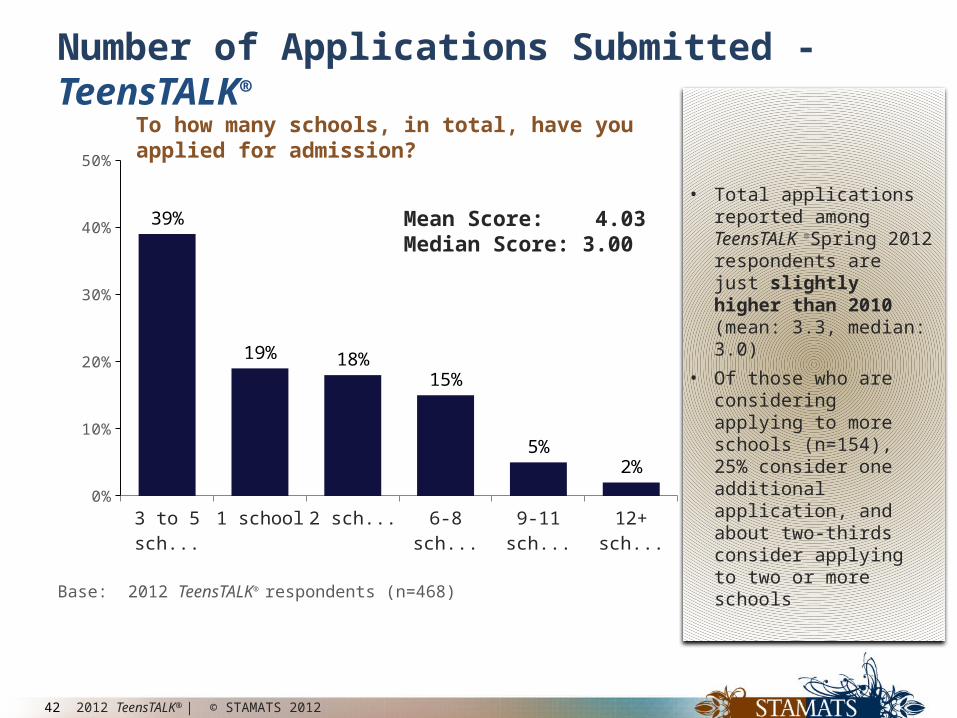
Number of Applications Submitted - TeensTALK®
• Total applications reported among TeensTALK ®Spring 2012 respondents are just slightly higher than 2010 (mean: 3.3, median: 3.0)
• Of those who are considering applying to more schools (n=154), 25% consider one additional application, and about two-thirds consider applying to two or more schools
Base: 2012 TeensTALK® respondents (n=468)
3 to 5 schools
1 school 2 schools 6-8 schools 9-11 schools
12+ schools
0%
10%
20%
30%
40%
50%
39%
19% 18%15%
5%2%
To how many schools, in total, have you applied for admission?
Mean Score: 4.03Median Score: 3.00

43 2012 TeensTALK® | © STAMATS 2012
• Majority report that economic concerns do influence their college application strategies
Source: 2011 College Decision Impact Survey | March 2011 | Maguire Associates & Fastweb
Teen College/University Application Influences

44 2012 TeensTALK® | © STAMATS 2012
Source: 2012 Noel-Levitz E-Expectations Trend Report: The Communication Expectations of College-Bound High School. Of the 1,307 respondents, 58% were high school seniors and 14% juniors, while 27% of the responses came from their parents or guardians. One percent of participants did not report their status.
Teen College/University Application Influences

45 2012 TeensTALK® | © STAMATS 2012
• Females tend to choose public schools more often than males• Hispanic respondents tend choose 2-year schools at a significantly higher rate than other populations • There is no clear preference for a specific size of college or university
Top-Choice School Description - TeensTALK®
Base: 2012 TeensTALK® respondents (n=496)
Made final decision 51% 49%
Two-year Four-year
19%
81%
Under 5,000 students
5,000 to 14,999
students
15,000 or more
31%
39%
30%
Public Private
72%
28%
Program length School typeSchool size

46 2012 TeensTALK® | © STAMATS 2012
Made official, on-campus visit
Applied for admission to this school
Will live on campus
Officially admitted to this school
0% 20% 40% 60% 80% 100%
57%
85%
66%
74%
Top-Choice School Description - TeensTALK® (continued)
• Compared to spring 2010, more students have been officially admitted to their top-choice schools (74% vs. 56% in spring 2010)
• However, fewer have made personal visits to their first-choice campuses (57% vs. 73% in spring 2010)
Base: All 2012 TeensTALK® respondents (n=496)

47 2012 TeensTALK® | © STAMATS 2012
1 to 30 miles 31 to 60 miles
61 to 120 miles
121 to 500 miles
500+ miles0%
20%
40%
60%
80%
100%
40%
12% 15%20%
13%
Top-Choice School Description - TeensTALK® (continued)
• Distance-from-home preference is generally similar to those suggested by Spring 2010 respondents
• However, somewhat higher percentages of students would prefer a smaller travel range:
1 - 30 miles: 40% vs. 36% in spring 2010121 - 500 miles: 20% vs. 28% in spring 2010
Base: All 2012 TeensTALK® respondents (n=496)
Distance to Current Top-Choice Campus from Home
Mean Score: 204 mi

48 2012 TeensTALK® | © STAMATS 2012
Did not have a preferred option
Had a preferred college/university, but considered alternatives
Known for years which college/university wanted to attend
0% 20% 40% 60% 80% 100%
45%
37%
18%
College-Selection Process - TeensTALK®
• 2012 findings differ from Spring 2010, when 49% of respondents reported having a preferred option
• In 2010, 31% of respondents knew exactly what college/university they wanted to attend
Which of the following statements best describes you and your college-selection process?
Base: All 2012 TeensTALK® respondents (n=496)
20% in 2010
49% in 2010
31% in 2010
49 2012 TeensTALK® | © STAMATS 2012
Students’ college priorities have remained stable despite any concerns about the economySource: 2011 College Decision Impact Survey | March 2011 | Maguire Associates & Fastweb
Teen College Consideration Priorities
High school seniors continue to place the greatest importance on “value of education” as well as:
• Quality of major and students
• Career-oriented coursework/majors and future employment opportunities
• Total costs and the availability of merit- or need-based financial aid
• Academic facilities
• Campus atmosphere
• Personal attention
• Preparation for graduate/professional school

50 2012 TeensTALK® | © STAMATS 2012
• Two years ago, 47% said they would make their final college choice without help (versus 64% in 2012)• Those who seek help from others, rely on parents’ opinions more than on advice from other sources
Final Selection of College/University - TeensTALK®
Parents HS guid-ance coun-selor
Relative other than
parents
HS teacher
HS friend College admis-
sion coun-selor
Broth-ers/ Sis-
ters
HS coach
3.7
2.6 2.4 2.3 2.3 2.3 2.11.8
Base: 2012 TeensTALK® respondents (n=496)
36%
64%
Others were in-volved
Made final decision on my own
Did you, or will you, involve anyone else in your final college choice, or will you make that decision entirely on your own?For each of the following, indicate how much, if at all, they were (or will be) involved in helping you reach a final decision. (1 - no involvement, 4 - very involved)

51 2012 TeensTALK® | © STAMATS 2012
Factors Impacting Final College Choice - TeensTALK®
Which factor is most important to you? N= 496Quality of my preferred major or field of study
Graduates get good jobs Graduates are accepted into good graduate programs/schools *
Total cost of attending Net cost after financial aid, scholarships, etc., are deducted
Quality of faculty as teachers and mentorsFeels like a good fit for you
Overall academic reputationQuality of academic facilities
Safety of the campus Study abroad opportunities
The city or community where campus is located Variety of on-campus activities
Distance between campus and homeQuality of campus amenities
College or university is widely recognized Variety of off-campus activities
My family or friends have a connection to the school Appearance of the campus
The school has a religious or denominational affiliation
0% 10% 20% 30% 40% 50%
16.2%13.0%
11.1%9.9%9.5%
7.2%6.2%
5.4%4.5%
2.4%2.3%1.9%1.8%1.7%1.7%1.5%1.0%1.0%1.0%0.8%
MAX DIFF
*Full text:Graduates are accepted into good graduate programs/ schools to pursue master’s degrees, doctoral degrees, or highly specialized professional training like law school or medical school
• Two years ago, graduates get good jobs (17%), quality of preferred major (15%), net cost after aid (13%), and feels like a good fit (10%) were top importance factors, followed by total cost of attending scored (8%)

52 2012 TeensTALK® | © STAMATS 2012
Source: 2012 Noel-Levitz E-Expectations Trend Report: The Communication Expectations of College-Bound High School. Of the 1,307 respondents, 58% were high school seniors and 14% juniors, while 27% of the responses came from their parents or guardians. One percent of participants did not report their status.
Teens Want Live College-Search Conversations

53 2012 TeensTALK® | © STAMATS 2012
Personal visits to your home
Contacting you through Facebook
Text messages to your cell phone
Phone calls to your parent(s)
Sending mass, non-personalized emails
Personal visits to your high school
Phone calls to you
Sending you a personal email
Sending you publications through the mail
Sending you personalized letters through the mail
0% 10% 20% 30% 40% 50% 60% 70% 80% 90% 100%
34%
39%
39%
65%
67%
77%
85%
91%
92%
97%
19%
32%
22%
36%
50%
77%
73%
95%
88%
96%
Acceptable Communication Tactics - TeensTALK® For colleges to which you’ve applied for admission, do you feel it is acceptable for the college to contact you by…? (N=496). Multiple response allowed.
• Notable increases in the acceptability of phone calls, non-personalized emails, text messaging, Facebook, and personal home visits
Base: All 2012 TeensTALK® respondents (n=496)
20102012
54 2012 TeensTALK® | © STAMATS 2012
Personal visits to your home
Contacting you through Facebook
Phone calls to your parent(s)
Sending mass, non-personalized emails
Text messages to your cell phone
Personal visits to your high school
Sending you publications through the mail
Phone calls to you
Sending you a personal email
Sending you personalized letters through the mail
0% 5% 10% 15% 20% 25% 30% 35% 40% 45% 50%
1%
1%
2%
3%
4%
5%
14%
29%
39%
2%
0%
1%
2%
1%
5%
3%
12%
38%
36%20102012
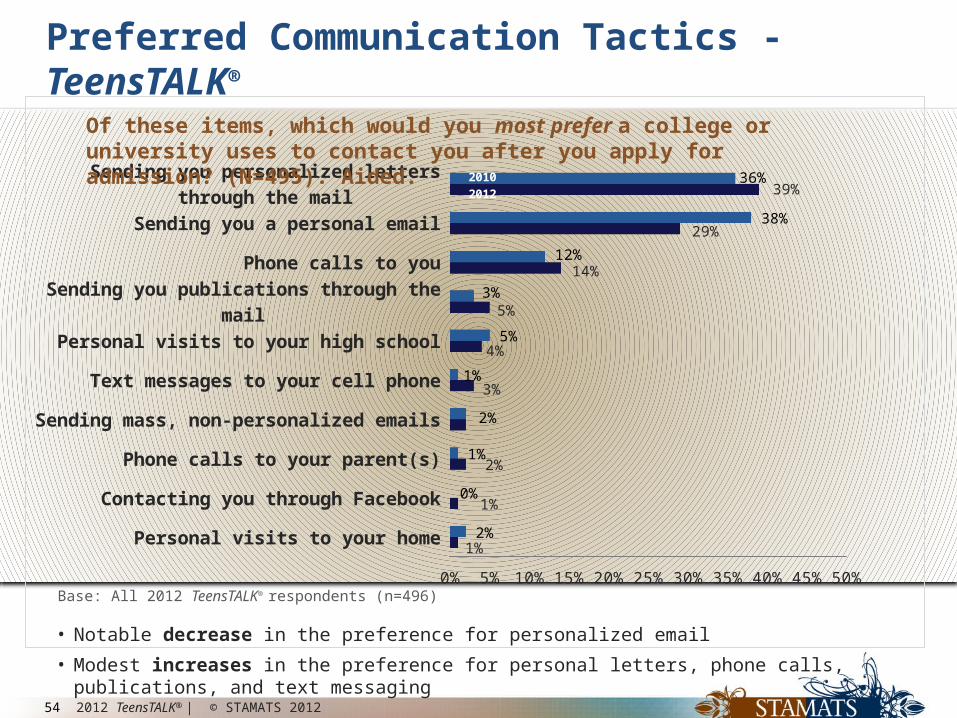
Preferred Communication Tactics - TeensTALK®
Of these items, which would you most prefer a college or university uses to contact you after you apply for admission? (N=495). Aided.
Base: All 2012 TeensTALK® respondents (n=496)• Notable decrease in the preference for personalized email• Modest increases in the preference for personal letters, phone calls, publications, and text messaging
55 2012 TeensTALK® | © STAMATS 2012
The Digital Teen and College Search

56 2012 TeensTALK® | © STAMATS 2012
Use of Mobile Devices - TeensTALK®
Mobile user (n=256) profile:• Male 56%• White 56%• Choose four-year public
schools 68%• Choose to live on
campus 76%• Similarly split among top
10%, top 25%, and top 50% in their graduating classes
• Average ACT score of 21• Average SAT score of
912Base: 2012 TeensTALK® respondents (n=496)
Very likely Somewhat likely
Somewhat un-likely
Not at all likely0%
10%
20%
30%
40%
50%
27% 25%
9%
40%
When seeking information about a college, how likely is it that you're using your smartphone or mobile device, like an iPad, to do so? Aided. Single response.

57 2012 TeensTALK® | © STAMATS 2012
Other
Housing information
Athletic program information
Contact information
Admission standards
Financial aid information
Cost information
Academic program information
0% 20% 40%
10%
6%
7%
8%
10%
12%
19%
25%
College Information On Mobile Devices - TeensTALK®
What information about a college is important to you to be able to easily find and view on a smartphone or mobile device? (N=256). Multiple response allowed.
• Information preferences generally mirror college selection factor importance ratings, with the exception of placement/outcomes evidence
Other Number
Location 6College / class size 5College activities 5Application status 5Student / teacher ratio 3Reviews / enrollment 2

58 2012 TeensTALK® | © STAMATS 2012
• Students who prefer private colleges or universities are generally more likely to have used digital channels/social media to communicate with schools
Source: 2011 College Decision Impact Survey | March 2011 | Maguire Associates & Fastweb
The Digital Teen and College Search

59 2012 TeensTALK® | © STAMATS 2012
Source: 2012 Noel-Levitz E-Expectations Trend Report: The Mobile Browsing Behaviors and Expectations of College-Bound High School Students. Findings from a survey of nearly 2,300 college-bound high school students regarding the use of devices to search for colleges. 94% said they use a mobile device (such as a cell phone, smartphone, or tablet) at least once per week.
The Digital Teen and College Search

60 2012 TeensTALK® | © STAMATS 2012
The Digital Teen and College Search
Source: 2012 Noel-Levitz E-Expectations Trend Report: The Mobile Browsing Behaviors and Expectations of College-Bound High School Students. Findings from a survey of nearly 2,300 college-bound high school students regarding the use of devices to search for colleges. 94% said they use a mobile device (such as a cell phone, smartphone, or tablet) at least once per week.

61 2012 TeensTALK® | © STAMATS 2012
The Digital Teen and College Search
Source: 2012 Noel-Levitz E-Expectations Trend Report: The Mobile Browsing Behaviors and Expectations of College-Bound High School Students. Findings from a survey of nearly 2,300 college-bound high school students regarding the use of devices to search for colleges. 94% said they use a mobile device (such as a cell phone, smartphone, or tablet) at least once per week.
62 2012 TeensTALK® | © STAMATS 2012
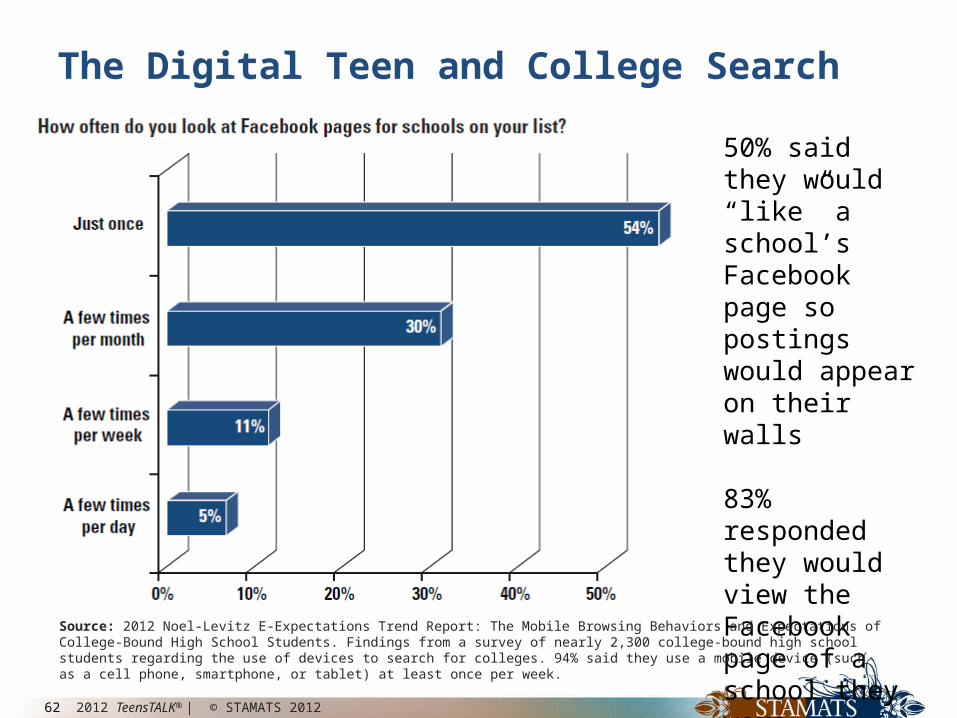
The Digital Teen and College Search
50% said they would “like” a school’s Facebook page so postings would appear on their walls
83% responded they would view the Facebook page of a school they were considering if given the chance
Source: 2012 Noel-Levitz E-Expectations Trend Report: The Mobile Browsing Behaviors and Expectations of College-Bound High School Students. Findings from a survey of nearly 2,300 college-bound high school students regarding the use of devices to search for colleges. 94% said they use a mobile device (such as a cell phone, smartphone, or tablet) at least once per week.
63 2012 TeensTALK® | © STAMATS 2012
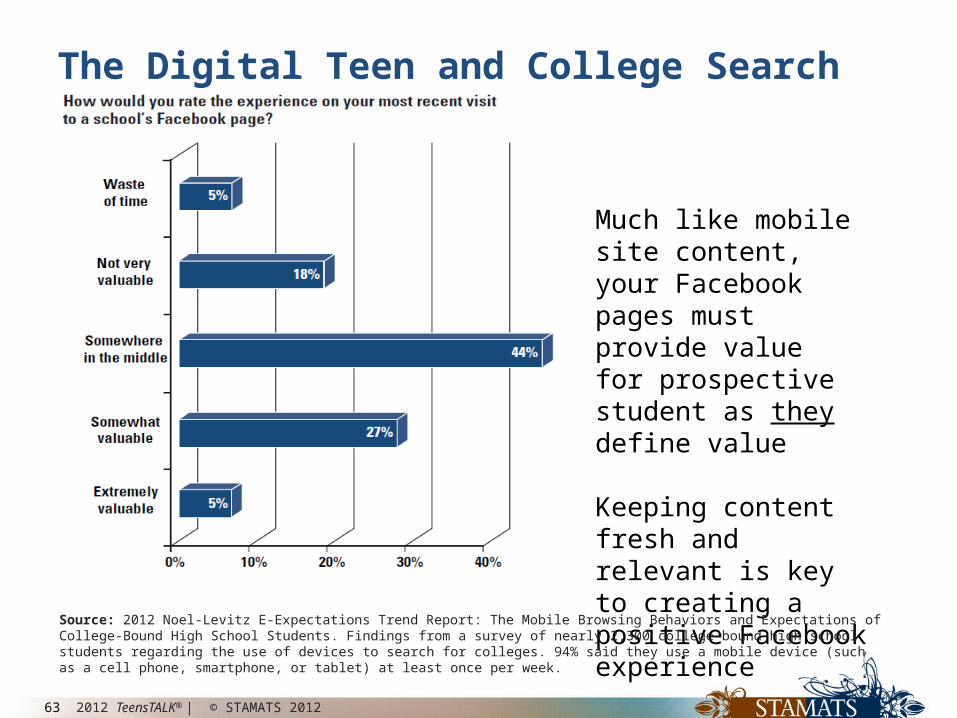
The Digital Teen and College Search
Much like mobile site content, your Facebook pages must provide valuefor prospective student as they define value
Keeping content fresh and relevant is key to creating a positive Facebook experience
Source: 2012 Noel-Levitz E-Expectations Trend Report: The Mobile Browsing Behaviors and Expectations of College-Bound High School Students. Findings from a survey of nearly 2,300 college-bound high school students regarding the use of devices to search for colleges. 94% said they use a mobile device (such as a cell phone, smartphone, or tablet) at least once per week.

64 2012 TeensTALK® | © STAMATS 2012
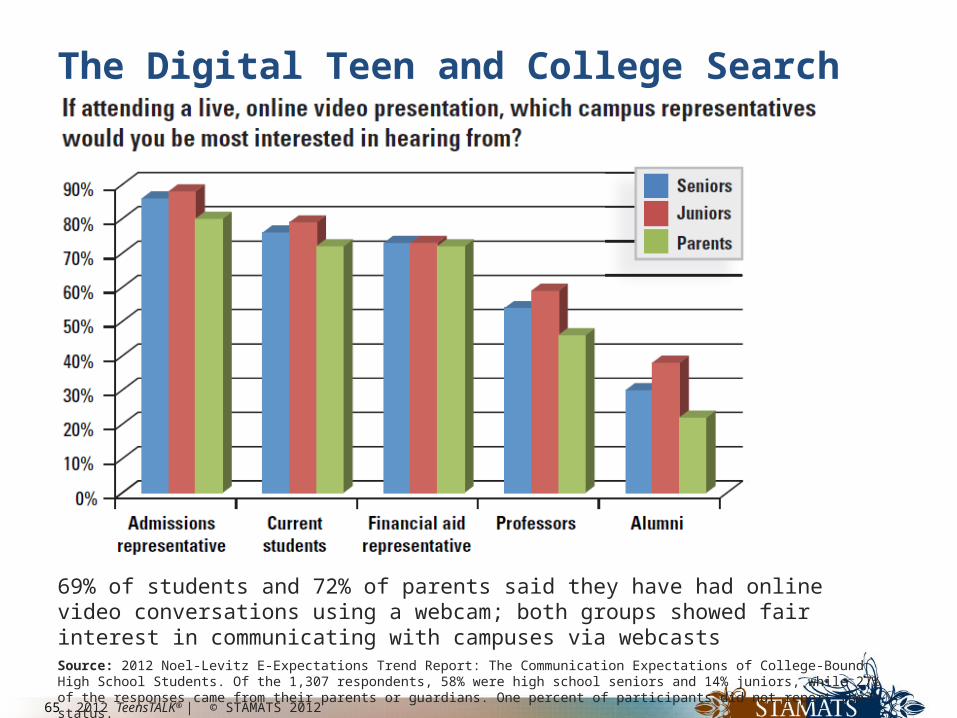
Source: 2012 Noel-Levitz E-Expectations Trend Report: The Communication Expectations of College-Bound High School Students. Of the 1,307 respondents, 58% were high school seniors and 14% juniors, while 27% of the responses came from their parents or guardians. One percent of participants did not report their status.
The Digital Teen and College Search
65 2012 TeensTALK® | © STAMATS 2012
69% of students and 72% of parents said they have had online video conversations using a webcam; both groups showed fair interest in communicating with campuses via webcastsSource: 2012 Noel-Levitz E-Expectations Trend Report: The Communication Expectations of College-Bound High School Students. Of the 1,307 respondents, 58% were high school seniors and 14% juniors, while 27% of the responses came from their parents or guardians. One percent of participants did not report their status.
The Digital Teen and College Search
66 2012 TeensTALK® | © STAMATS 2012
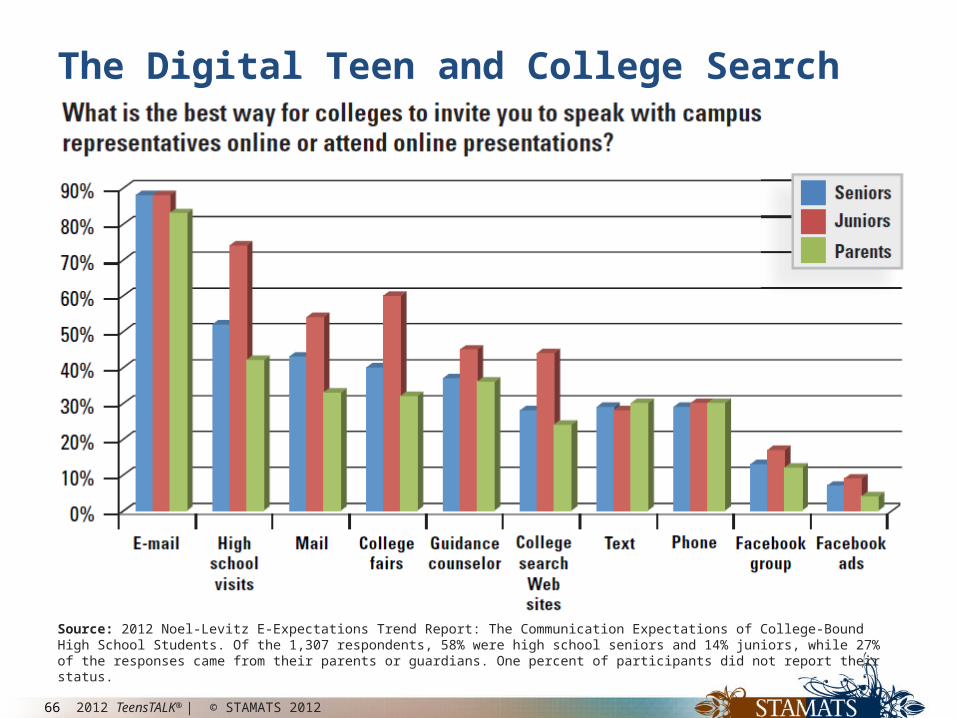
Source: 2012 Noel-Levitz E-Expectations Trend Report: The Communication Expectations of College-Bound High School Students. Of the 1,307 respondents, 58% were high school seniors and 14% juniors, while 27% of the responses came from their parents or guardians. One percent of participants did not report their status.
The Digital Teen and College Search
67 2012 TeensTALK® | © STAMATS 2012
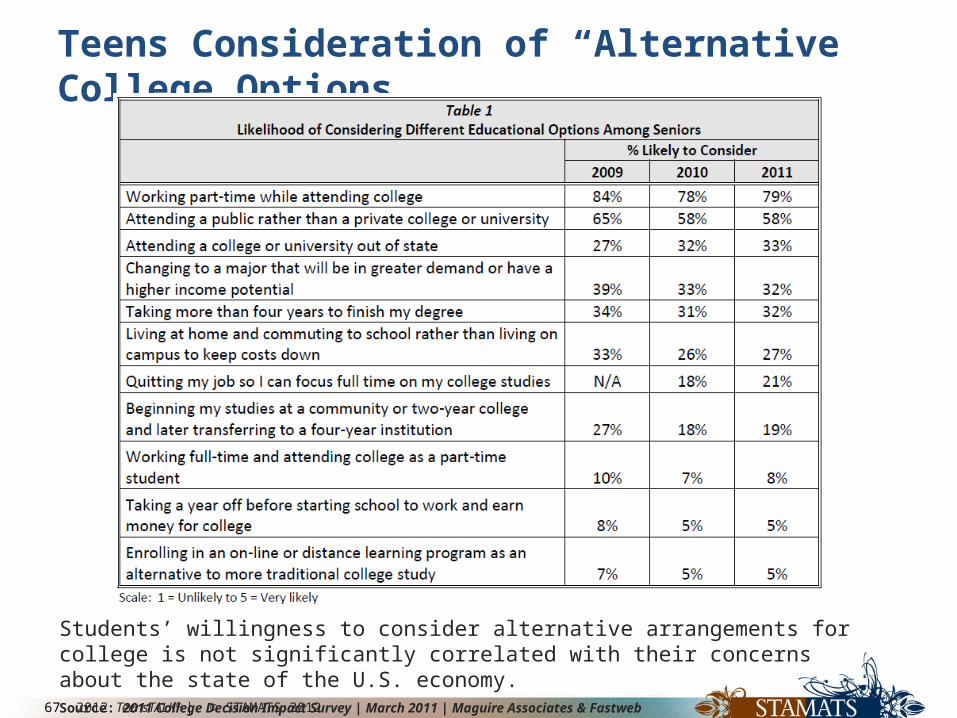
Students’ willingness to consider alternative arrangements for college is not significantly correlated with their concerns about the state of the U.S. economy. Source: 2011 College Decision Impact Survey | March 2011 | Maguire Associates & Fastweb
Teens Consideration of “Alternative” College Options

68 2012 TeensTALK® | © STAMATS 2012

69 2012 TeensTALK® | © STAMATS 2012
Presented byEric Sickler
Associate Vice President for Client Services
[email protected](319) 431-5043(800) 553-8878
Discussion

70 2012 TeensTALK® | © STAMATS 2012
Presented byEric Sickler
Associate Vice President for Client Services
[email protected](319) 431-5043(800) 553-8878
Thank You!

71 2012 TeensTALK® | © STAMATS 2012
Additional Slides
72 2012 TeensTALK® | © STAMATS 2012
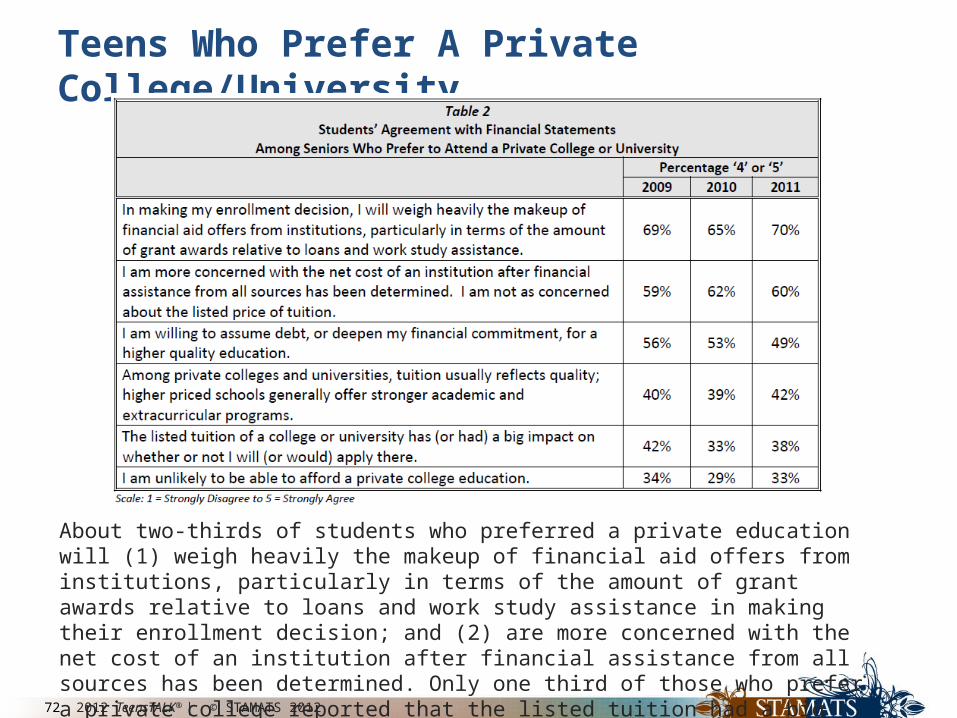
About two-thirds of students who preferred a private education will (1) weigh heavily the makeup of financial aid offers from institutions, particularly in terms of the amount of grant awards relative to loans and work study assistance in making their enrollment decision; and (2) are more concerned with the net cost of an institution after financial assistance from all sources has been determined. Only one third of those who prefer a private college reported that the listed tuition had a big impact on whether or not they would apply. Source: 2011 College Decision Impact Survey | March 2011 | Maguire Associates & Fastweb
Teens Who Prefer A Private College/University


![Research 2012 Recovered]](https://img.pdfslide.net/doc/110x75/577d1ead1a28ab4e1e8efecd/research-2012-recovered.jpg)