Embed Size (px)
DESCRIPTION
The new analytics is the art and science of turning the invisible into the visible. It’s about finding “unknown unknowns."
Citation preview

2012Issue 1
A quarterly journal
06The third wave of customer analytics
30The art and science of new analytics technology
58Building the foundation for a data science culture
Reshaping the workforce with the new analytics
Mike DriscollCEO, Metamarkets
44Natural language processing and social media intelligence

02 PwC Technology Forecast 2012 Issue 1
Acknowledgments
AdvisoryPrincipal & Technology LeaderTom DeGarmo
US Thought LeadershipPartner-in-ChargeTom Craren
Strategic MarketingNatalie KontraJordana Marx
Center for Technology & Innovation Managing EditorBo Parker
EditorsVinod Baya Alan Morrison
ContributorsGalen GrumanSteve Hamby and Orbis TechnologiesBud MathaiselUche OgbujiBill RobertsBrian Suda
Editorial AdvisorsLarry Marion
Copy EditorLea Anne Bantsari
TranscriberDawn Regan

Reshaping the workforce with the new analytics 03
US studioDesign LeadTatiana Pechenik
DesignerPeggy Fresenburg
IllustratorsDon Bernhardt James Millefolie
ProductionJeff Ginsburg
Online Managing Director Online MarketingJack Teuber
Designer and ProducerScott Schmidt
AnimatorRoger Sano
ReviewersJeff Auker Ken Campbell Murali Chilakapati Oliver Halter Matt Moore Rick Whitney
Special thanksCate CorcoranWIT Strategy
Nisha PathakMetamarkets
Lisa Sheeran Sheeran/Jager Communication
Industry perspectivesDuring the preparation of this publication, we benefited greatly from interviews and conversations with the following executives:
Kurt J. BilaferRegional Vice President, Analytics, Asia Pacific Japan SAP
Jonathan ChihorekVice President, Global Supply Chain Systems Ingram Micro
Zach DevereauxChief Analyst Nexalogy Environics
Mike DriscollChief Executive Officer Metamarkets
Elissa FinkChief Marketing Officer Tableau Software
Kaiser FungAdjunct Professor New York University
Kent KusharChief Information Officer E. & J. Gallo Winery
Josée LatendresseOwner Latendresse Groupe Conseil
Mario Leone Chief Information Officer Ingram Micro
Jock MackinlayDirector, Visual Analysis Tableau Software
Jonathan NewmanSenior Director, Enterprise Web & EMEA eSolutions Ingram Micro
Ashwin RanganChief Information Officer Edwards Lifesciences
Seth RedmoreVice President, Marketing and Product Management Lexalytics
Vince SchiavoneCo-founder and Executive Chairman ListenLogic
Jon SladeGlobal Online and Strategic Advertising Sales Director Financial Times
Claude ThéoretPresident Nexalogy Environics
Saul ZambranoSenior Director, Customer Energy Solutions Pacific Gas & Electric
Reshaping the workforce with the new analytics 31
The new analytics is the art and science of turning the invisible into the visible. It’s about finding “unknown unknowns,” as former US Secretary of Defense Donald Rumsfeld famously called them, and learning at least something about them. It’s about detecting opportunities and threats you hadn’t anticipated, or finding people you didn’t know existed who could be your next customers. It’s about learning what’s really important, rather than what you thought was important. It’s about identifying, committing, and following through on what your enterprise must change most.
Achieving that kind of visibility requires a mix of techniques. Some of these are new, while others aren’t. Some are clearly in the realm of data science because they make possible more iterative and precise analysis of large, mixed data sets. Others, like visualization and more contextual search, are as much art as science.
This article explores some of the newer technologies that make feasible the case studies and the evolving cultures of inquiry described in “The third wave of customer analytics” on page 06. These technologies include the following:
The art and science of new analytics technologyLeft-brain analysis connects with right-brain creativity.By Alan Morrison
• In-memory technology—Reducing response time and expanding the reach of business intelligence (BI) by extending the use of main (random access) memory
• Interactive visualization—Merging the user interface and the presentation of results into one responsive visual analytics environment
•Statistical rigor—Bringing more of the scientific method and evidence into corporate decision making
•Associative search—Navigating to specific names and terms by browsing the nearby context (see the sidebar, “Associative search,” on page 41)
A companion piece to this article, “Natural language processing and social media intelligence,” on page 44, reviews the methods that vendors use for the needle-in-a-haystack challenge of finding the most relevant social media conversations about particular products and services. Because social media is such a major data source for exploratory analytics and because natural language processing (NLP) techniques are so varied, this topic demands its own separate treatment.

32 PwC Technology Forecast 2012 Issue 1
In-memory technologyEnterprises exploring the latest in-memory technology soon come to realize that the technology’s fundamental advantage—expanding the capacity of main memory (solid-state memory that’s directly accessible) and reducing reliance on disk drive storage to reduce latency—can be applied in many different ways. Some of those applications offer the advantage of being more feasible over the short term. For example, accelerating conventional BI is a short-term goal, one that’s been feasible for several years through earlier products that use in-memory capability from some BI providers, including MicroStrategy, QlikTech QlikView, TIBCO Spotfire, and Tableau Software.
Longer term, the ability of platforms such as Oracle Exalytics, SAP HANA, and the forthcoming SAS in-memory Hadoop-based platform1 to query across a wide range of disparate data sources will improve. “Previously,
1 See Doug Henschen, “SAS Prepares Hadoop-Powered In-Memory BI Platform,” InformationWeek, February 14, 2012, http://www.informationweek.com/news/hardware/grid_cluster/232600767, accessed February 15, 2012. SAS, which also claims interactive visualization capabilities in this appliance, expects to make this appliance available by the end of June 2012.
users were limited to BI suites such as BusinessObjects to push the information to mobile devices,” says Murali Chilakapati, a manager in PwC’s Information Management practice and a HANA implementer. “Now they’re going beyond BI. I think in-memory is one of the best technologies that will help us to work toward a better overall mobile analytics experience.”
The full vision includes more cross-functional, cross-source analytics, but this will require extensive organizational and technological change. The fundamental technological change is already happening, and in time richer applications based on these changes will emerge and gain adoption. (See Figure 1.) “Users can already create a mashup of various data sets and technology to determine if there is a correlation, a trend,” says Kurt J. Bilafer, regional vice president of analytics at SAP.
To understand how in-memory advances will improve analytics, it will help to consider the technological advantages of hardware and software, and how they can be leveraged in new ways.
Figure 1: Addressable analytics footprint for in-memory technology
In-memory technology augmented traditional business intelligence (BI) and predictive analytics to begin with, but its footprint will expand over the forecast period to become the base for corporate apps, where it will blur the boundary between transactional systems and data warehousing. Longer term, more of a 360-degree view of the customer can emerge.
2011 2012 2013 2014
BI
+ERP andmobile +
Other corporateapps
Cross-functional,cross-sourceanalytics

Reshaping the workforce with the new analytics 33
access memory (RAM) rather than frequently reading it from and writing it to disk—makes it possible to bypass many input/output bottlenecks.
Systems have needed to do a lot of swapping, in part, because faster storage media were expensive. That’s why organizations have relied heavily on high-capacity, cheaper disks for storage. As transistor density per square millimeter of chip area has risen, the cost per bit to use semiconductor (or solid-state) memory has dropped and the ability to pack more bits in a given chip’s footprint has increased. It is now more feasible to use semiconductor memory in more places where it can help most, and thereby reduce reliance on high-latency disks.
Of course, the solid-state memory used in direct access applications, dynamic random access memory (DRAM), is volatile. To avoid the higher risk of
What in-memory technology does For decades, business analytics has been plagued by slow response times (also known as latency), a problem that in-memory technology helps to overcome. Latency is due to input/output bottlenecks in a computer system’s data path. These bottlenecks can be alleviated by using six approaches:
•Move the traffic through more paths (parallelization)
• Increase the speed of any single path (transmission)
•Reduce the time it takes to switch paths (switching)
•Reduce the time it takes to store bits (writing)
•Reduce the time it takes to retrieve bits (reading)
•Reduce computation time (processing)
To process and store data properly and cost-effectively, computer systems swap data from one kind of memory to another a lot. Each time they do, they encounter latency in transmitting, switching, writing, or reading bits. (See Figure 2.)
Contrast this swapping requirement with processing alone. Processing is much faster because so much of it is on-chip or directly interconnected. The processing function always outpaces multitiered memory handling. If these systems can keep more data “in memory” or directly accessible to the central processing units (CPUs), they can avoid swapping and increase efficiency by accelerating inputs and outputs.
Less swapping reduces the need for duplicative reading, writing, and moving data. The ability to load and work on whole data sets in main memory—that is, all in random
Figure 2: Memory swapping
Swapping data from RAM to disk introduces latency that in-memory systems designs can now avoid.
Steps that introduce latency
RAM
Block out Block in
Memory swapping
34 PwC Technology Forecast 2012 Issue 1
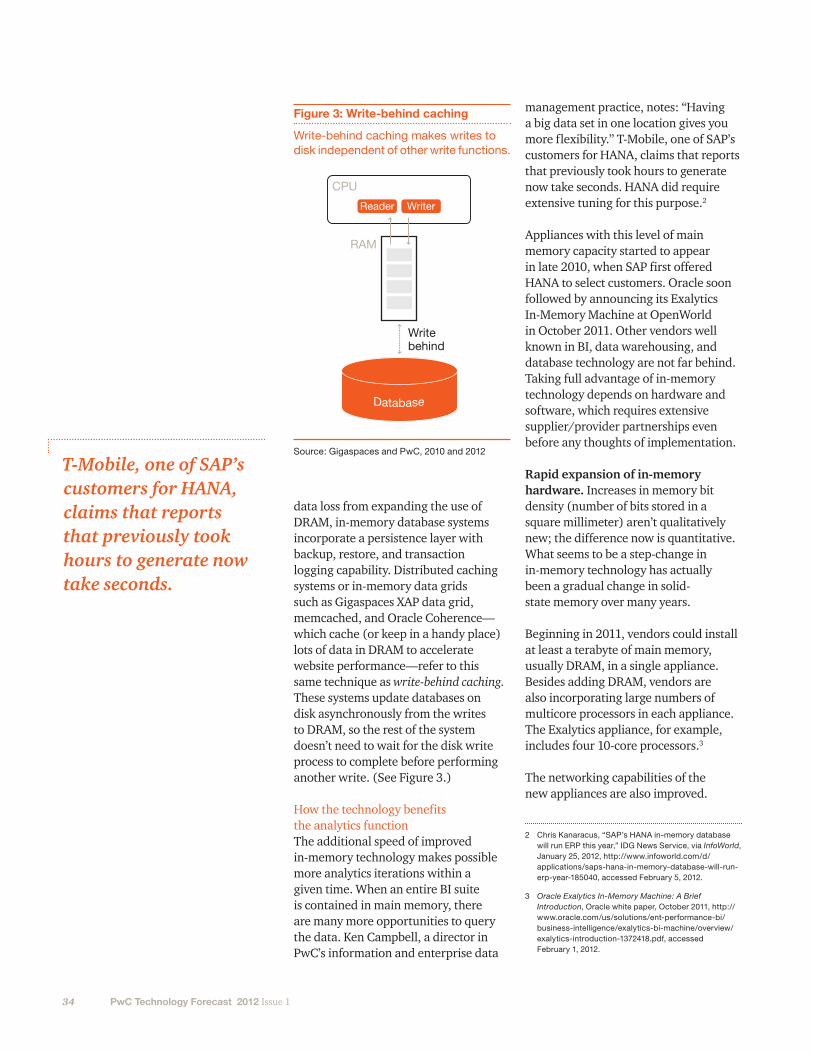
data loss from expanding the use of DRAM, in-memory database systems incorporate a persistence layer with backup, restore, and transaction logging capability. Distributed caching systems or in-memory data grids such as Gigaspaces XAP data grid, memcached, and Oracle Coherence—which cache (or keep in a handy place) lots of data in DRAM to accelerate website performance—refer to this same technique as write-behind caching. These systems update databases on disk asynchronously from the writes to DRAM, so the rest of the system doesn’t need to wait for the disk write process to complete before performing another write. (See Figure 3.)
How the technology benefits the analytics functionThe additional speed of improved in-memory technology makes possible more analytics iterations within a given time. When an entire BI suite is contained in main memory, there are many more opportunities to query the data. Ken Campbell, a director in PwC’s information and enterprise data
management practice, notes: “Having a big data set in one location gives you more flexibility.” T-Mobile, one of SAP’s customers for HANA, claims that reports that previously took hours to generate now take seconds. HANA did require extensive tuning for this purpose.2
Appliances with this level of main memory capacity started to appear in late 2010, when SAP first offered HANA to select customers. Oracle soon followed by announcing its Exalytics In-Memory Machine at OpenWorld in October 2011. Other vendors well known in BI, data warehousing, and database technology are not far behind. Taking full advantage of in-memory technology depends on hardware and software, which requires extensive supplier/provider partnerships even before any thoughts of implementation.
Rapid expansion of in-memory hardware. Increases in memory bit density (number of bits stored in a square millimeter) aren’t qualitatively new; the difference now is quantitative. What seems to be a step-change in in-memory technology has actually been a gradual change in solid-state memory over many years.
Beginning in 2011, vendors could install at least a terabyte of main memory, usually DRAM, in a single appliance. Besides adding DRAM, vendors are also incorporating large numbers of multicore processors in each appliance. The Exalytics appliance, for example, includes four 10-core processors.3
The networking capabilities of the new appliances are also improved.
2 Chris Kanaracus, “SAP’s HANA in-memory database will run ERP this year,” IDG News Service, via InfoWorld, January 25, 2012, http://www.infoworld.com/d/applications/saps-hana-in-memory-database-will-run-erp-year-185040, accessed February 5, 2012.
3 Oracle Exalytics In-Memory Machine: A Brief Introduction, Oracle white paper, October 2011, http://www.oracle.com/us/solutions/ent-performance-bi/business-intelligence/exalytics-bi-machine/overview/exalytics-introduction-1372418.pdf, accessed February 1, 2012.
T-Mobile, one of SAP’s customers for HANA, claims that reports that previously took hours to generate now take seconds.
Figure 3: Write-behind caching
Write-behind caching makes writes to disk independent of other write functions.
CPU
RAM
Write behind
Write-behind caching
Reader Writer
Source: Gigaspaces and PwC, 2010 and 2012

Reshaping the workforce with the new analytics 35
Exalytics has two 40Gbps InfiniBand connections for low-latency database server connections and two 10 Gigabit Ethernet connections, in addition to lower-speed Ethernet connections. Effective data transfer rates are somewhat lower than the stated raw speeds. InfiniBand connections became more popular for high-speed data center applications in the late 2000s. With each succeeding generation, InfiniBand’s effective data transfer rate has come closer to the raw rate. Fourteen data rate or FDR InfiniBand, which has a raw data lane rate of more than 14Gbps, became available in 2011.4
Improvements in in-memory databases. In-memory databases are quite fast because they are designed to run entirely in main memory. In 2005, Oracle bought TimesTen, a high-speed, in-memory database provider serving the telecom and trading industries. With the help of memory technology improvements, by 2011, Oracle claimed that entire BI system implementations, such as Oracle BI server, could be held in main memory. Federated databases—multiple autonomous databases that can be run as one—are also possible. “I can federate data from five physical databases in one machine,” says PwC Applied Analytics Principal Oliver Halter.
In 2005, SAP bought P*Time, a highly parallelized online transaction processing (OLTP) database, and has blended its in-memory database capabilities with those of TREX and MaxDB to create the HANA in-memory database appliance. HANA includes stores for both row (optimal for transactional data with many fields) and column (optimal for analytical data with fewer fields), with capabilities for both structured and less structured data. HANA will become the base for the full range of SAP’s applications,
4 See “What is FDR InfiniBand?” at the InfiniBand Trade Association site (http://members.infinibandta.org/kwspub/home/7423_FDR_FactSheet.pdf, accessed February 10, 2012) for more information on InfiniBand availability.
with SAP porting its enterprise resource planning (ERP) module to HANA beginning in the fourth quarter of 2012, followed by other modules.5
Better compression. In-memory appliances use columnar compression, which stores similar data together to improve compression efficiency. Oracle claims a columnar compression capability of 5x, so physical capacity of 1TB is equivalent to having 5TB available. Other columnar database management system (DBMS) providers such as EMC/Greenplum, IBM/Netezza, and HP/Vertica have refined their own columnar compression capabilities over the years and will be able to apply these to their in-memory appliances.
5 Chris Kanaracus, op. cit.
Use case examples
Business process advantages of in-memory technology
In-memory technology makes it possible to run queries that previously ran for hours in minutes, which has numerous implications. Running queries faster implies the ability to accelerate data-intensive business processes substantially.
Take the case of supply chain optimization in the electronics industry. Sometimes it can take 30 hours or more to run a query from a business process to identify and fill gaps in TV replenishment at a retailer, for example. A TV maker using an in-memory appliance component in this process could reduce the query time to under an hour, allowing the maker to reduce considerably the time it takes to respond to supply shortfalls.
Or consider the new ability to incorporate into a process more predictive analytics with the help of
in-memory technology. Analysts could identify new patterns of fraud in tax return data in ways they hadn’t been able to before, making it feasible to provide investigators more helpful leads, which in turn could make them more effective in finding and tracking down the most potentially harmful perpetrators before their methods become widespread.
Competitive advantage in these cases hinges on blending effective strategy, means, and execution together, not just buying the new technology and installing it. In these examples, the challenge becomes not one of simply using a new technology, but using it effectively. How might the TV maker anticipate shortfalls in supply more readily? What algorithms might be most effective in detecting new patterns of tax return fraud? At its best, in-memory technology could trigger many creative ideas for process improvement.
36 PwC Technology Forecast 2012 Issue 1
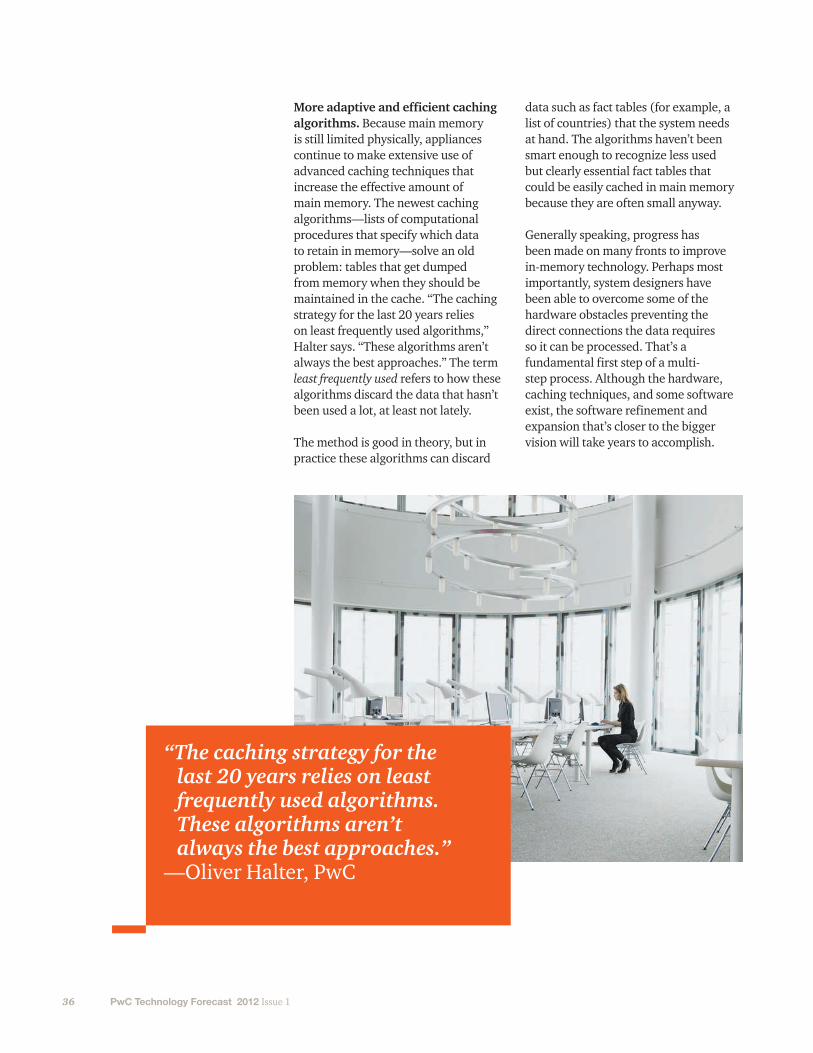
More adaptive and efficient caching algorithms. Because main memory is still limited physically, appliances continue to make extensive use of advanced caching techniques that increase the effective amount of main memory. The newest caching algorithms—lists of computational procedures that specify which data to retain in memory—solve an old problem: tables that get dumped from memory when they should be maintained in the cache. “The caching strategy for the last 20 years relies on least frequently used algorithms,” Halter says. “These algorithms aren’t always the best approaches.” The term least frequently used refers to how these algorithms discard the data that hasn’t been used a lot, at least not lately.
The method is good in theory, but in practice these algorithms can discard
data such as fact tables (for example, a list of countries) that the system needs at hand. The algorithms haven’t been smart enough to recognize less used but clearly essential fact tables that could be easily cached in main memory because they are often small anyway.
Generally speaking, progress has been made on many fronts to improve in-memory technology. Perhaps most importantly, system designers have been able to overcome some of the hardware obstacles preventing the direct connections the data requires so it can be processed. That’s a fundamental first step of a multi-step process. Although the hardware, caching techniques, and some software exist, the software refinement and expansion that’s closer to the bigger vision will take years to accomplish.
“The caching strategy for the last 20 years relies on least frequently used algorithms. These algorithms aren’t always the best approaches.”
—Oliver Halter, PwC

Reshaping the workforce with the new analytics 37
Self-service BI and interactive visualizationOne of BI’s big challenges is to make it easier for a variety of end users to ask questions of the data and to do so in an iterative way. Self-service BI tools put a larger number of functions within reach of everyday users. These tools can also simplify a larger number of tasks in an analytics workflow. Many tools—QlikView, Tableau, and TIBCO Spotfire, to name a few—take some advantage of the new in-memory technology to reduce latency. But equally important to BI innovation are interfaces that meld visual ways of blending and manipulating the data with how it’s displayed and how the results are shared.
In the most visually capable BI tools, the presentation of data becomes just another feature of the user interface. Figure 4 illustrates how Tableau, for instance, unifies data blending, analysis, and dashboard sharing within one person’s interactive workflow.
How interactive visualization worksOne important element that’s been missing from BI and analytics platforms is a way to bridge human language in the user interface to machine language more effectively. User interfaces have included features such as drag and drop for decades, but drag and drop historically has been linked to only a single application function—moving a file from one folder to another, for example.
You can combine, filter, and even perform calculations among different data sources right in the Tableau window.
Sales database
Customer nameLast n daysOrder dateOrder IDOrder priority
Territory spreadsheet
ContainerProduct categoryProfitStateZIP code
StateState abbreviatedPopulation, 2009Territory
A B C
Tableau recognizes identical fields in different data sets.
Database
Spreadsheet
Simple drag and drop replaces days of programming.
Figure 4: Data blending
In self-service BI software, the end user can act as an analyst.
Source: Tableau Software, 2011 Derived from a video at http://www.tableausoftware.com/videos/data-integration

38 PwC Technology Forecast 2012 Issue 1
To query the data, users have resorted to typing statements in languages such as SQL that take time to learn.
What a tool such as Tableau does differently is to make manipulating the data through familiar techniques (like drag and drop) part of an ongoing dialogue with the database extracts that are in active memory. By doing so, the visual user interface offers a more seamless way to query the data layer.
Tableau uses what it calls Visual Query Language (VizQL) to create that dialogue. What the user sees on the screen, VizQL encodes into algebraic expressions that machines interpret and execute in the data. VizQL uses table algebra developed for this approach that maps rows and columns to the x- and y-axes and layers to the z-axis.6
6 See Chris Stolte, Diane Tang, and Pat Hanrahan, “Polaris: A System for Query, Analysis, and Visualization of Multidimensional Databases,” Communications of the ACM, November 2008, 75–76, http:// mkt.tableausoftware.com/files/Tableau-CACM-Nov-2008-Polaris-Article-by-Stolte-Tang-Hanrahan.pdf, accessed February 10, 2012, for more information on the table algebra Tableau uses.
Jock Mackinlay, director of visual analysis at Tableau Software, puts it this way: “The algebra is a crisp way to give the hardware a way to interpret the data views. That leads to a really simple user interface.” (See Figure 5.)
The benefits of interactive visualizationPsychologists who study how humans learn have identified two types: left-brain thinkers, who are more analytical, logical, and linear in their thinking, and right-brain thinkers, who take a more synthetic parts-to-wholes approach that can be more visual and focused on relationships among elements. Visually oriented learners make up a substantial portion of the population, and adopting tools more friendly to them can be the difference between creating a culture of inquiry, in which different thinking styles are applied to problems, and making do with an isolated group of
Figure 5: Bridging human, visual, and machine language
552
Data interpreter
Generalqueries
Query resultsPartition into relationscorresponding to panes
Constructtable and
sortingnetwork
Computenormalized setform of each
table expression
Specificationx: C*(A+B)y: D+EZ: FIod: G…
x: { (c1, a1)…(ck, bj) }y: { (c1), …(dl), (e1), …(em) }z: { (f1), …(fn) }
Each tuple is rendered as a mark;data is encoded in color, size, etc.
Per pane aggregationand sorting of tuples
Visual interpreter
550 612
616
z x, y
720
1104 556 614
1. To the user, results come from a simple drag and drop, which encourages experimentation and further inquiry.
2. Behind the scenes, complex algebra actually makes the motor run. Hiding all the complexities of the VizQL computations saves time and frees the user to focus on the results of the query, rather than the construction of the query.
Database
Spreadsheet
Source: Chris Stolte, Diane Tang, and Pat Hanrahan, “Computer systems and methods for the query and visualization of multidimensional databases,” United States Patent 7089266, Stanford University, 2006, http://www.freepatentsonline.com/7089266.html, accessed February 12, 2012.

Reshaping the workforce with the new analytics 39
statisticians. (See the article, “How CIOs can build the foundation for a data science culture,” on page 58.) The new class of visually interactive, self-service BI tools can engage parts of the workforce—including right-brain thinkers—who may not have been previously engaged with analytics.
At Seattle Children’s Hospital, the director of knowledge management, Ted Corbett, initially brought Tableau into the organization. Since then, according to Elissa Fink, chief marketing officer of Tableau Software, its use has spread to include these functions:
•Facilities optimization—Making the best use of scarce operating room resources
• Inventory optimization—Reducing the tendency for nurses to hoard or stockpile supplies by providing visibility into what’s available hospital-wide
•Test order reporting—Ensuring tests ordered in one part of the hospital aren’t duplicated in another part
•Financial aid identification and matching—Expediting a match between needy parents whose children are sick and a financial aid source
The proliferation of iPad devices, other tablets, and social networking inside the enterprise could further encourage the adoption of this class of tools. TIBCO Spotfire for iPad 4.0, for example, integrates with Microsoft SharePoint and tibbr, TIBCO’s social tool.7
7 Chris Kanaracus, “Tibco ties Spotfire business intelligence to SharePoint, Tibbr social network,” InfoWorld, November 14, 2011, http:// www.infoworld.com/d/business-intelligence/tibco-ties-spotfire-business-intelligence-sharepoint-tibbr-social-network-178907, accessed February 10, 2012.
The QlikTech QlikView 11 also integrates with Microsoft SharePoint and is based on an HTML5 web application architecture suitable for tablets and other handhelds.8
Bringing more statistical rigor to business decisionsSports continue to provide examples of the broadening use of statistics. In the United States several years ago, Billy Beane and the Oakland Athletics baseball team, as documented in Moneyball by Michael Lewis, hired statisticians to help with recruiting and line-up decisions, using previously little-noticed player metrics. Beane had enough success with his method that it is now copied by most teams.
8 Erica Driver, “QlikView Supports Multiple Approaches to Social BI,” QlikCommunity, June 24, 2011, http://community.qlikview.com/blogs/theqlikviewblog/2011/06/24/with-qlikview-you-can-take-various-approaches-to-social-bi, and Chris Mabardy, “QlikView 11—What’s New On Mobile,” QlikCommunity, October 19, 2011, http:// community.qlikview.com/blogs/theqlikviewblog /2011/10/19, accessed February 10, 2012.
Good visualizations without normalized data
Business analytics software generally assumes that the underlying data is reasonably well designed, providing powerful tools for visualization and the exploration of scenarios. Unfortunately, well-designed, structured information is a rarity in some domains. Interactive tools can help refine a user’s questions and combine data, but often demand a reasonably normalized schematic framework.
Zepheira’s Freemix product, the foundation of the Viewshare.org project from the US Library of Congress, works with less-structured data, even comma-separated values (CSV) files with no headers. Rather than assuming
the data is already set up for the analytical processing that machines can undertake, the Freemix designers concluded that the machine needs help from the user to establish context, and made generating that context feasible for even an unsophisticated user.
Freemix walks the user through the process of adding context to the data by using annotations and augmentation. It then provides plug-ins to normalize fields, and it enhances data with new, derived fields (from geolocation or entity extraction, for example). These capabilities help the user display and analyze data quickly, even when given only ragged inputs.

40 PwC Technology Forecast 2012 Issue 1
In 2012, there’s a debate over whether US football teams should more seriously consider the analyses of academics such as Tobias Moskowitz, an economics professor at the University of Chicago, who co-authored a book called Scorecasting. He analyzed 7,000 fourth-down decisions and outcomes, including field positions after punts and various other factors. His conclusion? Teams should punt far less than they do.
This conclusion contradicts the common wisdom among football coaches: even with a 75 percent chance of making a first down when there’s just two yards to go, coaches typically choose to punt on fourth down. Contrarians, such as Kevin Kelley of Pulaski Academy in Little Rock, Arkansas, have proven Moskowitz right. Since 2003, Kelley went for it on fourth down (in various yardage situations) 500 times and has a 49 percent success rate. Pulaski Academy has won the state championship three times since Kelley became head coach.9
Addressing the human factor As in the sports examples, statistical analysis applied to business can surface findings that contradict long-held assumptions. But the basic principles aren’t complicated. “There are certain statistical principles and concepts that lie underneath all the sophisticated methods. You can get a lot out of or you can go far without having to do complicated math,” says Kaiser Fung, an adjunct professor at New York University.
Simply looking at variability is an example. Fung considers variability a neglected factor in comparison to averages, for example. If you run a
9 Seth Borenstein, “Unlike Patriots, NFL slow to embrace ‘Moneyball’,” Seattle Times, February 3, 2012, http://seattletimes.nwsource.com/html/sports/2017409917_apfbnsuperbowlanalytics.html, accessed February 10, 2012.
theme park and can reduce the longest wait times for rides, that is a clear way to improve customer satisfaction, and it may pay off more and be less expensive than reducing the average wait time.
Much of the utility of statistics is to confront old thinking habits with valid findings that may seem counterintuitive to those who aren’t accustomed to working with statistics or acting on the basis of their findings. Clearly there is utility in counterintuitive but valid findings that have ties to practical business metrics. They get people’s attention. To counter old thinking habits, businesses need to raise the profiles of statisticians, scientists, and engineers who are versed in statistical methods, and make their work more visible. That in turn may help to raise the visibility of statistical analysis by embedding statistical software in the day-to-day business software environment.
R: Statistical software’s open source evolution Until recently, statistical software packages were in a group by themselves. College students who took statistics classes used a particular package, and the language it used was quite different from programming languages such as Java. Those students had to learn not only a statistical language, but also other programming languages. Those who didn’t have this breadth of knowledge of languages faced limitations in what they could do. Others who were versed in Python or Java but not a statistical package were similarly limited.
What’s happened since then is the proliferation of R, an open source statistical programming language that lends itself to more uses in
“There are certain statistical principles and concepts that lie underneath all the sophisticated methods. You can get a lot out of or you can go far without having to do complicated math.”
—Kaiser Fung, New York University

Reshaping the workforce with the new analytics 41
business environments. R has become popular in universities and now has thousands of ancillary open source applications in its ecosystem. In its latest incarnations, it has become part of the fabric of big data and more visually oriented analytics environments.
R in open source big data environments. Statisticians have typically worked with small data sets on their laptops, but now they can work with R directly on top of Hadoop, an open source cluster computing environment.10 Revolution Analytics, which offers a commercial R distribution, created a Hadoop interface for R in 2011, so R users will not be required to use MapReduce or Java.11 The result is a big data analytics capability for R statisticians and programmers that didn’t exist before, one that requires no additional skills.
R convertible to SQL and part of the Oracle big data environment. In January 2012, Oracle announced Oracle R Enterprise, its own distribution of R, which is bundled with a Hadoop distribution in its big data appliance. With that distribution, R users can run their analyses in the Oracle 11G database. Oracle claims performance advantages when running in its own database.12
Integrating interactive visualization with R. One of the newest capabilities involving R is its integration with
10 See “Making sense of Big Data,” Technology Forecast 2010, Issue 3, http://www.pwc.com/us/en/technology-forecast/2010/issue3/index.jhtml, and Architecting the data layer for analytic applications, PwC white paper, Spring 2011, http://www.pwc.com/us/en/increasing-it-effectiveness/assets/pwc-data-architecture.pdf, accessed April 5, 2012, to learn more about Hadoop and other NoSQL databases.
11 Timothy Prickett Morgan, “Revolution speeds stats on Hadoop clusters,” The Register, September 27, 2011, http://www.theregister.co.uk/2011/09/27/revolution_r_hadoop_integration/, accessed February 10, 2012.
12 Doug Henschen, “Oracle Analytics Package Expands In-Database Processing Options,” InformationWeek, February 8, 2012, http://informationweek.com/news/software/bi/232600448, accessed February 10, 2012.
interactive visualization.13 R is best known for its statistical analysis capabilities, not its interface. However, interactive visualization tools such as Omniscope are beginning to offer integration with R, improving the interface significantly.
The resulting integration makes it possible to preview data from various sources, drag and drop from those sources and individual R statistical operations, and drag and connect to combine and display results. Users can view results in either a data manager view or a graph view and refine the visualization within either or both of those views.
13 See Steve Miller, “Omniscope and R,” Information Management, February 7, 2012, http:// www.information-management.com/blogs/data-science-agile-BI-visualization-Visokio-10021894-1.html and the R Statistics/Omniscope 2.7 video, http://www.visokio.com/featured-videos, accessed February 8, 2012.
Associative search
Particularly for the kinds of enterprise databases used in business intelligence, simple keyword search goes only so far. Keyword searches often come up empty for semantic reasons—the users doing the searching can’t guess the term in a database that comes closest to what they’re looking for.
To address this problem, self-service BI tools such as QlikView offer associative search. Associative search allows users to select two or more fields and search occurrences in both to find references to a third concept or name.
With the help of this technique, users can gain unexpected insights and make discoveries by clearly seeing how data is associated—sometimes for the very first time. They ask a stream of questions by making a series of selections, and they instantly see all the fields in the application filter themselves based on their selections.
At any time, users can see not only what data is associated—but what data is not related. The data related to their selections is highlighted in white while unrelated data is highlighted in gray.
In the case of QlikView’s associative search, users type relevant words or phrases in any order and get quick, associative results. They can search across the entire data set, and with search boxes on individual lists, users can confine the search to just that field. Users can conduct both direct and indirect searches. For example, if a user wanted to identify a sales rep but couldn’t remember the sales rep’s name—just details about the person, such as that he sells fish to customers in the Nordic region—the user could search on the sales rep list box for “Nordic” and “fish” to narrow the search results to just sellers who meet those criteria.
42 PwC Technology Forecast 2012 Issue 1
R has benefitted greatly from its status in the open source community, and this has brought it into a mainstream data analysis environment. There is potential now for more direct collaboration between the analysts and the statisticians. Better visualization and tablet interfaces imply an ability to convey statistically based information more powerfully and directly to an executive audience.
Conclusion: No lack of vision, resources, or technology The new analytics certainly doesn’t lack for ambition, vision, or technological innovation. SAP intends to base its new applications architecture on the HANA in-memory database appliance. Oracle envisions running whole application suites in memory, starting with BI. Others that offer BI or columnar database products have similar visions. Tableau Software and others in interactive visualization continue to refine and expand a visual language that allows even casual users to extract, analyze, and display in a few drag-and-drop steps. More enterprises are keeping their customer data longer, so they can mine the historical record more effectively. Sensors are embedded in new places daily, generating ever more data to analyze.
There is clear promise in harnessing the power of a larger proportion of the whole workforce with one aspect or another of the new analytics. But that’s not the only promise. There’s also the promise of more data and more insight about the data for staff already fully engaged in BI, because of processes that are instrumented closer to the action; the parsing and interpretation of prose, not just numbers; the speed that questions about the data can be asked and answered; the ability to establish whether a difference is random error or real and repeatable; and the active engagement with analytics that interactive visualization makes possible. These changes can enable a company to be highly responsive to its environment, guided by a far more accurate understanding of that environment.
There are so many different ways now to optimize pieces of business processes, to reach out to new customers, to debunk old myths, and to establish realities that haven’t been previously visible. Of course, the first steps are essential—putting the right technologies in place can set organizations in motion toward a culture of inquiry and engage those who haven’t been fully engaged.

Reshaping the workforce with the new analytics 43
There are so many different ways now to optimize pieces of business processes, to reach out to new customers, to debunk old myths, and to establish realities that haven’t been previously visible. Of course, the first steps are essential—putting the right technologies in place can set organizations in motion toward a culture of inquiry.
The new analytics certainly doesn’t lack for ambition, vision, or technological innovation.

Comments or requests? Please visit www.pwc.com/techforecast or send e-mail to [email protected]
Tom DeGarmoUS Technology Consulting Leader+1 (267) 330 [email protected]
Bo Parker Managing Director Center for Technology & Innovation +1 (408) 817 5733 [email protected]
Robert ScottGlobal Consulting Technology Leader+1 (416) 815 [email protected]
Bill Abbott Principal, Applied Analytics +1 (312) 298 6889 [email protected]
Oliver Halter Principal, Applied Analytics +1 (312) 298 6886 [email protected]
To have a deeper conversation about this subject, please contact:

PwC (www.pwc.com) provides industry-focused assurance, tax and advisory services to build public trust and enhance value for its clients and their stakeholders. More than 155,000 people in 153 countries across our network share their thinking, experience and solutions to develop fresh perspectives and practical advice.
© 2012 PricewaterhouseCoopers LLP, a Delaware limited liability partnership. All rights reserved. PwC refers to the US member firm, and may sometimes refer to the PwC network. Each member firm is a separate legal entity. Please see www.pwc.com/structure for further details. This content is for general information purposes only, and should not be used as a substitute for consultation with professional advisors. NY-12-0340
PhotographyCatherine Hall: Cover, pages 06, 20Gettyimages: pages 30, 44, 58
This publication is printed on McCoy Silk. It is a Forest Stewardship Council™ (FSC®) certified stock containing 10% postconsumer waste (PCW) fiber and manufactured with 100% certified renewable energy.
By using postconsumer recycled fiber in lieu of virgin fiber:
6 trees were preserved for the future
16 lbs of waterborne waste were not created
2,426 gallons of wastewater flow were saved
268 lbs of solid waste were not generated
529 lbs net of greenhouse gases were prevented
4,046,000 BTUs of energy were not consumed

www.pwc.com/techforecast
Subtext
Culture of inquiry A business environment focused on asking better questions, getting better answers to those questions, and using the results to inform continual improvement. A culture of inquiry infuses the skills and capabilities of data scientists into business units and compels a collaborative effort to find answers to critical business questions. It also engages the workforce at large—whether or not the workforce is formally versed in data analysis methods—in enterprise discovery efforts.
In-memory A method of running entire databases in random access memory (RAM) without direct reliance on disk storage. In this scheme, large amounts of dynamic random access memory (DRAM) constitute the operational memory, and an indirect backup method called write-behind caching is the only disk function. Running databases or entire suites in memory speeds up queries by eliminating the need to perform disk writes and reads for immediate database operations.
Interactive visualization
The blending of a graphical user interface for data analysis with the presentation of the results, which makes possible more iterative analysis and broader use of the analytics tool.
Natural language processing (NLP)
Methods of modeling and enabling machines to extract meaning and context from human speech or writing, with the goal of improving overall text analytics results. The linguistics focus of NLP complements purely statistical methods of text analytics that can range from the very simple (such as pattern matching in word counting functions) to the more sophisticated (pattern recognition or “fuzzy” matching of various kinds).