Embed Size (px)
Citation preview
1
The BIG Picture: Where Does the Market Stand? Sarah Garrity, OppenheimerFunds

Source: Morningstar Direct and Ibbotson, 12/31/15. The charts are hypothetical examples which are shown for illustrative purposes only and do not predict or depict the performance of any investment. Index definitions can be found on page 75. Past performance does not guarantee future results.
2
$10,000
$100,000
$1,000,000
$10,000,000
0.0%
4.0% Dow Jones Industrial Average: Volatility (3-Month Moving Average), Left AxisDow Jones Industrial Average: Growth of $10,000 Right Axis
Every Generation Faces Its Share of Challenges“In the 20th century, the United States endured two world wars...the Depression, a dozen or so recessions and financial panics, oil shocks, a flu epidemic, and the resignation of a disgraced president. Yet the Dow rose from 66 to 11,497.” – Warren Buffett, 10/17/08
Dow Jones Industrial Average: Growth of $10,000 and Volatility (1900–2015)
(Log Scale)
1900 1920 1940 1960 1980 2000 2014
312
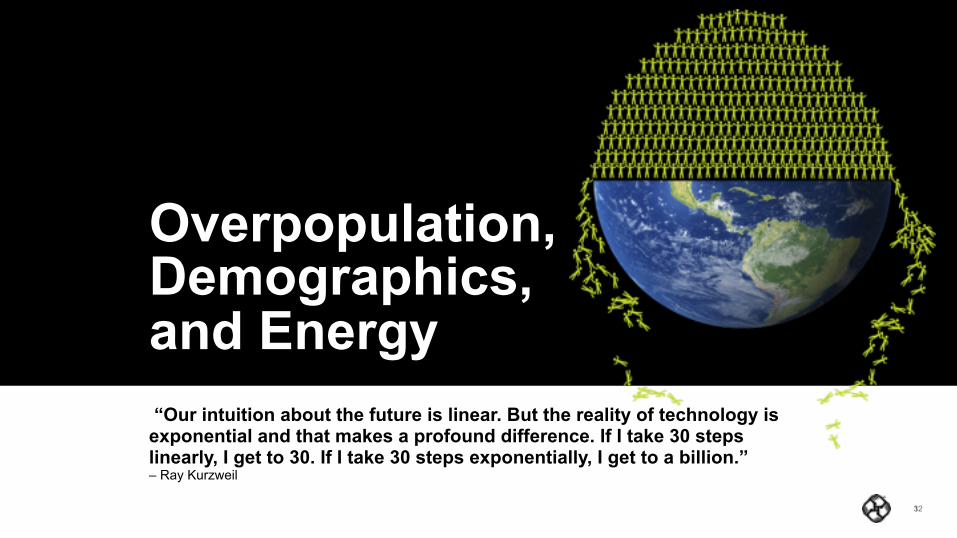
“Our intuition about the future is linear. But the reality of technology is exponential and that makes a profound difference. If I take 30 steps linearly, I get to 30. If I take 30 steps exponentially, I get to a billion.” – Ray Kurzweil
Overpopulation,Demographics,and Energy

Source: United Nations and World Bank, as of 12/31/10.4
World Grain Production vs. World Population
0
100
200
300
400
1950 1960 1970 1980 1990 2000 2010
World Grain Production World Population Growth
Overpopulation and Food Shortages?… Nope
1950
= 1
00
+249%
+174%
The entire world population could fit in the state of Texas and…
… it would only have the population density of New York City

Source: Bureau of Labor Statistics, Census Bureau, 2015. 5
How Are We Going to Handle All of Those Baby Boomers?
20–39 59+ 40–59 20–39 59+ 40–59
66.9Million87.2
Million85.1Million
Age in years Age in years
Perception Reality U.S. Population by Age
Top 10 Most Common Ages in the U.S.
24 25 23 55 26 22 54 51 52 53
#1
#10

Source: Ned Davis Research, 2015.6
Aren’t We in the Twilight of the American Century?
Answer: A. United States
Which country is:
#1 in natural gas production
#1 in nuclear production
#1 in refined oil output
#2 in coal production
#3 in oil production
#3 exportinggoods and services
A. United States B. Brazil C. India D. China

716
“Where have you gone, Joe DiMaggio? A nation turns its lonely eyes to you.” – Simon & Garfunkel
The Improving Human Condition

Sources: Middle Class Data: Brookings Institute, 2012, Population Data: World Bank: Health Nutrition and Population Statistics. Forecasts may not be achieved.8
Size of Literate Population of the World (% of world population)
The Big Story: Global Educated Middle Class
Size of Middle Class Population of the World (% of world population)
1950 1960 1970 1980 1990 2000 2010
84%82%75%70%63%61%56%
1965 2005 2025E
29% 39%
53%

Source: Statistics on Violent Conflict, 2015.9
The Big Story: Dramatic Decrease in Global Violence
Percentage of World Population that Was Killed in Specific World Events
Genghis Khan
(1206–1227)
11.1%
An Lushan
Rebellion
(755–763)
5.9%
Xin Dynasty
(9–24) 5.9%
Timur (1370–1405)
4.7%
World War II (1939–1945) 3.7%
World War I (1914–1918) 1.9%
Vietnam War (1955–1975) 0.1%
21 st Century Conflicts
(2001–2014)
0.01%
“The decline of violence may be the most significant and least appreciated development in the history of our species.”—Steven Pinker, Psychologist, Harvard University

Source: United for a Fair Economy, 2011 and thomasjstanley.com * 3% of the on deck individuals are undetermined.
10
The Big Story: The American Dream Is Alive and WellMillionaires Billionaires
On which base was each member of the Forbes 400 born?
80% did not inherit
10% or more of their wealth
20% inherited some wealth from a trust fund or estate
7%
21%
22%
12%
3rd Base Inherited wealth in excess of $50 million or a large and prosperous company
Home Plate Inherited sufficient wealth to make the Forbes 400 list
On Deck Individuals who came from a lower- or middle-class background
1st Base Individuals who had opportunities that gave them an advantage, inherited less than $1m, or received some start-up capital from a family member
38%
2nd Base Inherited a medium-sized business or wealth of more than $1m or received substantial start-upcapital for a businessfrom a familymember
1120
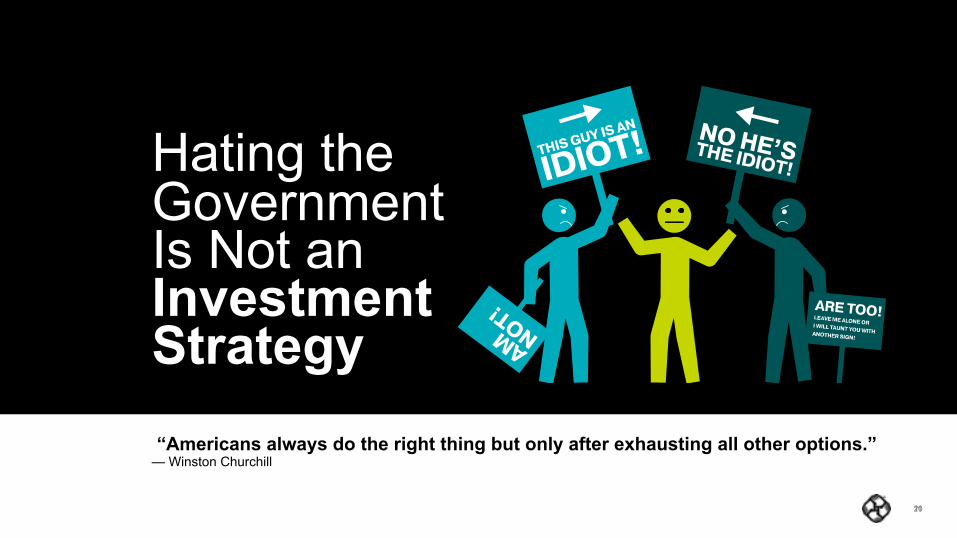
“Americans always do the right thing but only after exhausting all other options.” — Winston Churchill
Hating theGovernmentIs Not an InvestmentStrategy

Source: Bloomberg, 12/31/15. Past performance does not guarantee future results.12
0
325,000
650,000
975,000
$1,300,000
1942 1961 1979 1997 2016
Growth of $10,000 Since 1945 in the DowThe Markets Actually Like Divided GovernmentGains for Stocks (DJIA) 1901–2014
Waiting for “Your Team” to Win Before You Invest?
Divided Government
7.0% Annualized Returns
Unified Government
4.6% Annualized Returns

Source: Gallup 12/31/15. The Presidential Approval ratings were introduced in the late 1930s to gauge public support for the President of the United States during the term. For illustrative purposes only and not intended as investment advice. See page 75 for index definitions. Past performance does not guarantee future results.
13
Gallup Poll Presidential Approval Ratings and Dow Jones Industrial Average Growth of $10,000
Approval Ratings and Markets Don’t Always Move in the Same Direction
0
23
45
68
90%
$100,000
$1,000,000
Log Scale
1961 1963 1969 1977 1981 1989 1993 2001 20091974 2015
Presidential Approval Rating
Gain/ Annu
m% of Time
>65 2.4% 15.7%50-65 6.8% 38.5%36-50 11.1% 38.2%<35 -13.8% 7.6%

For illustrative purposes only and not intended as investment advice.14
Our Campaigns Have Never Been Filled with Such Vitriol, Right?
JohnAdams
Thomas Jefferson

15
The Boom of Boomers
1960 vs 2015 – Same people, different priorities
Worldwide, We Are on the Cusp of an Aging Population with Unique and Predictable Needs
“As the Baby Boomers like me are retiring and getting ready to retire, they will spend whatever it takes – and they’re the wealthiest generation in our country – to make themselves live an enjoyable life in their retirement years.” – David Rubenstein
1960s Today
Wedding
First House
KidsHealthcare Travel
Luxury

Sources: 1. AARP Boomer Study, 2015. 2. Immerson Active, 2015. 3. Deloitte, 2014.16
0
7
14
21
28
2014 2015
How it is booked?1 Boomer travel booking preferences
What trips are being taken?1
Likelihood of a Boomer booking a cruise
The Means for LeisureTravelers are looking for new adventures, goods and ways to spend their free time
Why are they travelling?2,3 Luxury travel in the U.S.
85% used an online resources
15% booked throughtraditional methods
vs.
56% Growth
Global Luxury Travel37% of all luxury purchases are made by tourists
$150bn spent by Boomers contributed to 80% of luxury travel
All other travellers

Sources: Robert Shiller, the Federal Reserve and Haver Analytics, 12/31/15. Past performance does not guarantee future results. 17
Classic Signs of Recession Not EvidentThe Great Depression
Deep Early 80’s Recession Tech Bubble Housing Bubble Today
1929 1980 2000 2008 2016
Bank Credit 20.9% 11.03% 10.97% 10.05% 7.4%
Inflation 1.2% 14.8% 3.7% 5.6% 0.2%
Valuation 20.2x 9.9x 33.8x 17.7x 17.5x
Household Debt to Income Ratio 51.0% 68.7% 97.8% 132.3% 104.4%

Sources: Federal Reserve Bank of Boston, Statistical Abstract of the United States, International Labor Organization, United Nations, Bureau of Labor Statistics, as of 12/31/13. “Its Getting Better All The Time: 100 Greatest Trends of the Last 100 Years,” Stephen Moore & Julian L. Simon.
18
The Big Story: These Are the Good Old DaysAverage American Home Average American Home
Technology Technology
Income and Education Income and Education
Quality of Life Quality of Life1950s Today
983 sq. ft. with 3.5 residents 55% homeownership
2,349 sq. ft. with 2.5 residents 80% homeownership
$11,000 average earnings (inflation-adjusted 2008)
41% high school graduation rate 8% college graduation rate
10% own televisions $2,100 inflation-adjusted
cost of television 60% own landline telephones 0% have air conditioning 0% have computers
68 years life expectancy 50% of seniors in poverty 75% of African-Americans in poverty 0 years average retirement
78 years life expectancy 9% of seniors in poverty 27% of African-Americans in poverty 12 years average retirement
$44,000 average earnings(inflation-adjusted 2008)
88% high school graduation rate 31% college graduation rate
95% own televisions $500 average cost of television 90% own cell phones 90% have air-conditioning 75% have computers