Embed Size (px)
DESCRIPTION
Citation preview
WORLDWIDE
Analysis of the Potential of Total Quality Sales
Management
White Paper
Corey E. Miller, Ph.D.
Associate Professor, Wright State UniversityChally Center for Scientific Innovation
3123 Research Blvd.Dayton, OH 45420
(937) 259-1200

Potential TQSalesM Results
copyright © Chally Group Worldwide www.chally.com1
Total Quality Management (TQM), Six Sigma, Lean and ISO, the data-driven methodologies for eliminating defects in organizations based on standards, measurement, and repeatable processes have provided undeniable success for organizations around the world by eliminating waste and improving productivity. Now Chally has applied the TQM concept to Sales.
TQSalesM™ is a proprietary method developed by Chally that applies the Total Quality Management (TQM) approach (that is commonly applied to manufacturing, engineering, supply chain management and other business disciplines) to sales. The substantial benefits of the TQSalesM approach may best be demonstrated with a concrete example. We have created a realistic business case simulation based on Chally’s extensive research, vast databases, and research reported in professional journals.
The results of the simulation assume that the TQSalesM approach is followed completely and properly. Nevertheless, we have used very conservative, defensible estimates in regard to the gains possible even with incorrect implementation. It is clear that if even a fraction of the gains demonstrated are made, then the financial benefits will far outweigh the costs of using Chally tools and will result in a high ROI.
Before TQSalesM, it was not possible to accurately or reliably quantify the results of talent management systems. Typically, effectiveness of talent management systems was quantified using nebulous utility analyses, testimonials, or case studies. As TQM teaches us, if you do not have precise and accurate metrics to measure key variables, you cannot quantify results.
In the real world, there is a ramp-up time until new sales employees reach their potential. For the company, meaningful bottom-line results do not appear immediately, but unfold over time. Investment in talent, as in any other investment, takes time to yield results. Even if you were able to hire Chally recommended candidates immediately after Chally completes the Validation Study and implements a Chally validated profile, it would take time for the new hires to go through on-boarding orientation and training and get ramped up on the job. Although many clients give us feedback that they see immediate improvements in the quality of new hires once they begin hiring Chally recommended candidates, it requires some time before the anecdotal evidence translates into empirical evidence or dollar savings.
DEVELOPING THE BEST PEOPLE, PROCESSES AND MANAGEMENT CONTROLS IS KEY TO STRATEGIC GROWTH
Introduction

Potential TQSalesM Results
copyright © Chally Group Worldwide www.chally.com2
Year Ending
Without Chally
Cumulative Sales Improvement in % of Baseline
$150
$140
$130
$120
$110
$100
$90
0.00%10.63%
22.65%
38.20%
Gro
ss S
ales
Example: Implementation for ABC Company
Figure 1
What kind of results might you expect? The following simulation shows that a 10.63% improvement in sales after one year, 22.65% after two years and 38.20% after three years is possible. Figure 1 shows these results graphically. Results are presented in % improvement and with a round starting point at $100 Million in sales. These figures were aged so that a quick comparison can be made to your organization. The rest of this white paper explains in detail the simulation which shows these results are possible.
The simulation presented below begins in Year One which starts the day after the first Chally recommended candidate was hired and runs through a four-year cycle of projected returns. We describe the process using a hypothetical company with a sales force of 200, and which produces a total of $200 Million in sales annually, or an average of $1M per salesperson. A standard performance distribution is built to reflect real data from Chally’s 35 year database of several thousand real sales forces across multiple markets.
Potential TQSalesM Results
copyright © Chally Group Worldwide www.chally.com3
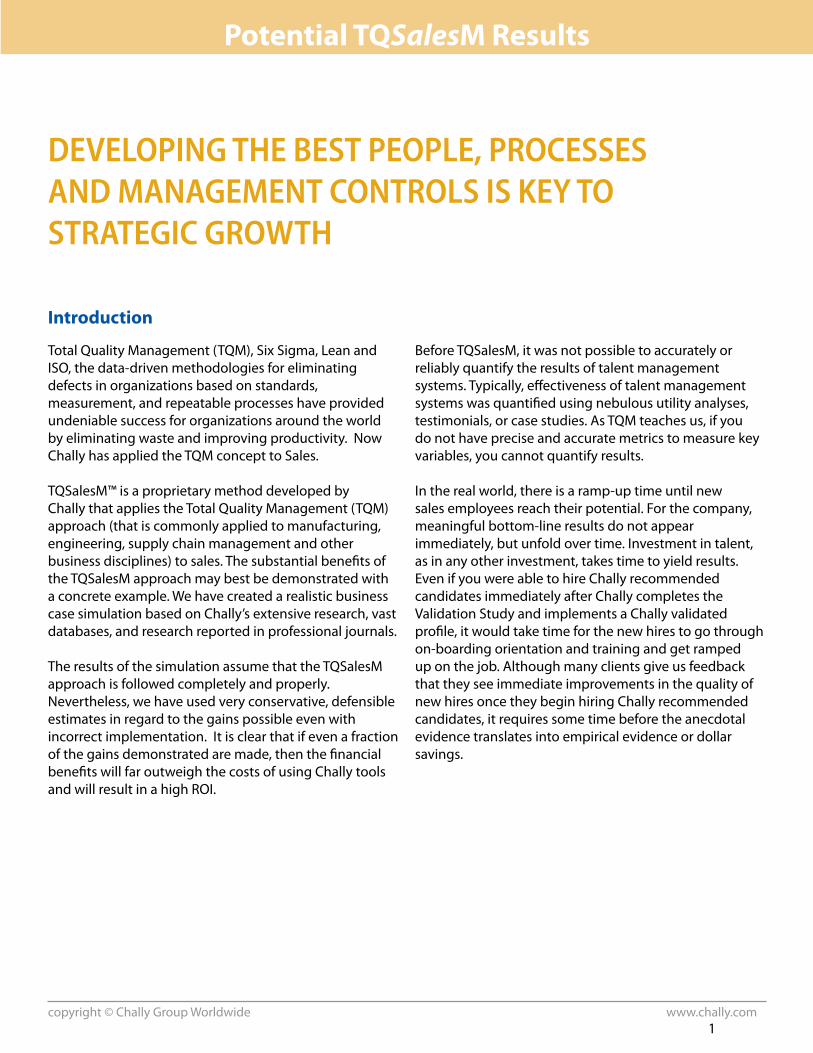
The main task in Year One is to scientifically identify the predictive skill sets for sales and manager positions. This allows you to Select employees who will be successful replacements for those leaving the organization, many of whom lacked the skill set to be successful according to the validation tool.
The Validation Study is a scientific tool, which allows us to identify the skill set required for salesperson success as part of the larger TQSalesM process. The validation tool is used to statistically determine the skills that differentiate successful salespeople from unsuccessful salespeople. This is an important step in the process that allows you to reduce the number of underperforming sales territories.
The Talent Audit is a tool that allows you to scientifically identify the skill sets of existing sales and sales manager personnel. Once this is done, you are then able to Align the skills in your workforce to limit the number of errors in the system. The Talent Audit will allow you to Align the training to needed skills and reduce the number of skill gaps in the management force.
Hirees Class Year One
Processes and Tools
Potential TQSalesM Results
copyright © Chally Group Worldwide www.chally.com4
The Customer Audit collects detailed evaluations of the performance effectiveness of each salesperson from a meaningful sample of their customers compared to competitors, as well as share of wallet. This data provides a valuable source of feedback in regards to each salesperson’s effectiveness. The most noticeable and measurable improvement will come from replacing salespeople who have turned over with above-average sales performers.
Now that you have the basics, it is time to begin the simulation. Calculating the ROI of a talent management system is a difficult matter that requires various pieces of information gathered over the course of the implementation cycle. The key contributors to ROI in the first year are turnover reduction, training improvements, and reduction in administrative costs.
The first question that we must answer is how many people Chally will recommend for hire. This will vary by the amount of company turnover. The best estimate of the turnover for salespeople is 40% (Alexander, Bartels, & Drapeau, 2008; p. 22). Some estimates have been as high as 57% (CSO magazine article; the Sales Benchmark Index estimates 40%). Consider that the largest contributor to turnover is poor hiring practices (Alexander as cited in Hrehocik, 2007). Thus, companies with higher turnover rates will see even greater returns from a Chally investment. However, some companies do have a turnover rate lower than 40%, the best in class being 11% (Alexander as cited in Hrehocik, 2007). Based on Chally data, we have found that the turnover is disproportionately higher among poorer performers.
The second question that must be answered is how much turnover will be comprised of poor performers. The largest ROI will occur by replacing the poorer performers with Chally selected performers. Based on Chally’s data and experience, a large proportion of the poorer performers will realize they are in the wrong job and quit, or find employment elsewhere. And of course, all organizations have a procedure to move poorer performers from the organization. This simulation uses an estimate of what an organization could expect from this natural attrition. We conservatively estimate that about half of the bottom 20% of performers will turnover by the end of their first year as the ES Research group estimates that between a quarter (25%) and a third (33%) depending on the industry. In fact, more than a quarter (27%) of salespeople do not produce enough to cover their loaded employment costs (Alexander, Bartels, & Drapeau, 2008, p. 23).
Calculations using a conservative estimate of turnover (i.e., 40%) and replacing the poorer performers with Chally recommended candidates can result in an improvement of $13.04 million in improved performance (see Calculation 1).
In addition, some acceptable performers will move on or quit as well. A company may also be able to achieve increased performance among this group in the amount of $3.12 million (see Calculation 3). Thus, the cumulative result is an increase of $16.16 million.
Results Year One
Potential TQSalesM Results
copyright © Chally Group Worldwide www.chally.com5
Chally recommends that training is an important part of the overall talent management approach. Although Chally does not provide sales force training, our strategic partners do provide training with measurable results. We would estimate an improvement of 5% in output due to training. The Talent Audit tool and the Customer Audit tool can identify the needed skills for a position as well as the potential skill gaps of the applicant. This information will allow you to align the training toward the needed skills, thus improving overall effectiveness. Careful consideration of Chally’s tools will allow you to avoid less productive training situations. For example, a pharmaceutical sales organization found an increase of 2.3% (Morrow, Jarrett, & Rupinski, 1997) for the entire sales force and had negative ROI for some components of the management training once managers’ time was factored in. The important takeaway message is that to achieve the greatest possible ROI for training, an organization must plan carefully using the appropriate resources to determine a training strategy. Therefore, using the Chally estimate for training effectiveness and considering training for the middle 60% of the sales force (as recommended by the Sales Executive Council; Winer & Gschwandtner, 2007), we would expect a gain of $4.5 million (see calculation 5) in sales revenue.
Better selection practices lead to a reduction in turnover. The administrative costs of hiring new people are a significant part of a budget. Reducing turnover reduces costs to the organization. We have not included the gain due to productivity that is not lost due to sales rep turnover. Furthermore, a territory that is nonproductive while a replacement sales rep is located and trained has negligible losses by comparison.
In conjunction with the selection tool, we recommend a Chally Exit Interview program, which interviews employees leaving the organization. This tool can help reduce turnover, which reduces administrative costs, training/on-boarding costs, and potential lost revenue. For our simulation, we chose to focus on the administrative costs associated with turnover to remain conservative. Using Chally’s turnover cost calculator on our simulation, (www.chally.com/turnover_cost_calculator.htm) which assumes a 200-person sales force, 40% turnover, $85,000 salary, plus 25% benefits, four interviews per open slot, and three candidates assessed, we get a savings of $592,590 for the first year after implementation (see Calculation 8 - Year One).
Conservative estimates are that the severance costs, recruiting costs, on-boarding costs, opportunity costs associated with an unproductive or vacant sales position, and the time required to get a new salesperson productive is five times the annual compensation for the individual (Alexander, Bartels, & Drapeau, 2008, p. 28).
Potential TQSalesM Results
copyright © Chally Group Worldwide www.chally.com6
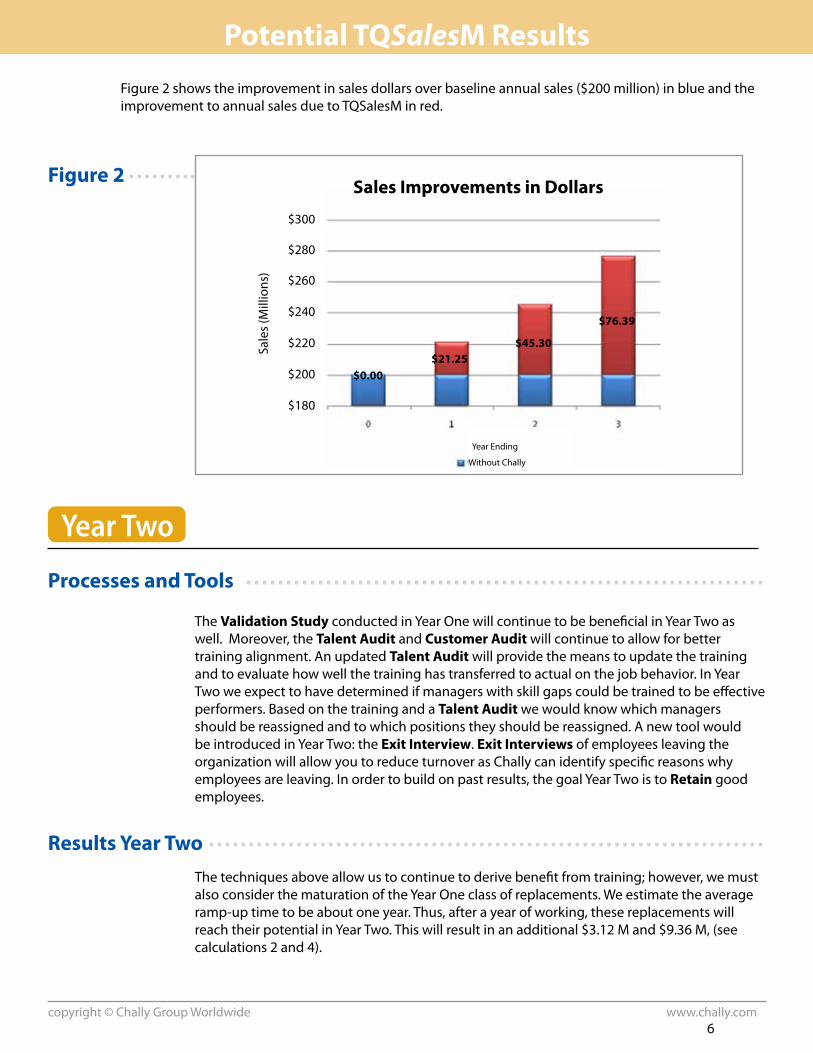
Figure 2 shows the improvement in sales dollars over baseline annual sales ($200 million) in blue and the improvement to annual sales due to TQSalesM in red.
Year Ending
Without Chally
Sales Improvements in Dollars
$300
$280
$260
$240
$220
$200
$180
$0.00$21.25
$45.30
$76.39
Sale
s (M
illio
ns)
The Validation Study conducted in Year One will continue to be beneficial in Year Two as well. Moreover, the Talent Audit and Customer Audit will continue to allow for better training alignment. An updated Talent Audit will provide the means to update the training and to evaluate how well the training has transferred to actual on the job behavior. In Year Two we expect to have determined if managers with skill gaps could be trained to be effective performers. Based on the training and a Talent Audit we would know which managers should be reassigned and to which positions they should be reassigned. A new tool would be introduced in Year Two: the Exit Interview. Exit Interviews of employees leaving the organization will allow you to reduce turnover as Chally can identify specific reasons why employees are leaving. In order to build on past results, the goal Year Two is to Retain good employees.
The techniques above allow us to continue to derive benefit from training; however, we must also consider the maturation of the Year One class of replacements. We estimate the average ramp-up time to be about one year. Thus, after a year of working, these replacements will reach their potential in Year Two. This will result in an additional $3.12 M and $9.36 M, (see calculations 2 and 4).
Year Two
Processes and Tools
Results Year Two
Figure 2
Potential TQSalesM Results
copyright © Chally Group Worldwide www.chally.com7
The overall goal of Year Three is to Develop your existing employees. You have been able to reduce most of the skill gap errors and have achieved a higher level of output. You have shifted the performance curve to the point where performance that was once acceptable is no longer acceptable. In order to maintain continuous improvement you must Revalidate to ensure you are selecting the skills that are differentiating above average with the new class of below-average performers (which was previously considered average performance). The Talent Audit must be updated because you have a better performing incumbent pool due to the influx of new hires with strong skill sets. You will continue to update training guided by a Customer Audit, and of course, replace salespeople who have turned over with applicants who possess the skill set that will lead to success.
In Year Two, Chally recommends adding a Talent Audit. This process can help an organization take stock of bench strength and identify training needs. By having Chally Assessment data on managers, you should be able to improve the effectiveness of the managers through targeted training for maximum effectiveness. Morrow, Jarrett, and Rupinski (1997) found that when the cost of managers’ time was factored in, some training actually had a negative ROI. This highlights the need to target the training to the right people to ensure that the manager’s time is not wasted. In addition, a Talent Audit can help identify who would become good managers, which would increase the effectiveness of your sales managers. The Talent Audit would also be a useful tool for guiding the training of managers. We would estimate that manager training could increase sales force productivity by 3%. In addition, the Talent Audit should help guide the selection of managers internally, which could result in an additional 2% gain in sales force productivity. Thus, the sales force training in year two should provide an 8% gain and an additional 2% gain for better managers. We should note that as you have a new and improved middle 60%, the increased production is higher. Thus, we predict an increase of $9.762 million (see calculation 6).
There will be additional savings in turnover administrative costs in Year Two. The Exit Interview is a key tool to allow you to continue reducing turnover at the same rate. These cost reductions will be smaller, as you have less turnover. Thus, in Year Two the savings prediction of $509,725 (see calculation 8 - Year Two).
In Year three, the 2nd year class will be higher on their learning curve, and Chally predicts an additional improvement of an additional $3.12 million and $9.36 million (see Calculations 2 and 4). In Year Three you should have replaced virtually all of the poorest performers (the bottom 20%) from Year One. Therefore, you will not see as large of an impact because you are now replacing average performers. Thus, you will see increased performance in the amount of $3.12 million. Your total Sales Growth improved due to selection will be $15.60 million.
The effects of training will be difficult to maintain. As mentioned previously, a tool that can help maintain or improve the effectiveness of training is the Customer Audit. Chally suggests that conducting a Customer Audit can help ensure training effectiveness is maintained.
Year Three
Processes and Tools
Results Year Three
Potential TQSalesM Results
copyright © Chally Group Worldwide www.chally.com8
Annual Sales Improvement in % Over Previous Year
Year Ending
% o
f Gro
ss S
ales
140%
130%
120%
110%
100%
90%
0.00%10.63%
10.87%
12.67%
Previous % Year Gross Sales
Year Ending
In Year Four Chally will identify which of the new people brought into the organization have a high potential to take a leadership position. After promotion, this will result in vacancies in sales territories that must be filled. In addition, after such dramatic growth, the organization will likely seek to expand into new markets. At this point, the company would likely reorganize, necessitating repeating the procedures from Years One – Three.
Chally has laid out a pretty ambitious schedule, with a lot of changes. It is likely difficult for an organization to fully implement all of these proposed changes in four years. However, it should be apparent that implementation of any of these tools can increase performance dramatically. We suggest that Year Four would be a time of taking stock and changing perspective. The above changes should set up an organization for expansion into new markets, or at the very least, a new definition of performance level. In either case, the organization would likely start the process again whether it be to bring an expansion to full effectiveness, or to redefine its sales force.
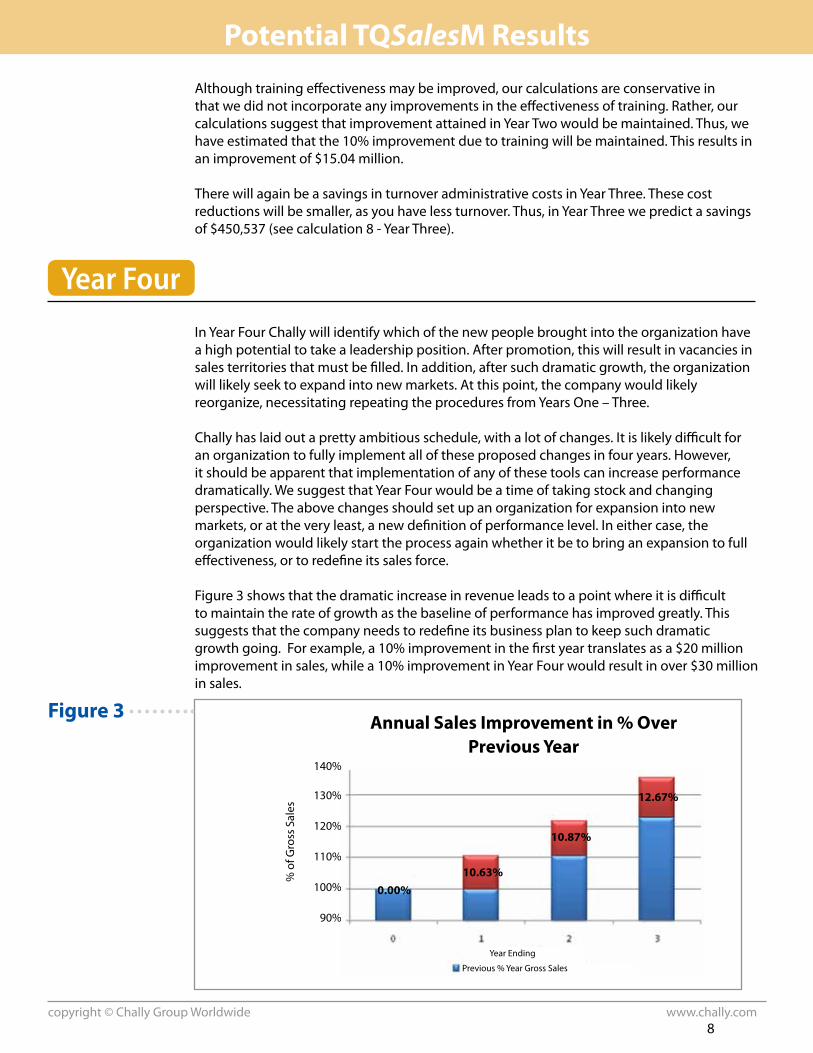
Figure 3 shows that the dramatic increase in revenue leads to a point where it is difficult to maintain the rate of growth as the baseline of performance has improved greatly. This suggests that the company needs to redefine its business plan to keep such dramatic growth going. For example, a 10% improvement in the first year translates as a $20 million improvement in sales, while a 10% improvement in Year Four would result in over $30 million in sales.
Although training effectiveness may be improved, our calculations are conservative in that we did not incorporate any improvements in the effectiveness of training. Rather, our calculations suggest that improvement attained in Year Two would be maintained. Thus, we have estimated that the 10% improvement due to training will be maintained. This results in an improvement of $15.04 million.
There will again be a savings in turnover administrative costs in Year Three. These cost reductions will be smaller, as you have less turnover. Thus, in Year Three we predict a savings of $450,537 (see calculation 8 - Year Three).
Year Four
Figure 3
Potential TQSalesM Results
copyright © Chally Group Worldwide www.chally.com9
The following background assumptions underlie the simulation. Various starting points or benchmarks had to be determined. The following document details how Chally arrived at the figures in this document. In many cases, the information was corroborated with Chally data as well. Where doubt existed, we went with what would lead to the more conservative performance prediction, or the estimate that would lead to the smaller dollar estimate.
Markets, companies, and industries all vary. Consequently, there will be variability in the performance increases obtained. We chose more conservative estimates so that a company would be more likely to outperform the estimate rather than underperform.
1) Ramp-up time for new salesperson is one year
One assumption was how long it takes a new salesperson to reach peak productivity. If we were to assume that new salespeople could perform to their potential immediately, the Chally predictive performance level would be higher, than if we assumed that it took a period of time to reach peak potential.
CSO Insights provided the best estimate of salesperson ramp up. It was based on a questionnaire of 325 companies across industries. The data was presented in bands, not a mathematical average. It was followed up with Chally data and the opinion of knowledgeable people in the field. We used one year as the ramp-up period. The CSO Insights estimate is that 75% of salespeople will ramp up in one year or less.
2) The distribution for sales is not normally distributed – not a bell shaped curve
Many researchers assume the performance distribution follows the normal, bell shaped curve. This implies that the mathematical average is at the 50th percentile. It also assumes that there are an equal number of people making say 150% of the average salesperson and 50% of the average salesperson. In reality, the true performance distribution is skewed and highly variable. The true distribution is shifted to the right, such that there are fewer below-average performers. This may be because poorer performers are more likely to leave the organization. We used the Chally database to identify the dataset which best exemplified this distribution. It is interesting to note that the data sets that are more recent in nature are becoming more variable.
Mean = 1,798,982Standard Deviation = 1,844,018Number of Salespeople = 93Bottom 20% = 19, Middle 60% = 55, Top 20% = 19
Bottom 20% produce 6,086,471 or average of $300,000Middle 60% produce 89,923,431 or average of $1.5 MillionTop 20% produce 103,990,191 Million or average of $5.2 Million
Z score of .66SD = .412 (used for utility analysis)
In order to standardize to a sales force of 200 with TOTAL production of 200 Million for the White Paper, divided by 1.19542
ThusBottom 20% = $150,000 x 40 salespeople = $6 MillionMiddle 60% = $750,000 x 120 salespeople = $90 MillionTop 20% = $2.6 Million x 40 salespeople = $104 Million
Using actual data, standardized to 200:200:50th Percentile person = $660,00035th Percentile person = $491,17265th Percentile Person = $852,000
Background Assumptions
Potential TQSalesM Results
copyright © Chally Group Worldwide www.chally.com10
3) Turnover
The amount of turnover will vary by industry and employer. A CSO Magazine article used census data figures and found that annual turnover was 57%. One issue with using census data is that the data was for the “business services” subcategory. Thus, jobs other than sales were included. In addition, we believe that the sales jobs were mainly entry level, which may inflate the amount of turnover. We believe that the estimate of 57%, while rationally deduced, likely represents the high end of turnover.
The Sales Benchmark Index estimate of the turnover for salespeople is 40% (Alexander, Bartels, & Drapeau, 2008; p. 22), with the best in industry being 11%. The higher the turnover level, the more people the organization replaces with higher performers, the larger ROI will be achieved. Conversely, the lower the turnover, the lower the ROI. We suggest that turnover would fall somewhere between 11% and 57%, with 40% being a reasonable estimate. Based on Chally Exit Interview data, 40% seems to be a reasonable estimate.
The question of whether the people who leave were good or poor performers was addressed with Chally Exit Interview data. We estimate that about half of the turnover was among poor performers. People who are poor performers are more likely to be forcibly separated from an employer and leave of their own accord. Variable compensation plans provide an incentive for a top salesperson to stay with the current employer. Starting over and getting new clients would represent serious start-up time and opportunity costs. We have estimated that one half of the turnover comes from the bottom 20% and the other half are average performers.
4) Utility Analysis
The Brogden-Cronbach-Gleser Model (Brogden, 1949; Cronbach & Gleser, 1965) was used for the Utility Analysis.
Unstandardized Interview = .20Personality = .20 Personality + Interview = .22Cortina, Goldstein, Payne, Davidson, Gilliland (2000)
Chally = .60Chally + Structured Interview = .77 (Cortina)
SDy = Standard Deviation of Job Performance = $922,000Zx = .41
Potential TQSalesM Results
copyright © Chally Group Worldwide www.chally.com11
Calculation 1Replacing half of the bottom 20%, first year.Chally replacement = average performance ($750,000) + 25% of improvement figured from Utility Analysis ($291K x .25 = $72,770) – 25% Utility Analysis Improvement with personality + unstructured interview (83.16 x .25 = 20.79 ) =750,000 + 72,770 – 20,790 x 20 = 750,000 + 51,980 x 20 = 801,980 =802K802K x 20 = 16.04 Million – (150K x 20; production of 20 low 20% replaced) = $13.040 MillionNote: Repeated in Year Two with Second group of rest of low 20%
Calculation 2Replacing half of the bottom 20%, second year.Thus Year Two will also see an improvement of = $13.040 MillionIn addition, see other 75% of improvement on Year One Chally replacement291K x .75 = $218,310 – 62,317 x 20 people = $3.12 MillionAlso in Year Three for those replaced in Year Two
Calculation 3Replacing individuals that are producing higher than the bottom 20%, first year.Replace for those not in Bottom 20% - assume average performance802K – 750K x 60 = $3.120 Million
Calculation 4Replacing individuals that are producing higher than the bottom 20%, second year.Year 2 will see the other 75% after ramp up291K x .75 = $218,250 – 62,317 x 60 people = $9.36 MillionAlso Year 2 replaced for years 2 + 3
Calculation 5Train the middle 60% (as suggested by the Sales Executive Council).90 Million (production of middle 60%) x 5% = $4.5 Million
Calculation 6Train the middle 60% with a more effective training program due to including the results of the talent audit on managers and salespeople.Training Year TwoAfter Talent Audit5% training3% Trained Manager2% Better Managers due to Talent AuditTotal of 10% for trainingNow 60% production of 90 Million + 3.12 Million (calculation 3) + 4.5 Million (calculation 5)97.62 x .10 = $9.762 Million
Calculation 7The training effectiveness will increase as the same percentage return (10%) is now calculated on a more effective sales force.Training Year ThreeAfter Talent Audit5% training3% Trained Manager2% Better Managers due to Talent AuditTotal of 10% for trainingNow 60% production of 90 Million + 4.5 Million (Calc 5) + 3.12 (calculation 2) + 3.12 (calculation 3) + 9.36 (calculation 4) = 110.1 Million x .1 = $11.01 Million
Calculation 8 - Year OneChally Turnover Calculator – see website for calculation.N = 200, 40% Turnover, $85,000 = salary, 25% benefits, 4 interviewed, 3 candidates assessed$592,590
Calculation 8 - Year TwoChally Turnover Calculator – see website for calculation.N = 188, 40% Turnover, $85,000 = salary, 25% benefits, 4 interviewed, 3 candidates assessed$509,725
N = 200 – (40 x.7 = 28) = 172
Calculation 8 - Year ThreeChally Turnover Calculator – see website for calculation.N = , 40% Turnover, $85,000 = salary, 25% benefits, 4 interviewed, 3 candidates assessedN = 200 – (40 x.7 x.7 = 19.6) = 152$450,537
Calculation Assumptions:
• The average performer sells $750,000 per year.• There is a one-year ramp-up time to meet optimum
performance. Chally recommended replacements will not achieve their complete improved performance level until Year Two, but will achieve 25% of the increased performance in Year One. The performance level achieved is then calculated with the Utility Analysis.
Assumptions
Potential TQSalesM Results
copyright © Chally Group Worldwide www.chally.com12
Alexander, G., Bartels, A., & Drapeau, M. (2008). How to Use Sales Benchmarking to Drive Performance: Making the Number. Penguin Group: New York, NY.
Cortina, J. M., Goldstein, N. B., Payne, S. C., Davison, H. K., & Gilliland, S. W. (2000). The incremental validity of interview scores over and above cognitive ability and conscientiousness scores. Personnel Psychology, 53, 325-351.
Dickie (2007). 2007 Sales Effectiveness Best Practices Analysis Study. Self published White Paper: CSO Insights. P. 8
Dickie, & Trailer (2007). Demystifying the Sales Effectiveness Challenge: What’s Really Working and How Often Are We Doing It. Self published White Paper: CSO Insights. See page 3.
Hrehocik, M. (2007, October 1). The Best Sales Force: Finding, Keeping, Grooming. Managesmarter.com.
Morrow, C. C., Jarrett, M. Q., Rupinski, M. T. (1997). An investigation of the effect and economic utility of corporate wide training. Personnel Psychology, 50, 91-119.
Winer, B., & Gschwandtner, G. (2007). Winning Formula. Selling Power, October, 84-88.
References


TQSalesM_10001.3
Copyright © Chally Group Worldwide
3123 Research Blvd Dayton, OH 45420
WORLDWIDE
937.259.1200 800.254.5995 www.chally.com
There are many common challenges to successful talent management in today’s organizations. A Six Sigma/Total Quality Management approach that uses talent audit research and an associated actuarial database can help minimize those challenges. TQSalesM helps identify the skills and behaviors that distinguish top performers from poor performers, ensures an accurate job match of the right jobs to the right people, improves succession planning, provides high levels of job satisfaction, and correctly identifies training needs.
Summary


![TQ - bonfiglioli.com (Drive Service ... nominal torque Mn 2 [nm] TQ 060 TQ 070 TQ 090 TQ 130 TQ 160 30 70 200 400 800. 7 IP65 degree protection universal design ... no matter where](https://img.pdfslide.net/doc/110x75/5addd7837f8b9a213e8d4fa6/tq-drive-service-nominal-torque-mn-2-nm-tq-060-tq-070-tq-090-tq-130-tq.jpg)