Embed Size (px)
Citation preview
TRANSFORMATIONAL MARKETING MIX
OPTIMIZATION USING A VIRTUAL
MARKETPLACE
Jeffrey Maloy, Senior Vice President and Chief Marketing Officer
Tuesday, June 18, 2013
2
WELCOME!
2 weeks, 5 webcasts, improved marketing effectiveness
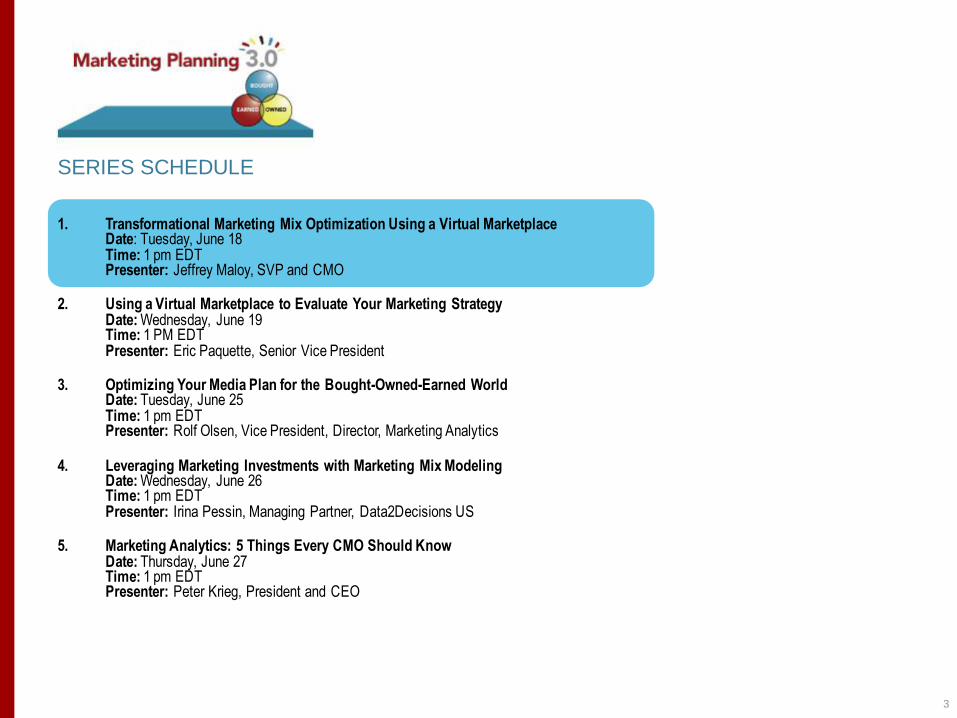
1. Transformational Marketing Mix Optimization Using a Virtual Marketplace Date: Tuesday, June 18 Time: 1 pm EDT Presenter: Jeffrey Maloy, SVP and CMO
2. Using a Virtual Marketplace to Evaluate Your Marketing Strategy Date: Wednesday, June 19 Time: 1 PM EDT Presenter: Eric Paquette, Senior Vice President
3. Optimizing Your Media Plan for the Bought-Owned-Earned World Date: Tuesday, June 25 Time: 1 pm EDT Presenter: Rolf Olsen, Vice President, Director, Marketing Analytics
4. Leveraging Marketing Investments with Marketing Mix Modeling Date: Wednesday, June 26 Time: 1 pm EDT Presenter: Irina Pessin, Managing Partner, Data2Decisions US
5. Marketing Analytics: 5 Things Every CMO Should Know Date: Thursday, June 27 Time: 1 pm EDT Presenter: Peter Krieg, President and CEO
3
SERIES SCHEDULE
For a PDF of this presentation and our advertorial on using big
data for marketing planning…
Email [email protected]
4
5
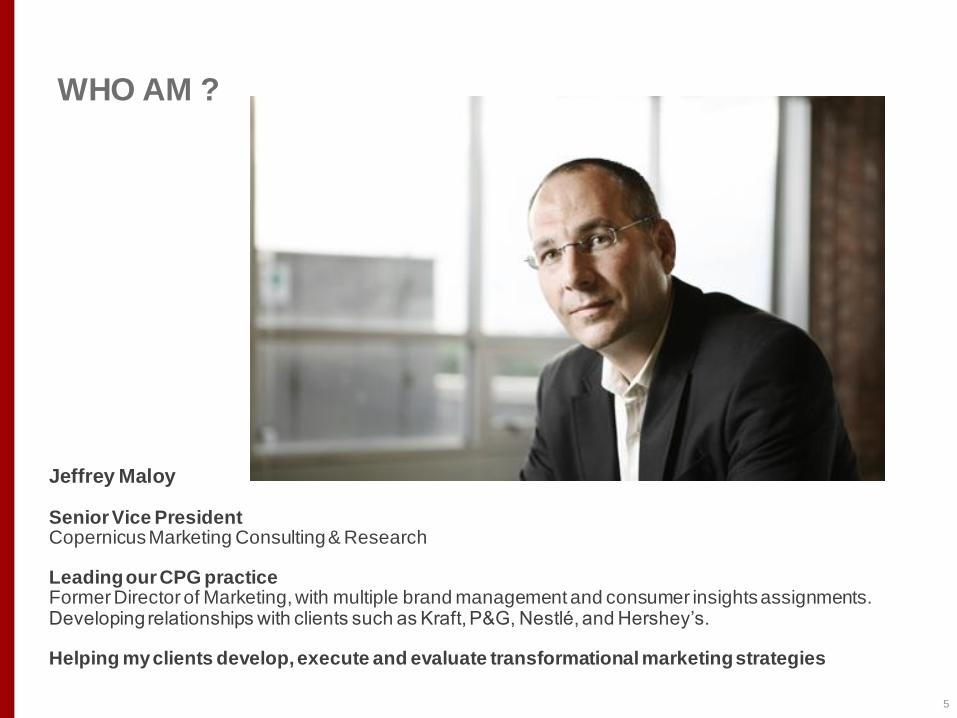
WHO AM ?
Jeffrey Maloy Senior Vice President Copernicus Marketing Consulting & Research
Leading our CPG practice Former Director of Marketing, with multiple brand management and consumer insights assignments. Developing relationships with clients such as Kraft, P&G, Nestlé, and Hershey’s. Helping my clients develop, execute and evaluate transformational marketing strategies
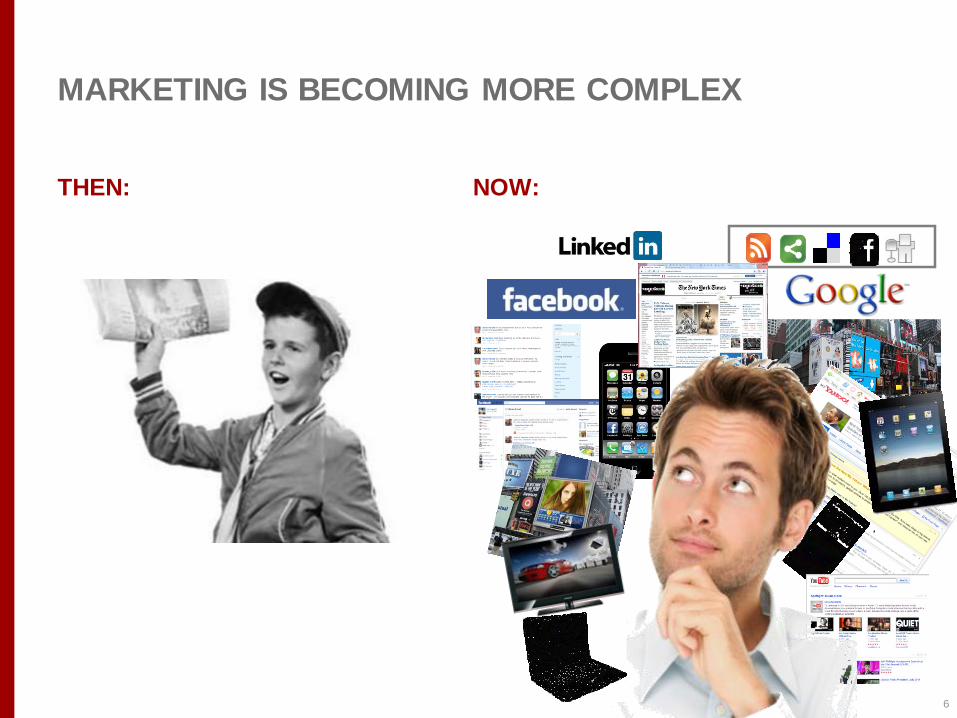
THEN: NOW:
6
MARKETING IS BECOMING MORE COMPLEX
7
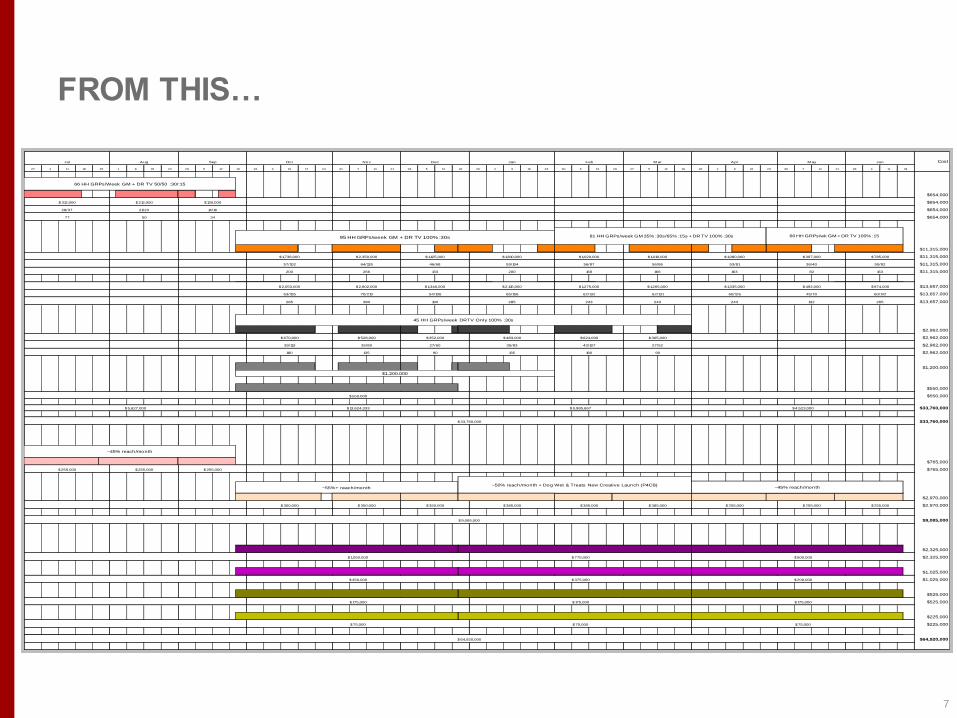
FROM THIS…
27 4 11 18 25 1 8 15 22 29 5 12 19 26 3 10 17 24 31 7 14 21 28 5 12 19 26 2 9 16 23 30 6 13 20 27 5 12 19 26 2 9 16 23 30 7 14 21 28 4 11 18
$654,000
$654,000
$654,000
$654,000
$11,315,000
$11,315,000
$11,315,000
$11,315,000
$13,657,000
$13,657,000
$13,657,000
$2,962,000
$2,962,000
$2,962,000
$2,962,000
$1,200,000
$550,000
$550,000
$33,760,000
$33,760,000
$765,000
$765,000
$2,970,000
$2,970,000
$9,085,000
$2,325,000
$2,325,000
$1,025,000
$1,025,000
$525,000
$525,000
$225,000
$225,000
$64,920,000$64,920,000
$175,000 $175,000 $175,000
$75,000 $75,000 $75,000
$1,050,000 $775,000 $500,000
$450,000 $375,000 $200,000
$9,085,000
$255,000$350,000 $385,000 $385,000 $385,000 $255,000 $255,000$350,000 $350,000
$33,760,000
$255,000 $255,000 $255,000
$550,000
$5,627,000 $13,624,333 $9,985,667 $4,523,000
135 180 90180 135 90
35/83 43/107 27/5239/113 35/89 27/60
$483,000 $624,000 $305,000$670,000 $528,000 $352,000
285 243 243 243 132 265285 380 190
65/156 62/132 62/131 60/126 45/70 60/14263/155 70/210 54/106
$2,115,000 $1,275,000 $1,265,000 $1,335,000 $492,000 $974,000$2,053,000 $2,802,000 $1,346,000
200 168 166 163 82 163200 266 133
59/104 56/87 56/86 53/81 36/40 50/8257/102 64/135 46/68
$1,810,000 $1,020,000 $1,010,000 $1,080,000 $397,000 $785,000$1,738,000 $2,350,000 $1,125,000
77 50 34
M ay Jun
28/37 21/23 14/16
$312,000 $212,000 $130,000
CostJul Aug Sep Oct Nov Dec Jan Feb M ar Apr
66 HH GRPs/Week GM + DR TV 50/50 :30/:15
95 HH GRPs/week GM + DR TV 100% :30s 81 HH GRPs/week GM 35% :30s/65% :15s + DR TV 100% :30s
$1,200,000
45 HH GRPs/week DRTV Only 100% :30s
~45% reach/month
~55%+ reach/month~50% reach/month + Dog Wet & Treats New Creative Launch (P4CB)
66 HH GRPs/wk GM + DR TV 100% :15
~45% reach/month
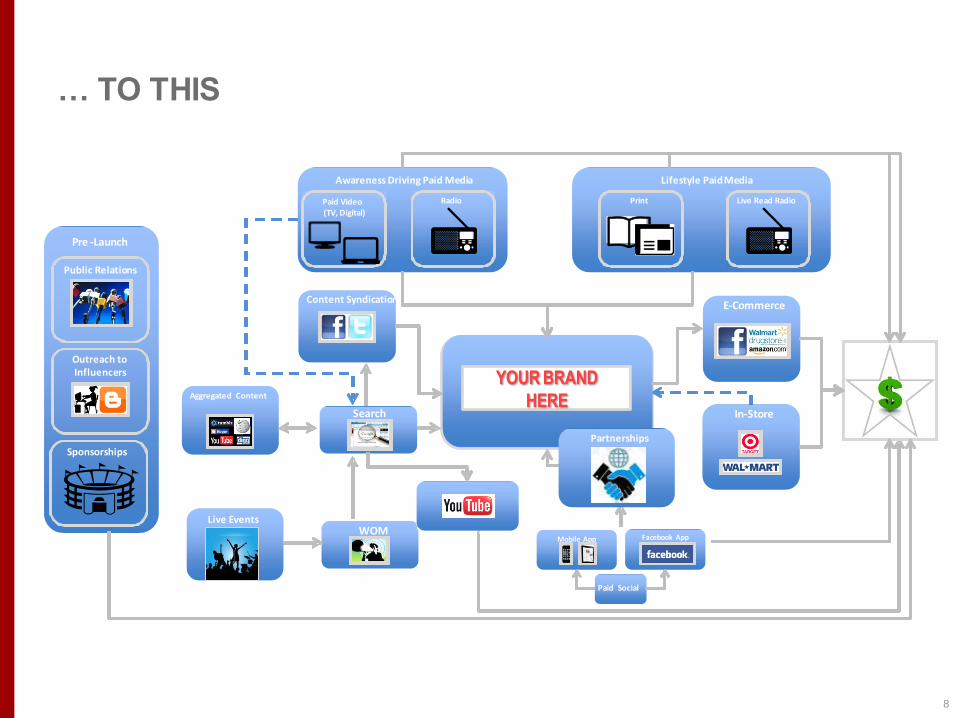
… TO THIS
8
Search
Aggregated Content
In-Store
E - Commerce Content Syndication
Pre - Launch
Public Relations
Outreach to Influencers
Sponsorships
Print Live Read Radio
Lifestyle Paid Media
Paid Video (TV, Digital)
Awareness Driving Paid Media
Radio
WOM Live Events
Paid Social
Mobile App Facebook App
Partnerships
YOUR BRAND
HERE
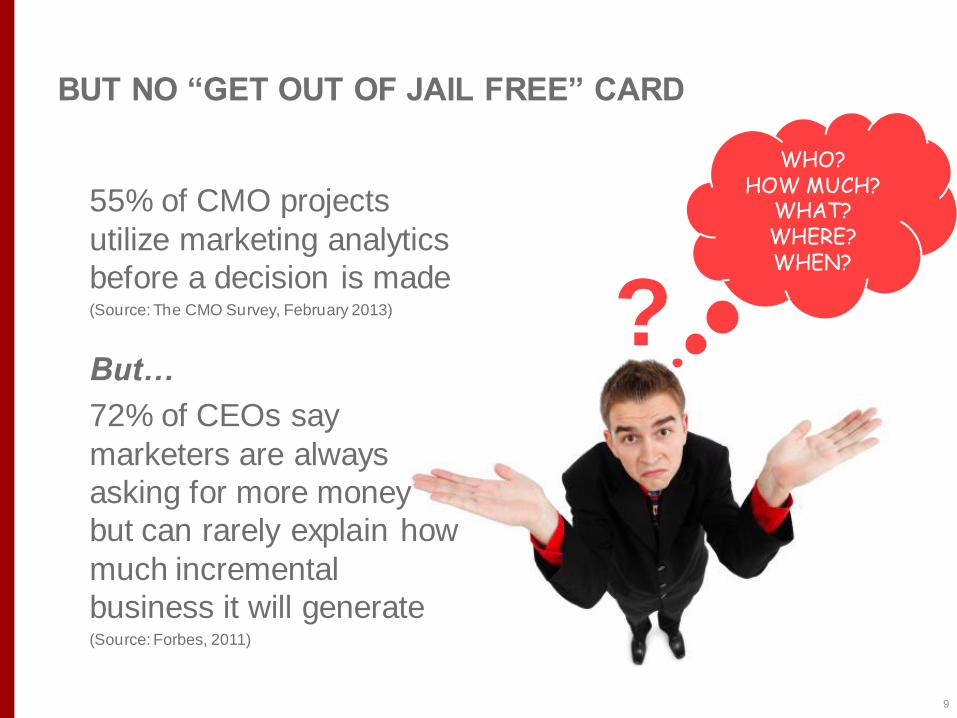
55% of CMO projects
utilize marketing analytics
before a decision is made (Source: The CMO Survey, February 2013)
But…
72% of CEOs say
marketers are always
asking for more money
but can rarely explain how
much incremental
business it will generate (Source: Forbes, 2011)
9
BUT NO “GET OUT OF JAIL FREE” CARD
?
WHO? HOW MUCH?
WHAT? WHERE? WHEN?
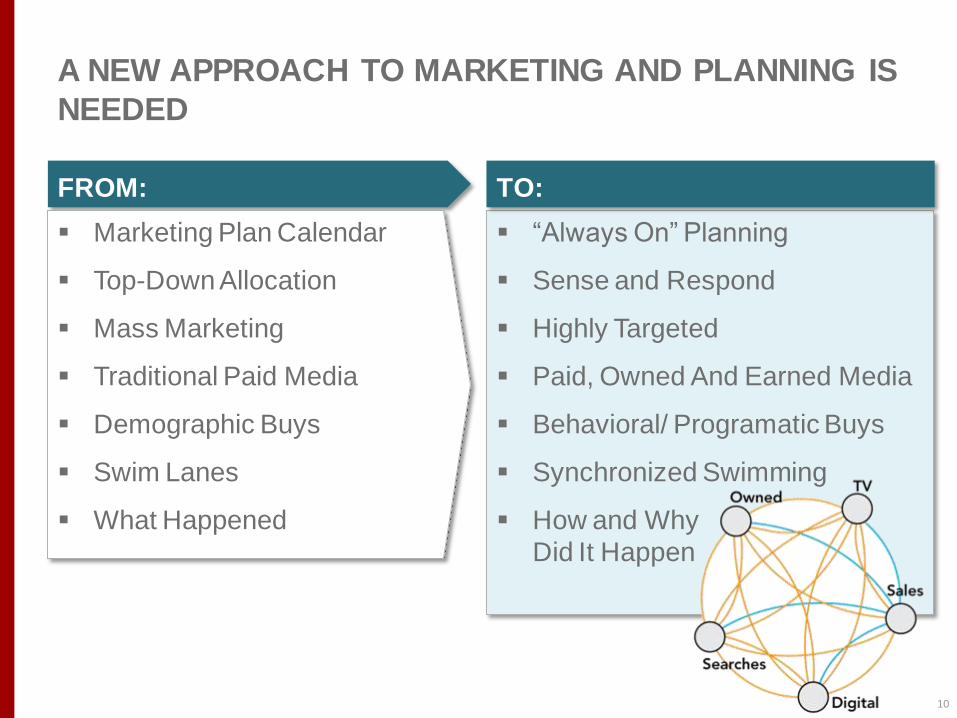
“Always On” Planning
Sense and Respond
Highly Targeted
Paid, Owned And Earned Media
Behavioral/ Programatic Buys
Synchronized Swimming
How and Why
Did It Happen
FROM:
Marketing Plan Calendar
Top-Down Allocation
Mass Marketing
Traditional Paid Media
Demographic Buys
Swim Lanes
What Happened
TO:
10
A NEW APPROACH TO MARKETING AND PLANNING IS
NEEDED
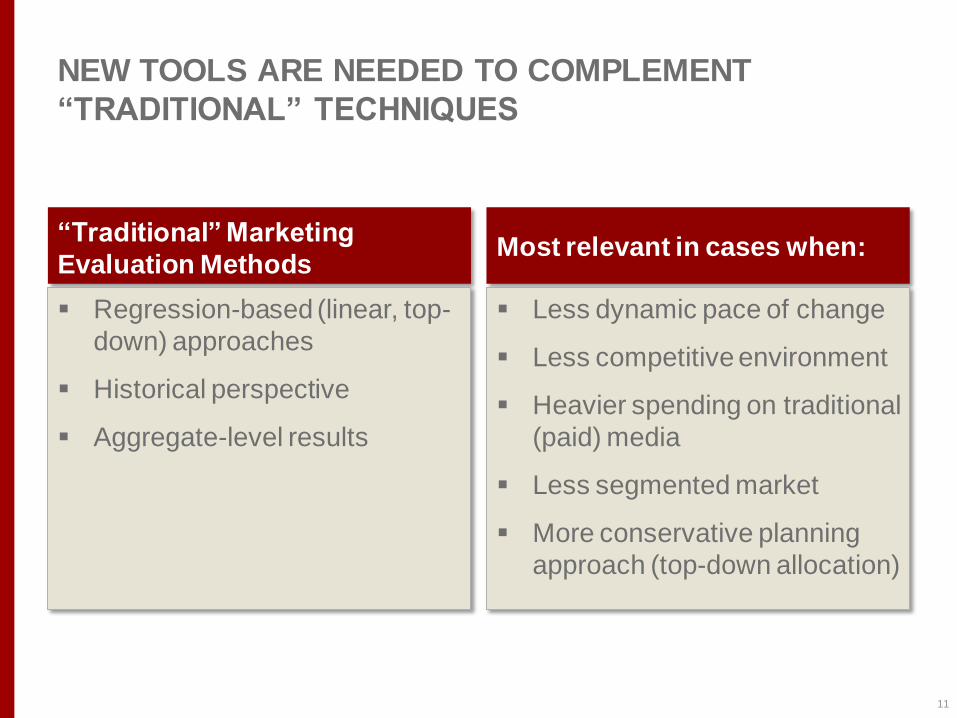
“Traditional” Marketing
Evaluation Methods
Regression-based (linear, top-
down) approaches
Historical perspective
Aggregate-level results
Most relevant in cases when:
Less dynamic pace of change
Less competitive environment
Heavier spending on traditional
(paid) media
Less segmented market
More conservative planning
approach (top-down allocation)
11
NEW TOOLS ARE NEEDED TO COMPLEMENT
“TRADITIONAL” TECHNIQUES
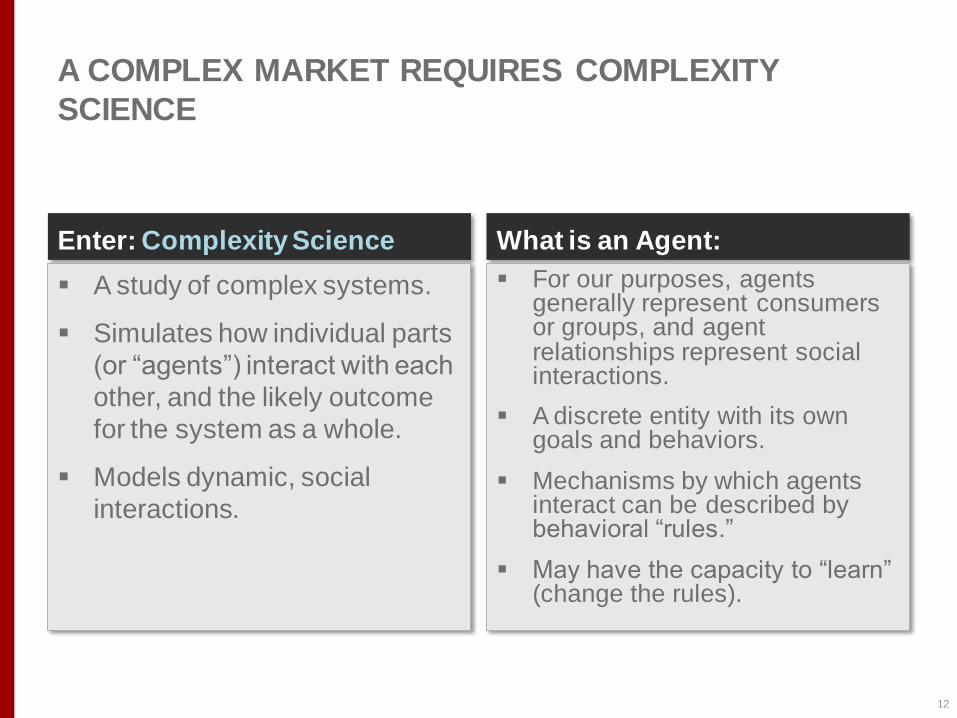
Enter: Complexity Science
A study of complex systems.
Simulates how individual parts
(or “agents”) interact with each
other, and the likely outcome
for the system as a whole.
Models dynamic, social
interactions.
What is an Agent:
For our purposes, agents generally represent consumers or groups, and agent relationships represent social interactions.
A discrete entity with its own goals and behaviors.
Mechanisms by which agents interact can be described by behavioral “rules.”
May have the capacity to “learn” (change the rules).
12
A COMPLEX MARKET REQUIRES COMPLEXITY
SCIENCE
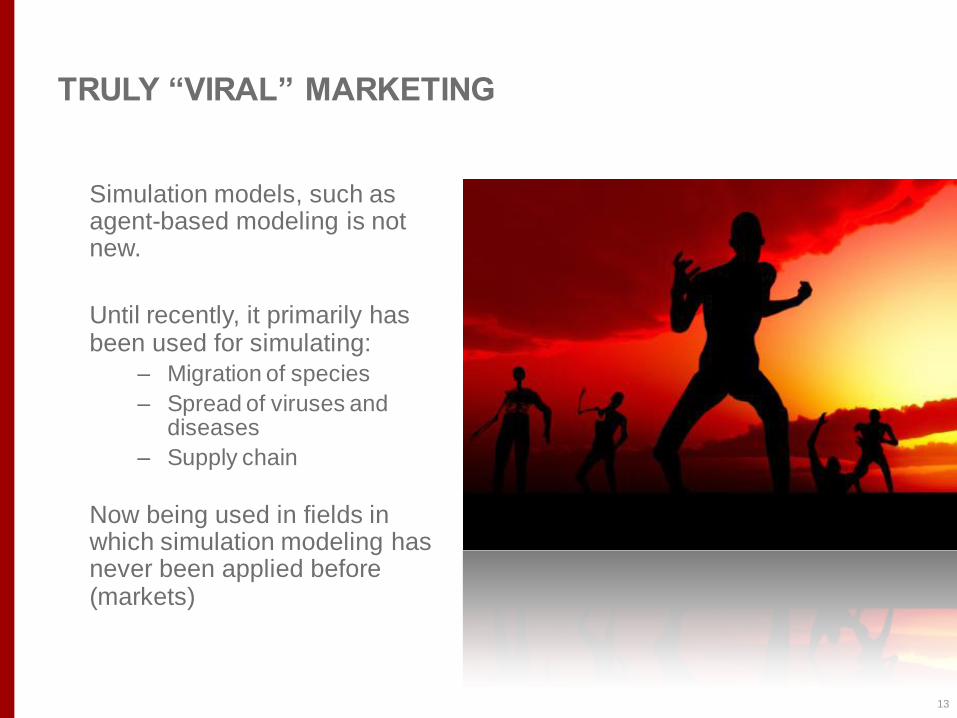
Simulation models, such as agent-based modeling is not new.
Until recently, it primarily has been used for simulating:
– Migration of species
– Spread of viruses and diseases
– Supply chain
Now being used in fields in which simulation modeling has never been applied before (markets)
13
TRULY “VIRAL” MARKETING
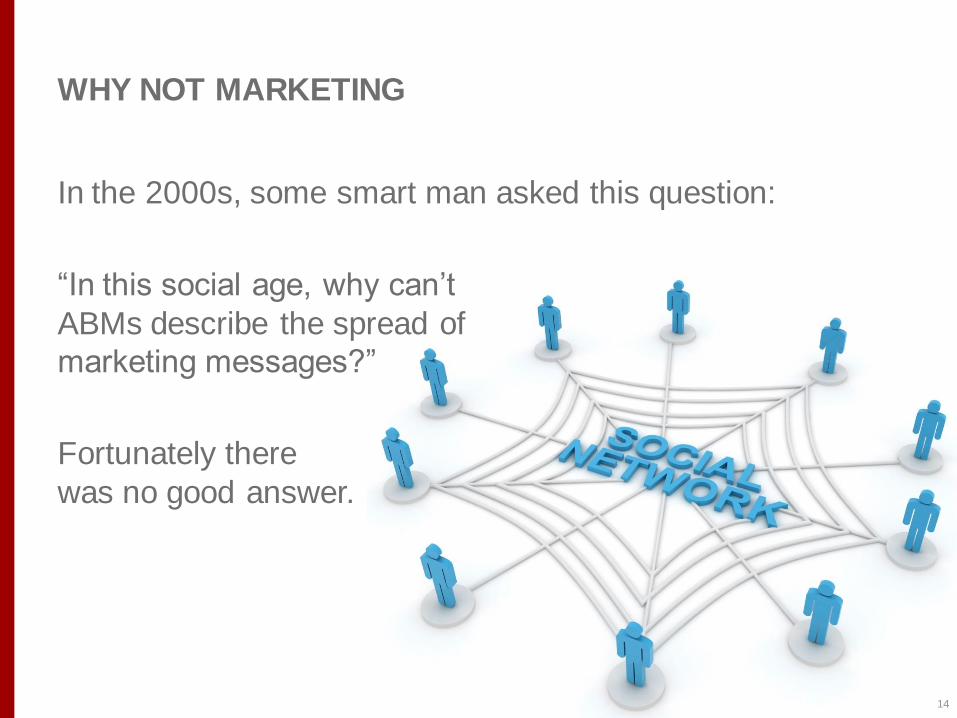
In the 2000s, some smart man asked this question:
“In this social age, why can’t
ABMs describe the spread of
marketing messages?”
Fortunately there
was no good answer.
14
WHY NOT MARKETING
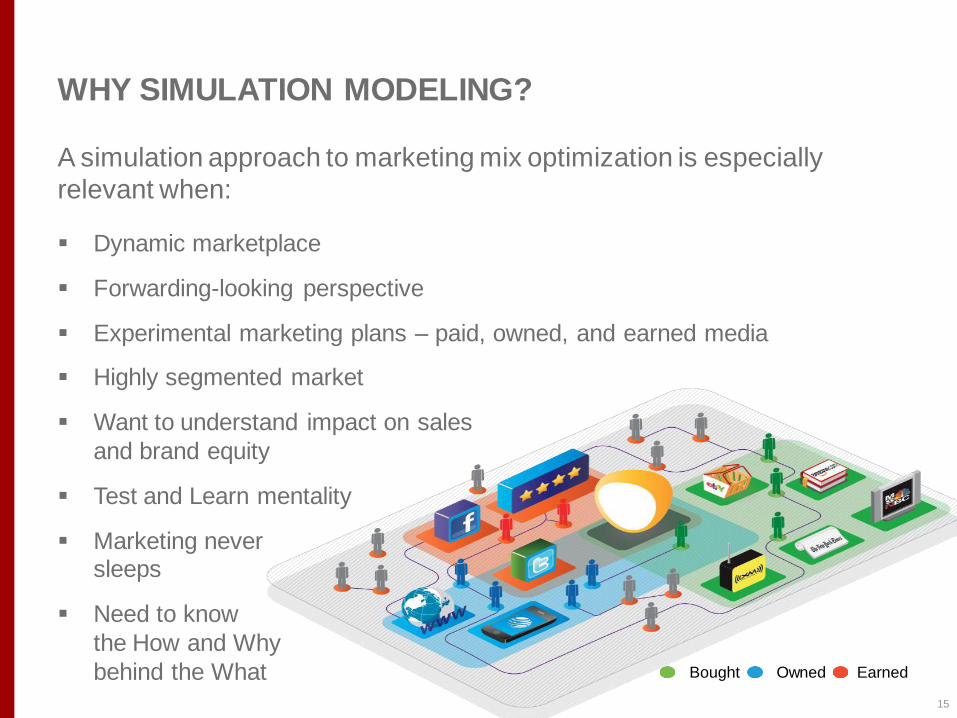
A simulation approach to marketing mix optimization is especially
relevant when:
Dynamic marketplace
Forwarding-looking perspective
Experimental marketing plans – paid, owned, and earned media
Highly segmented market
Want to understand impact on sales
and brand equity
Test and Learn mentality
Marketing never sleeps
Need to know
the How and Why
behind the What
15
WHY SIMULATION MODELING?
Bought Owned Earned
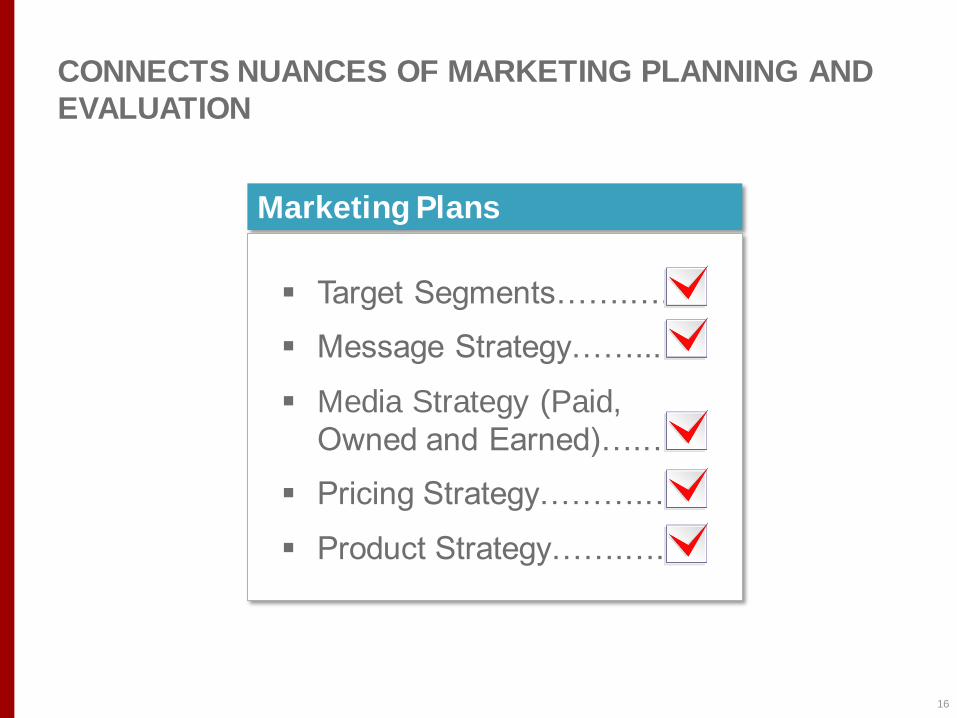
Marketing Plans
Target Segments…….….
Message Strategy……....
Media Strategy (Paid,
Owned and Earned)….…
Pricing Strategy……….…
Product Strategy…….…..
16
CONNECTS NUANCES OF MARKETING PLANNING AND
EVALUATION
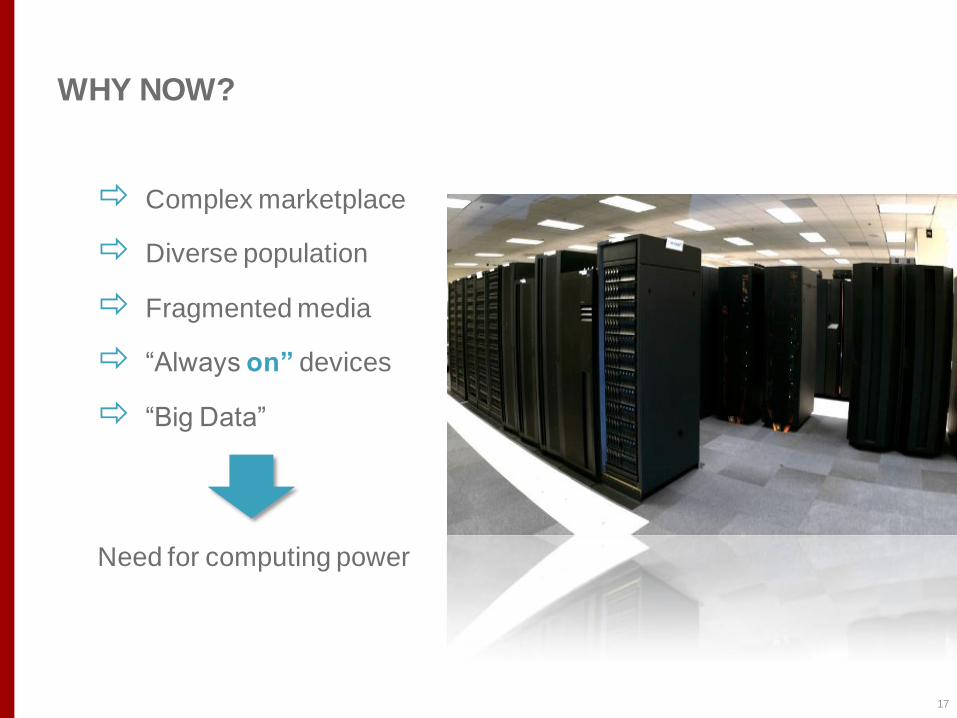
Complex marketplace
Diverse population
Fragmented media
“Always on” devices
“Big Data”
Need for computing power
17
WHY NOW?
18
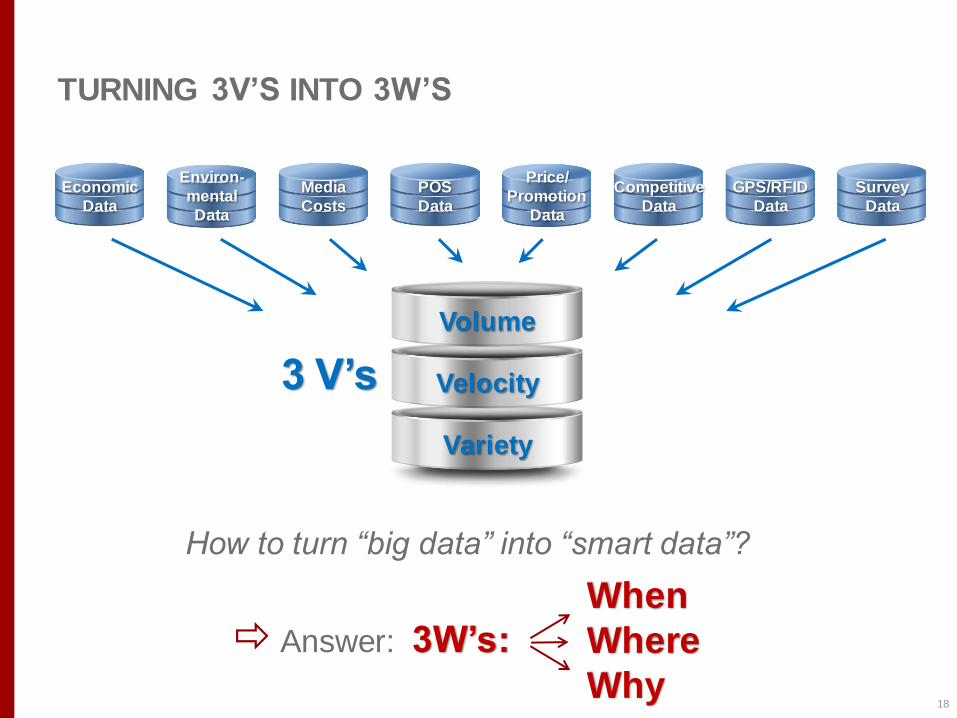
TURNING 3V’S INTO 3W’S
How to turn “big data” into “smart data”?
Answer: 3W’s:
When
Where
Why
Volume
Velocity
Variety
3 V’s
Economic
Data
Environ-
mental
Data
Media
Costs
POS
Data
Price/
Promotion
Data
Competitive
Data
GPS/RFID
Data
Survey
Data
1. Build your “simulated society”
2. Assign “rules of engagement”
3. Calibrate and validate
4. Explore new frontiers
19
SO HOW DO WE BUILD THIS AMAZING MODEL?
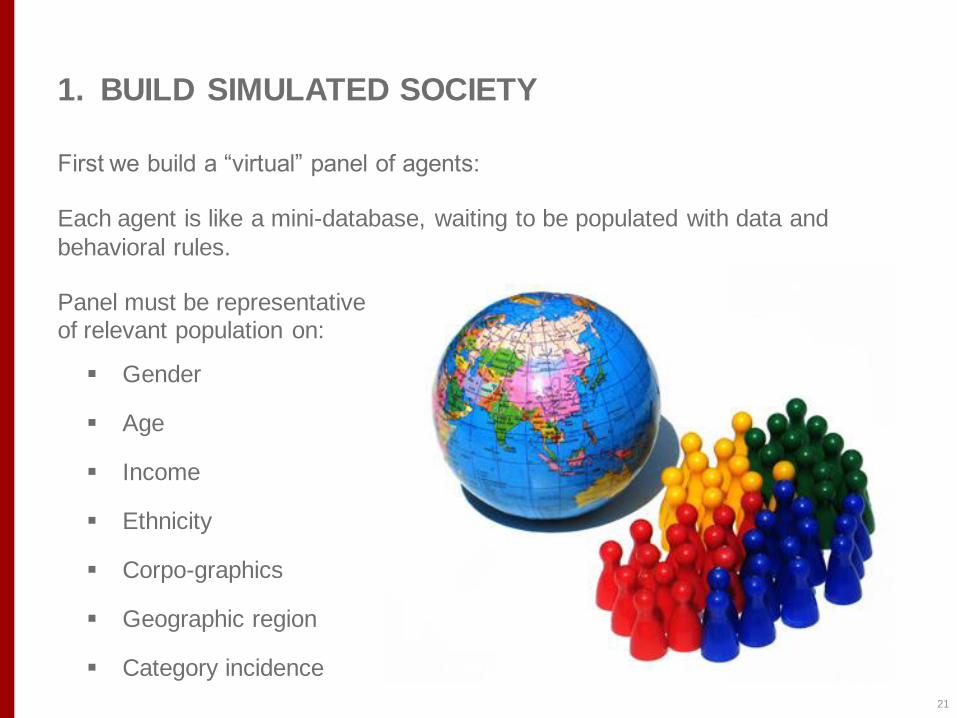
First we build a “virtual” panel of agents:
Each agent is like a mini-database, waiting to be populated with data and
behavioral rules.
Panel must be representative of relevant population on:
Gender
Age
Income
Ethnicity
Corpo-graphics
Geographic region
Category incidence
21
1. BUILD SIMULATED SOCIETY
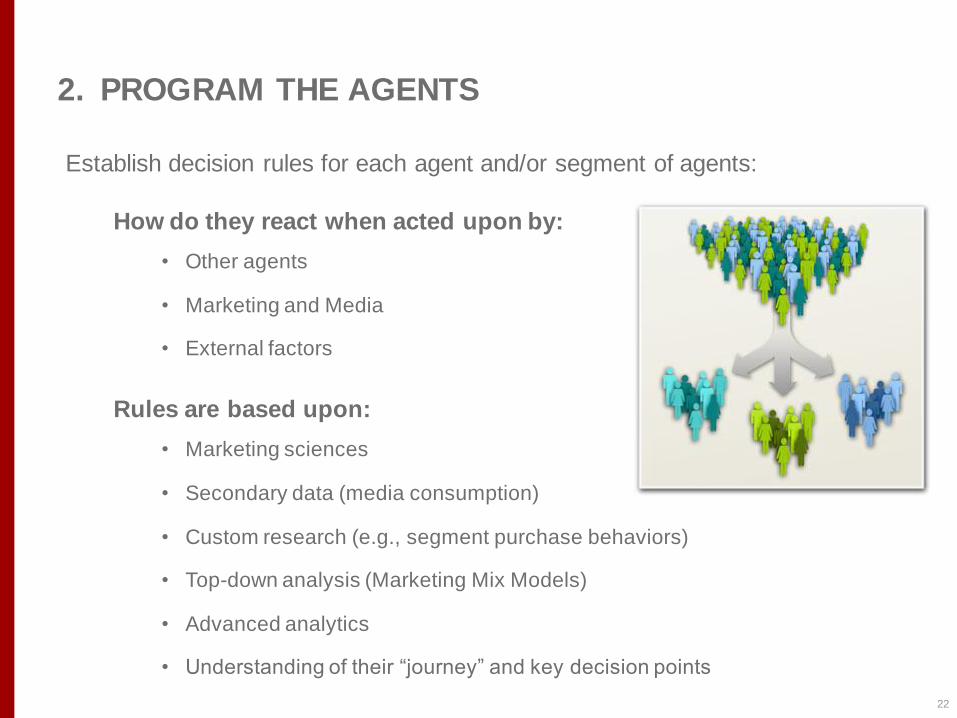
Establish decision rules for each agent and/or segment of agents:
How do they react when acted upon by:
• Other agents
• Marketing and Media
• External factors
Rules are based upon:
• Marketing sciences
• Secondary data (media consumption)
• Custom research (e.g., segment purchase behaviors)
• Top-down analysis (Marketing Mix Models)
• Advanced analytics
• Understanding of their “journey” and key decision points
22
2. PROGRAM THE AGENTS
23
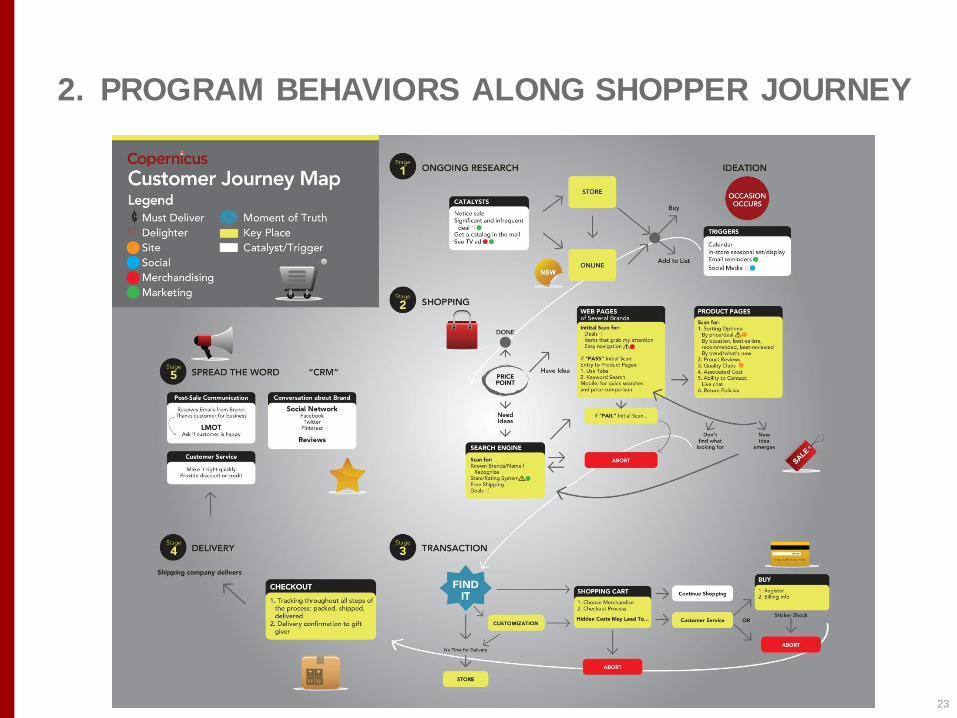
2. PROGRAM BEHAVIORS ALONG SHOPPER JOURNEY
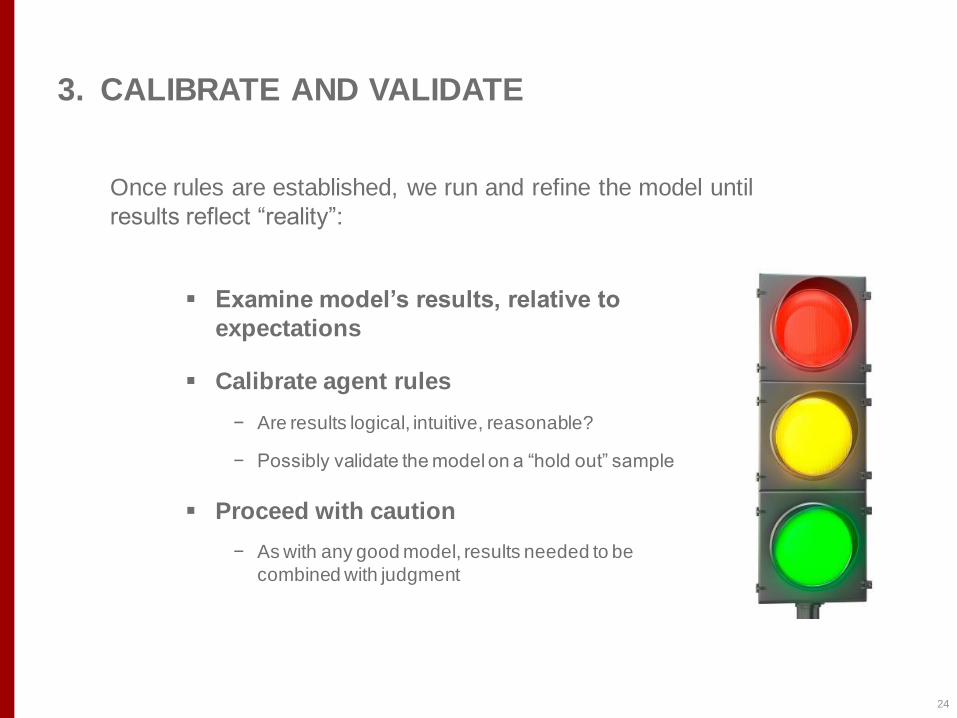
Once rules are established, we run and refine the model until
results reflect “reality”:
24
3. CALIBRATE AND VALIDATE
Examine model’s results, relative to
expectations
Calibrate agent rules
− Are results logical, intuitive, reasonable?
− Possibly validate the model on a “hold out” sample
Proceed with caution
− As with any good model, results needed to be
combined with judgment
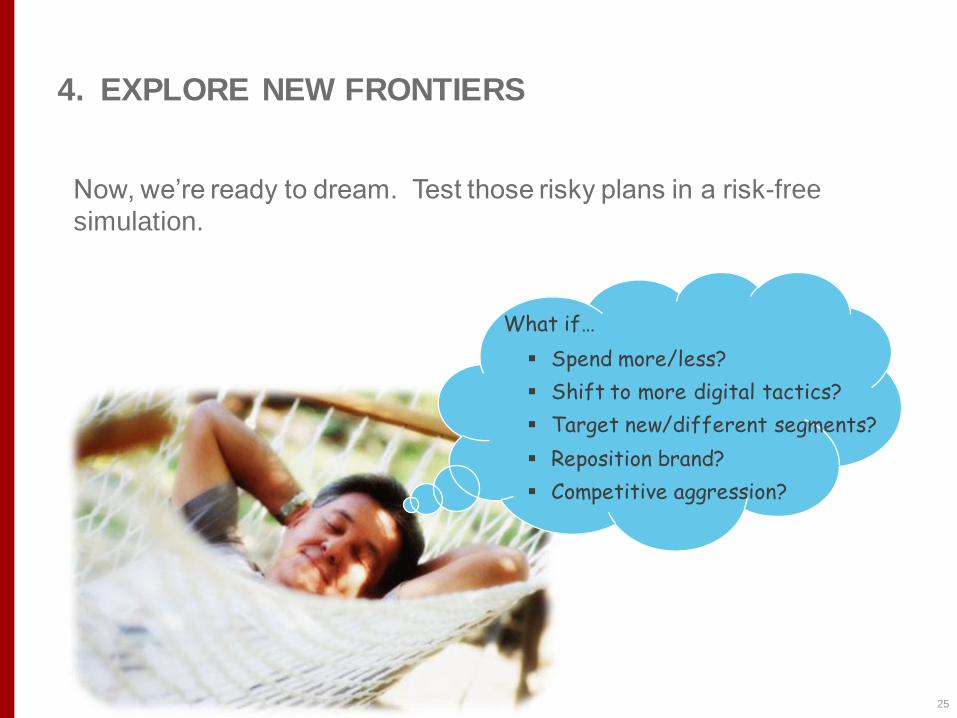
Now, we’re ready to dream. Test those risky plans in a risk-free
simulation.
25
4. EXPLORE NEW FRONTIERS
What if…
Spend more/less?
Shift to more digital tactics?
Target new/different segments?
Reposition brand?
Competitive aggression?
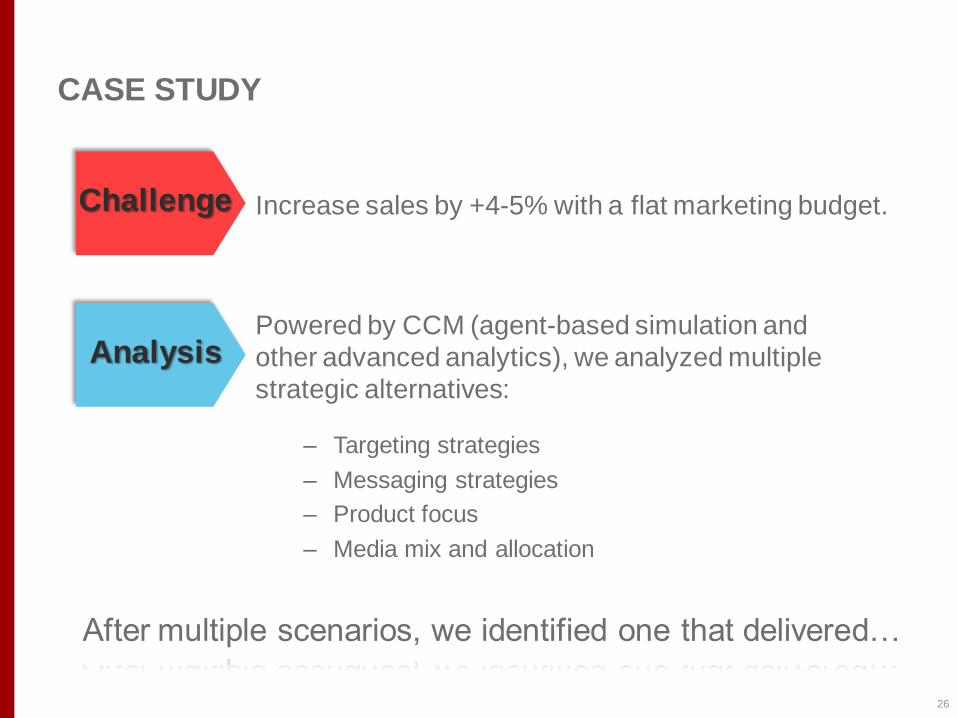
Powered by CCM (agent-based simulation and
other advanced analytics), we analyzed multiple
strategic alternatives:
– Targeting strategies
– Messaging strategies
– Product focus
– Media mix and allocation
26
CASE STUDY
After multiple scenarios, we identified one that delivered…
Challenge
Analysis
Increase sales by +4-5% with a flat marketing budget.
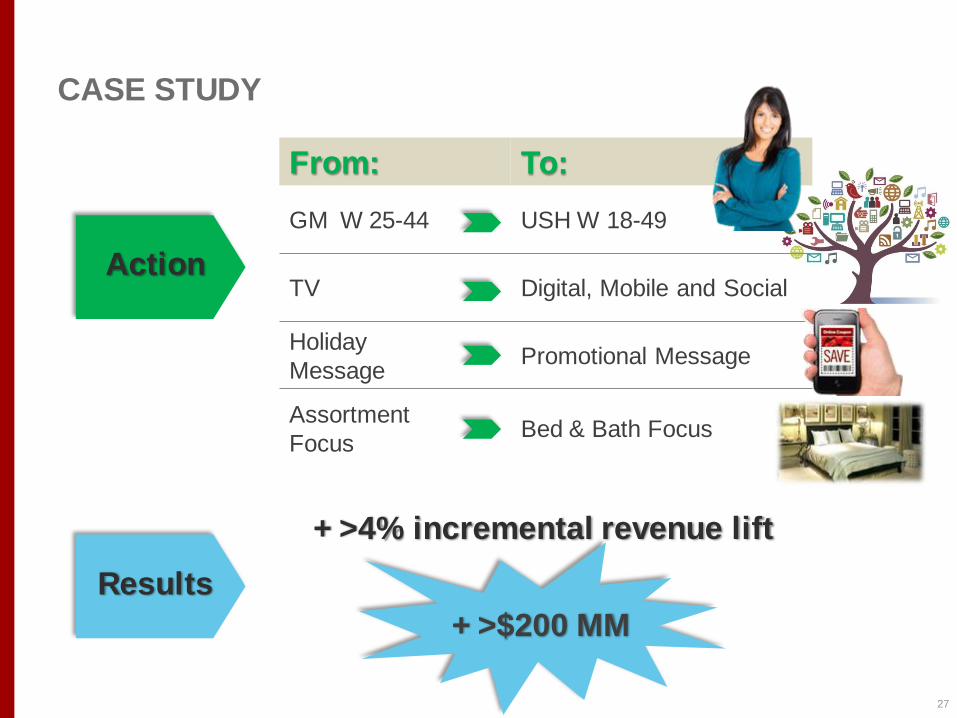
+ >$200 MM
+ >4% incremental revenue lift
27
CASE STUDY
Action
Results
From: To:
GM W 25-44 USH W 18-49
TV Digital, Mobile and Social
Holiday
Message Promotional Message
Assortment
Focus Bed & Bath Focus
1. Simulation models (such as ABMS) can be
an effective tool in the analytic toolbox
2. Complex, dynamic models for complex,
dynamic markets
3. Simulate new, “stretch” scenarios
4. Understand the “how” and “why” behind
the “what”
28
CONCLUSIONS
Questions?
For a PDF of this presentation and our advertorial on using big data for marketing planning…
Email [email protected]
29
USING A VIRTUAL MARKETPLACE TO EVALUATE
YOUR MARKETING STRATEGY
Eric Paquette, Senior Vice President
Wednesday, June 19, 2013
SAVE THE DATE (TOMORROW):

Jeffrey Maloy, Senior Vice President
(203) 831-2375
Jeff.Maloy @copernicusmarketing.com