Embed Size (px)
Citation preview
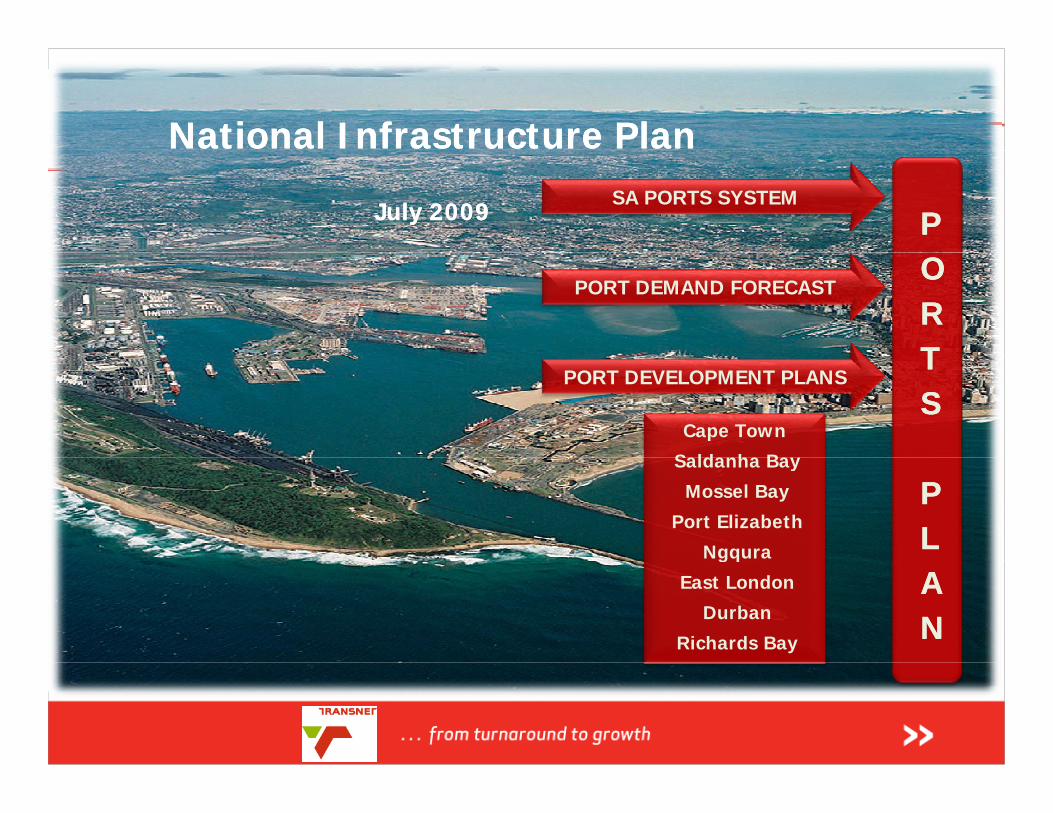
National Infrastructure National Infrastructure PlanPlan
July 2009July 2009 PPSA PORTS SYSTEM
OORRTT
PORT DEMAND FORECAST
TTSS
PORT DEVELOPMENT PLANS
Cape Town
Saldanha Bay
PPLL
Saldanha Bay
Mossel Bay
Port Elizabeth
Ngqura
AANN
gq
East London
Durban
Richards Bay
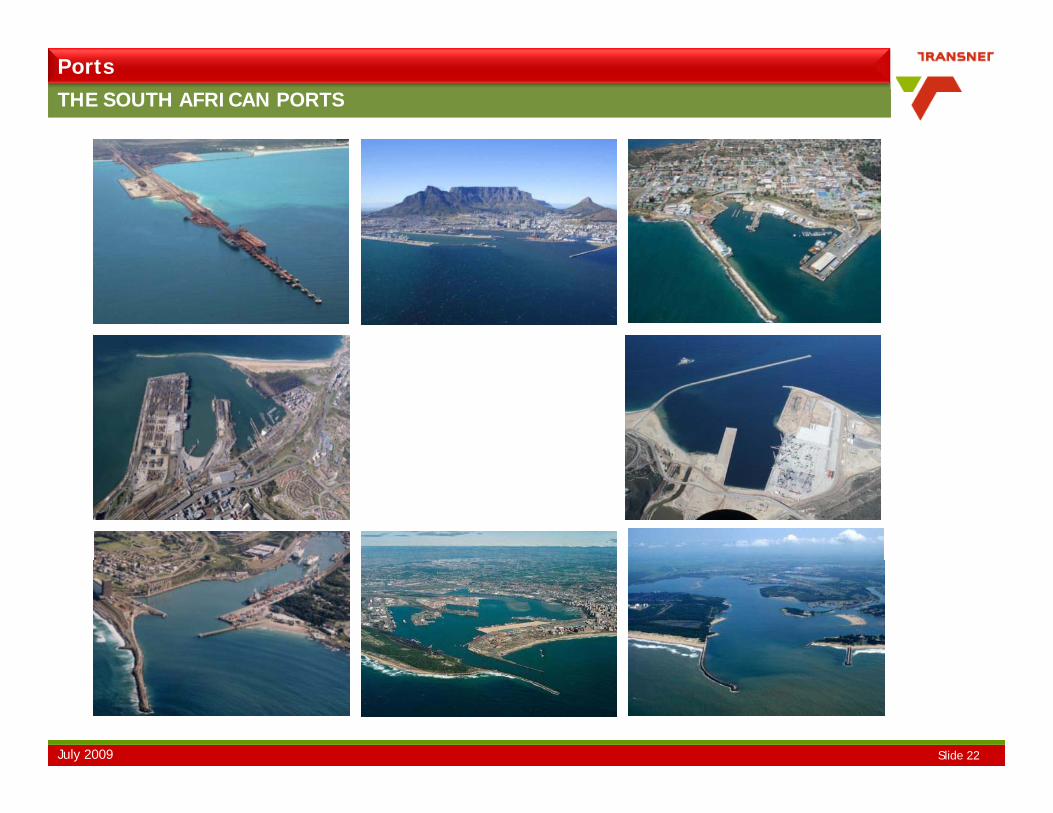
PortsTHE SOUTH AFRICAN PORTS
Slide 22July 2009
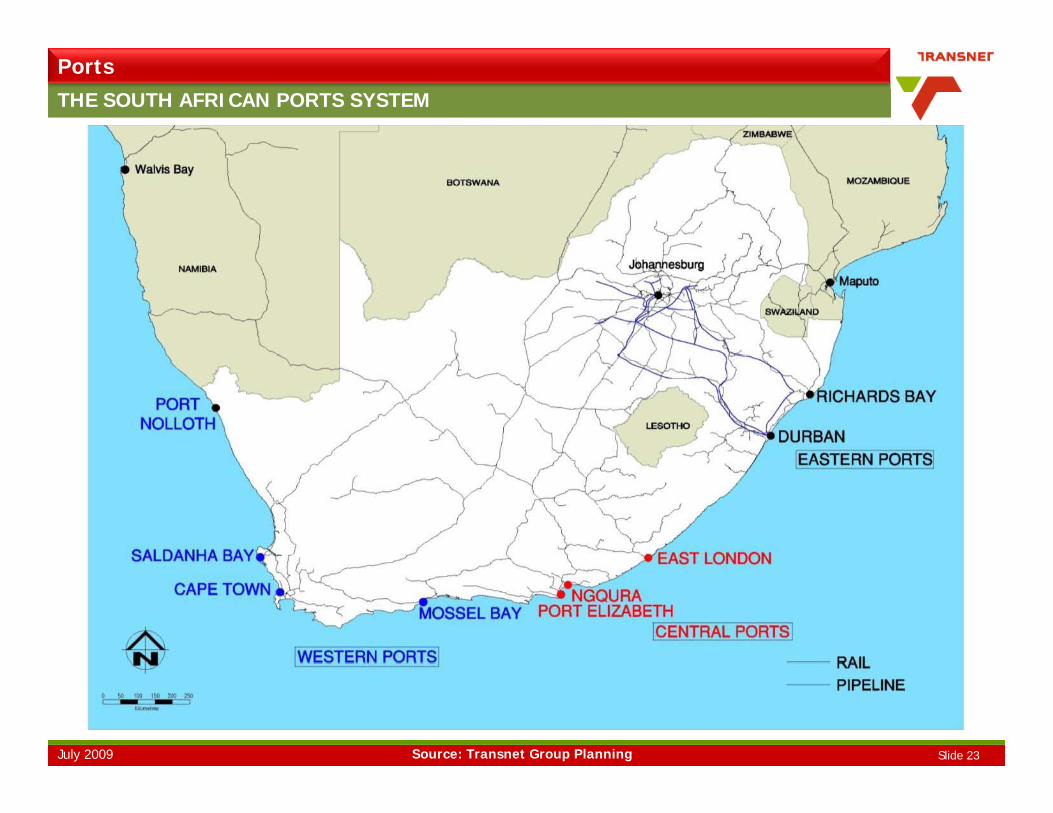
PortsTHE SOUTH AFRICAN PORTS SYSTEM
Slide 23July 2009 Source: Transnet Group Planning
Ports
PORT PLANNING PRINCIPLES
Optimize capital investment across the ports system to meet the long term
national demand for freight throughput, and to meet the requirements of
Transnet and the National Ports Act
Develop a complementary ports system with a regional grouping of old and
new ports to provide a rational range of facilities to meet local and hinterland
demand and avoid duplication of investmentdemand and avoid duplication of investment
Maintain flexibility to respond to changing technological and economic
conditions
Respond to environmental constraints in a sustainable manner
Align with city and regional planning initiatives
Align with trends in shipping and equipment technologyg pp g q p gy
Zone port functions according to cargo types
Maximise available space for berths, freight handling and operations
Slide 24July 2009
Integrate port capacity with inland transport connectivity
Develop back-of-port logistics areas to increase port capacity
Source: Transnet Group Planning
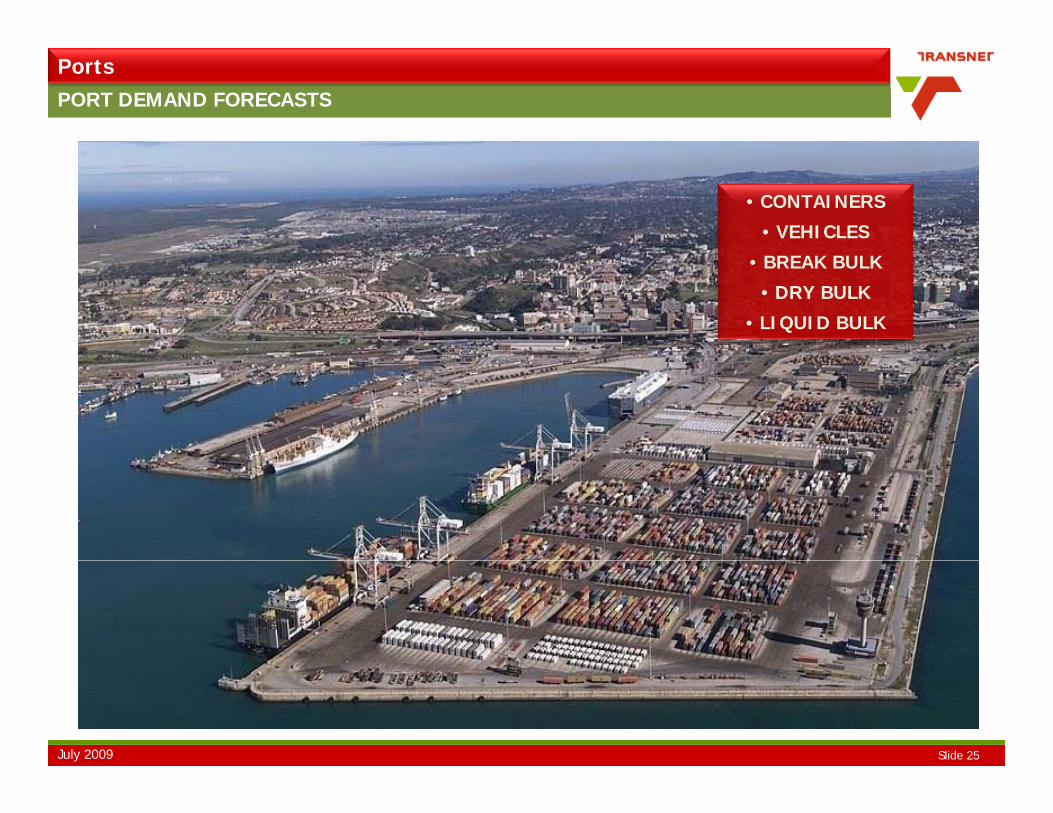
PortsPORT DEMAND FORECASTS
• CONTAINERS
• VEHICLES
• BREAK BULK
• DRY BULK
• LIQUID BULK
Slide 25July 2009

Ports
NATIONAL CONTAINER DEMAND FORECAST 2009
2037/38
2008/09 2013/14
3.77m teu 4.86m teu
20.0m teu
Slide 27July 2009 Source: Corporate Plan, TCP
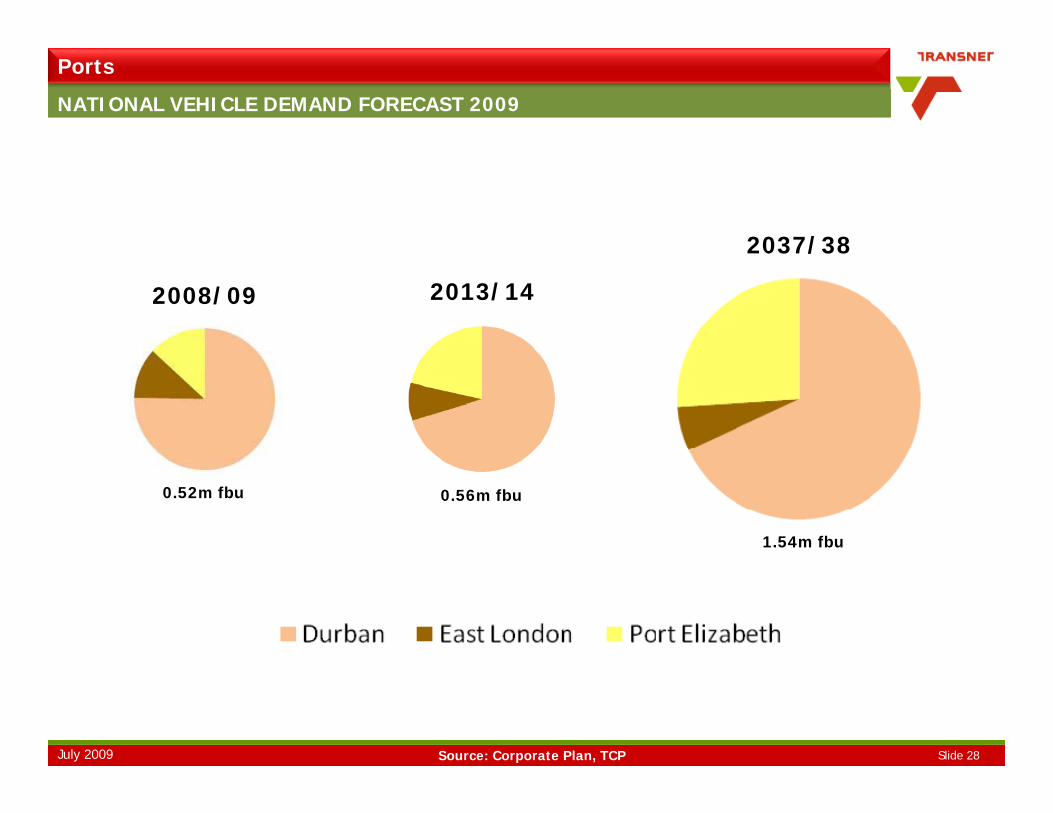
Ports
NATIONAL VEHICLE DEMAND FORECAST 2009
2037/38
2008/09 2013/14
2037/38
0.52m fbu 0.56m fbu
1.54m fbu
Slide 28July 2009 Source: Corporate Plan, TCP
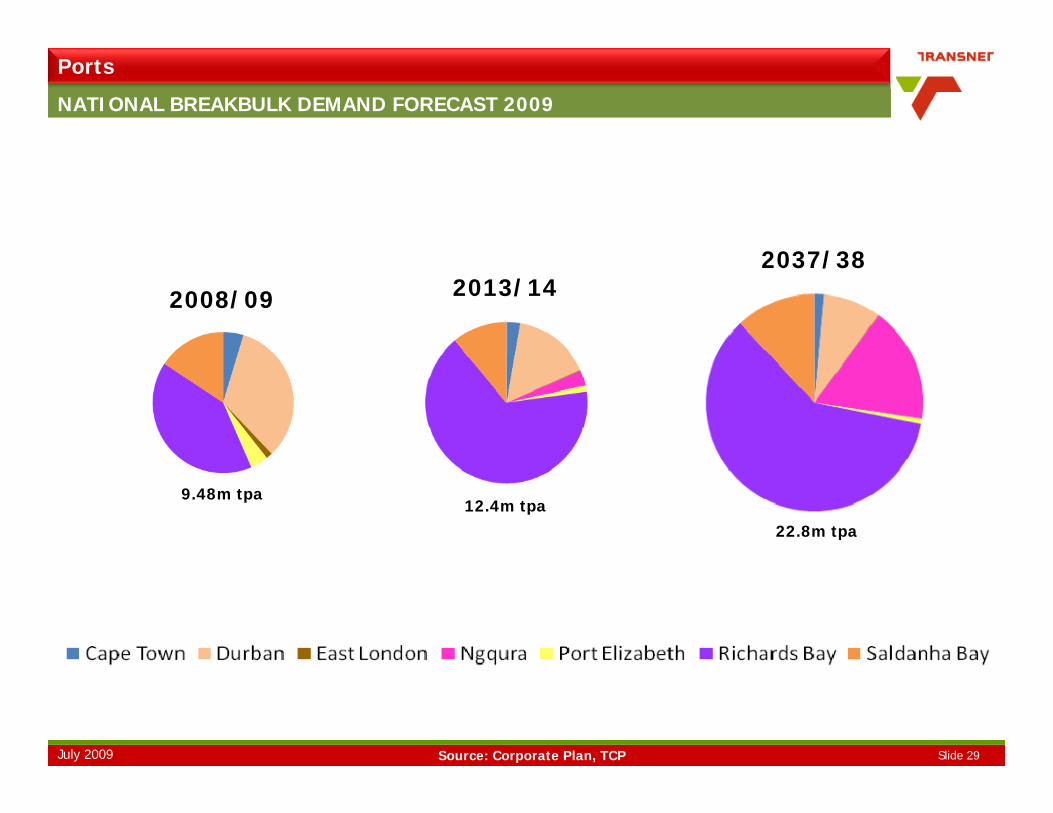
Ports
NATIONAL BREAKBULK DEMAND FORECAST 2009
2037/38
2008/09 2013/142037/38
9.48m tpa12.4m tpa
22.8m tpa
Slide 29July 2009 Source: Corporate Plan, TCP
Ports
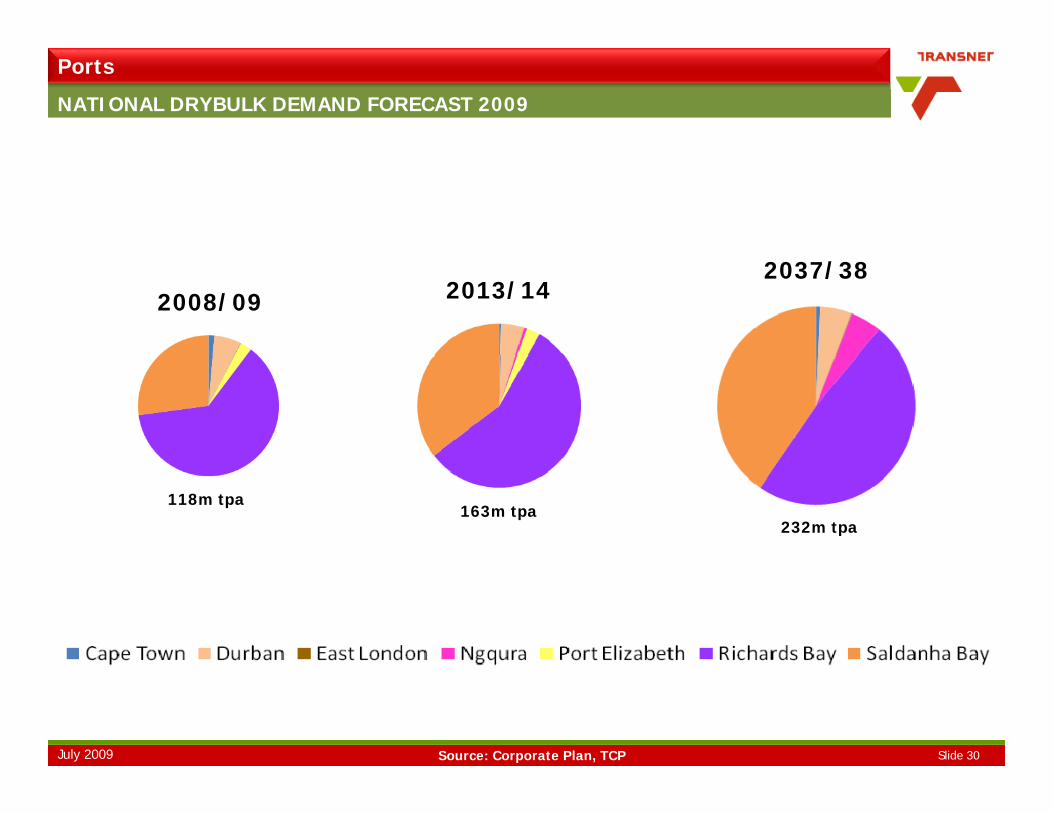
NATIONAL DRYBULK DEMAND FORECAST 2009
2008/09 2013/142037/38
118m tpa163m tpa
232m tpa
Slide 30July 2009 Source: Corporate Plan, TCP