Embed Size (px)
Citation preview

TSI Coking Coal Indices
Carbon Forum
November 19th, 2015 Tim Hard, Director TSI

- TSI (The Steel Index) Introduction
- Index methodology
- Valuing coal properties, not relativities
- Key Considerations
Agenda
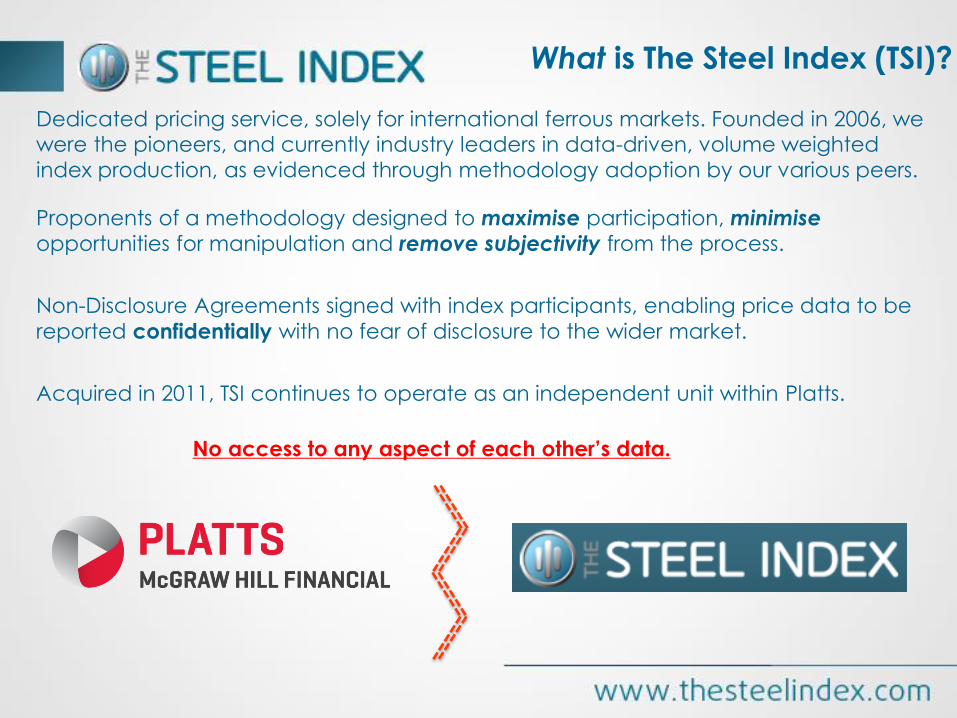
Dedicated pricing service, solely for international ferrous markets. Founded in 2006, we were the pioneers, and currently industry leaders in data-driven, volume weighted
index production, as evidenced through methodology adoption by our various peers.
Proponents of a methodology designed to maximise participation, minimise
opportunities for manipulation and remove subjectivity from the process.
Non-Disclosure Agreements signed with index participants, enabling price data to be
reported confidentially with no fear of disclosure to the wider market.
Acquired in 2011, TSI continues to operate as an independent unit within Platts.
No access to any aspect of each other’s data.
What is The Steel Index (TSI)?
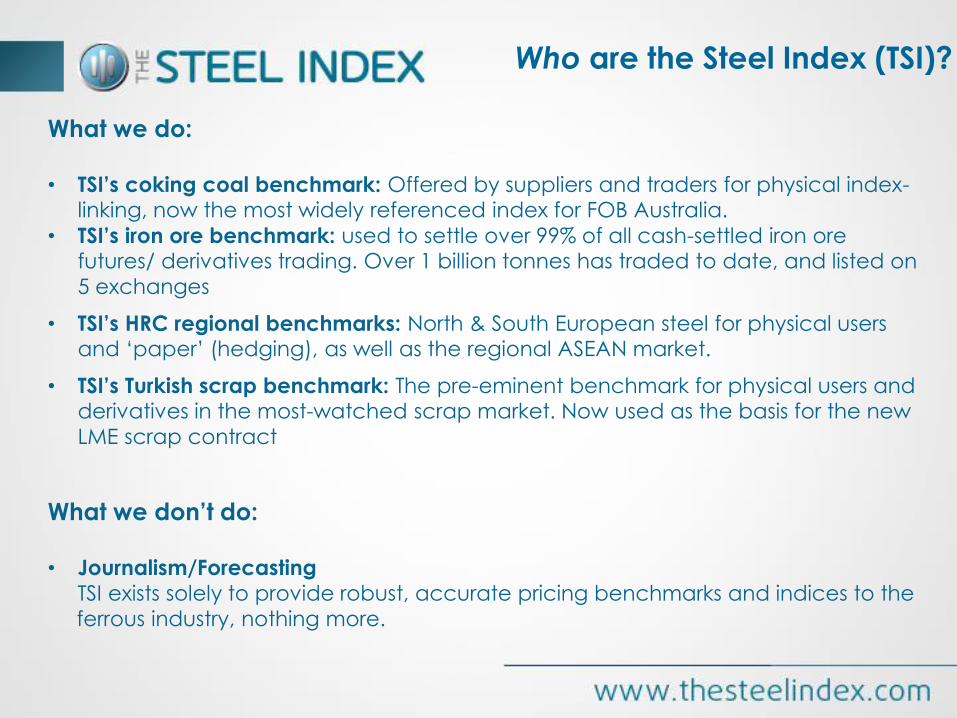
What we do:
• TSI’s coking coal benchmark: Offered by suppliers and traders for physical index-
linking, now the most widely referenced index for FOB Australia.
• TSI’s iron ore benchmark: used to settle over 99% of all cash-settled iron ore futures/ derivatives trading. Over 1 billion tonnes has traded to date, and listed on
5 exchanges
• TSI’s HRC regional benchmarks: North & South European steel for physical users and ‘paper’ (hedging), as well as the regional ASEAN market.
• TSI’s Turkish scrap benchmark: The pre-eminent benchmark for physical users and derivatives in the most-watched scrap market. Now used as the basis for the new
LME scrap contract
What we don’t do:
• Journalism/Forecasting
TSI exists solely to provide robust, accurate pricing benchmarks and indices to the
ferrous industry, nothing more.
Who are the Steel Index (TSI)?

TSI uses physical market transactions to produce
“daily spot value” reflective prices.
Mathematical methodology, devised to increase participation
and limit opportunity for manipulation.
TSI indices suitable for settling “floating” physical deals as well as
the underlier for derivatives.
Using the same index for physical and financial contracts minimises basis
risk.
TSI: Interacting with the Ferrous Markets
TSI Indices
Physical e-trading platforms
Derivatives
Companies involved in
physical spot trade
Long-term physical
contracts
TSI has over 650 companies participating as data providers
Floating deals basis TSI available on platforms.
TSI used in non-spot (long-term) floating deals.
SPOT DATA
SPOT DATA
- TSI (The Steel Index) Introduction
- Index methodology
- Valuing coal properties, not relativities
- Key Considerations
Agenda
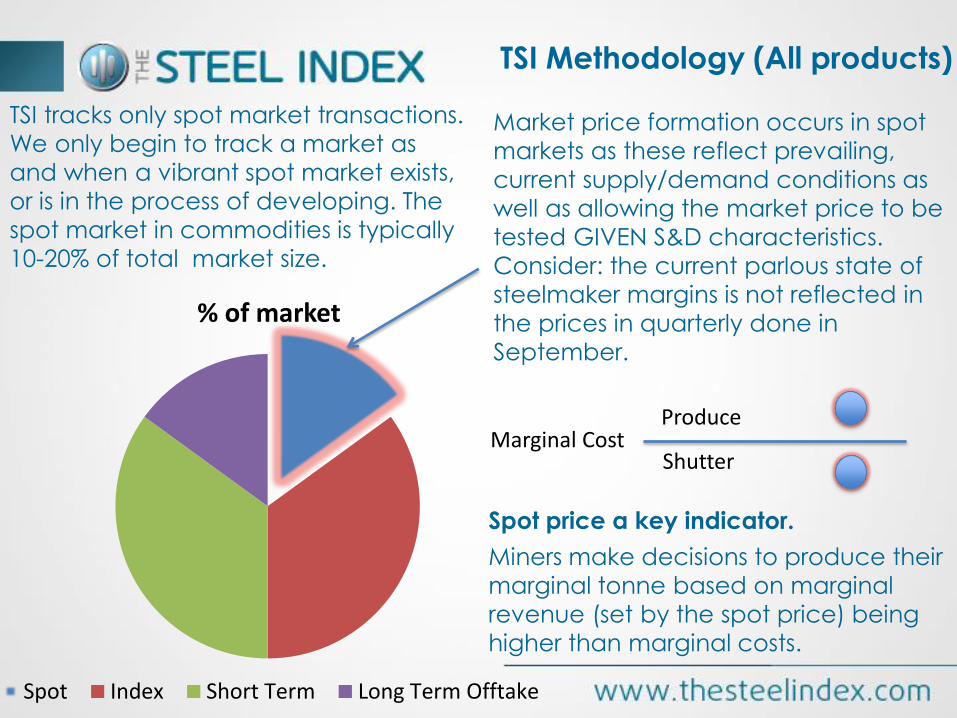
TSI tracks only spot market transactions.
We only begin to track a market as
and when a vibrant spot market exists,
or is in the process of developing. The
spot market in commodities is typically
10-20% of total market size.
TSI Methodology (All products)
% of market
Spot Index Short Term Long Term Offtake
Market price formation occurs in spot
markets as these reflect prevailing,
current supply/demand conditions as
well as allowing the market price to be
tested GIVEN S&D characteristics.
Consider: the current parlous state of
steelmaker margins is not reflected in
the prices in quarterly done in
September.
Miners make decisions to produce their
marginal tonne based on marginal
revenue (set by the spot price) being
higher than marginal costs.
Marginal Cost Produce
Shutter
Spot price a key indicator.

Normalisation
• Translating all relevant data submitted to a common basis (TSI’s reference product specification).
Statistical
Analysis
• Running TSI’s algorithm to remove outliers and inconsistent data points.
Checks &
Balances
• Minimising opportunities for manipulation/data bias.
Spot Market Transaction Data Collection and Screening
Volume-weighted Average Daily Price Calculation
TSI employs one approach to all ferrous markets covered.
TSI Methodology (All products)
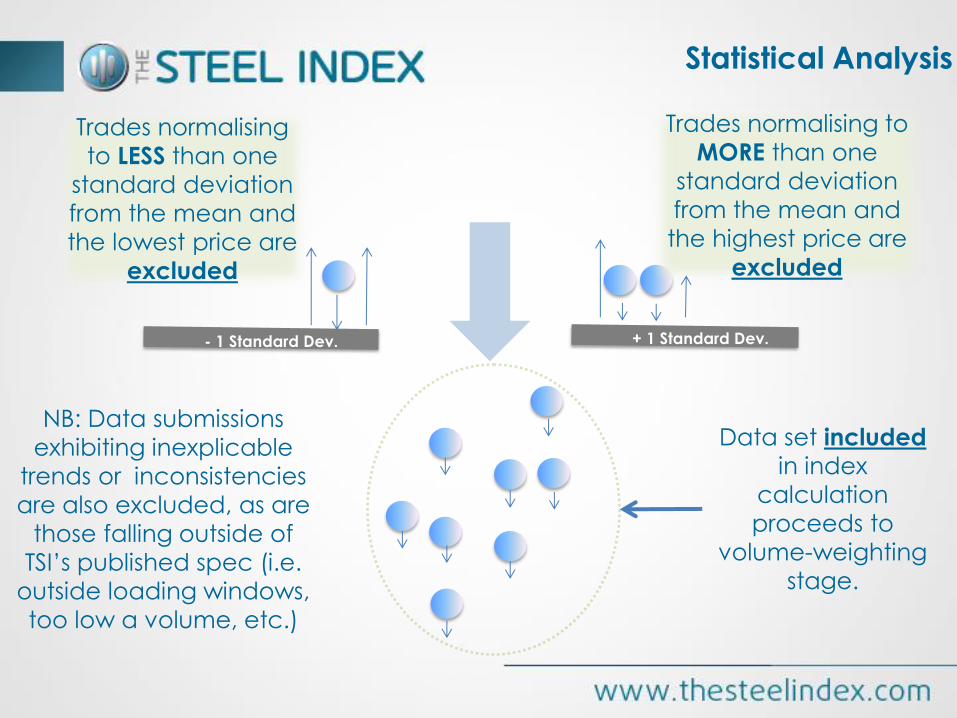
Trades normalising
to LESS than one
standard deviation
from the mean and
the lowest price are
excluded
Data set included
in index
calculation
proceeds to
volume-weighting
stage.
Trades normalising to
MORE than one
standard deviation
from the mean and
the highest price are
excluded
NB: Data submissions
exhibiting inexplicable
trends or inconsistencies
are also excluded, as are
those falling outside of
TSI’s published spec (i.e.
outside loading windows,
too low a volume, etc.)
- 1 Standard Dev. + 1 Standard Dev.
Statistical Analysis

A volume-weighted average is calculated from
screened, normalised data conforming to TSI’s
stated conditions:
• Data points include transactions and only if
required, firm bids and offers
• Bid/Offer data is given a reduced 10% weighting
(i,.e. a 75kt Handymax bid would see its volume
automatically reduced to 7,500 tonnes). The
rationale for weight reduction is our belief in the
primacy of transaction data.
• Transaction data gets full weighting (a 75kt spot
trade gets 75kt weighting in the sheet.
• Checks and balances employed: no single data
provider can comprise more than 40% of the
volume. We endeavor to achieve a buy/sell
balance
• Volume-weighted average produced.
Screened, normalised transactions
TSI published price
TSI statistical and
checks and balances
filter
Checks and Balances
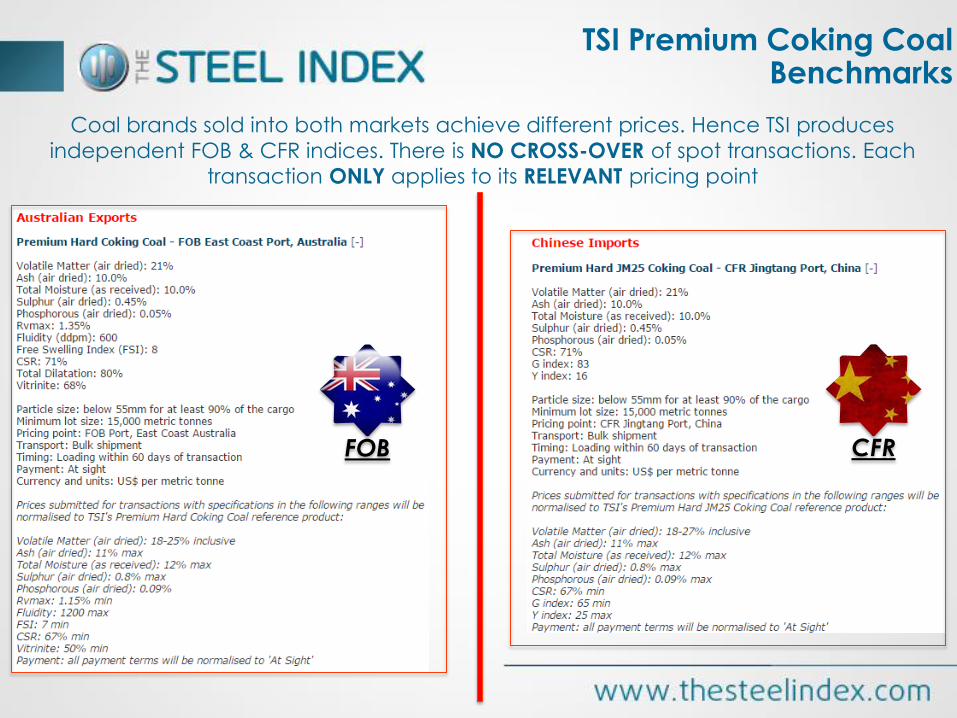
Coal brands sold into both markets achieve different prices. Hence TSI produces
independent FOB & CFR indices. There is NO CROSS-OVER of spot transactions. Each
transaction ONLY applies to its RELEVANT pricing point
FOB
CFR
TSI Premium Coking Coal Benchmarks

- TSI (The Steel Index) Introduction
- Index methodology
- Valuing coal properties, not relativities
- Key Considerations
Agenda

TSI’s approach to coking coal markets is to value the coal based on it’s properties. For
each factor (ash, volatile matter, CSR etc.) we assign a value-in-use figure, based on
isolating that variable and performing regressions on spot data history.
The relative value of one brand of coal versus another is immaterial in the calculation
process: market participants attribute their own value during the spot-buying process.
Premium FOB Australia Premium CFR China (JM25)
You will note the differences in CFR China and FOB Australia indices, where
feedback and regressions showed a necessity to use differing variables.
Valuing coals, from the bottom up

Buyers continue targeting select properties – continued disruption of the normal
‘hierarchy’. Some low-vol coals are failing to hit theoretical prices due to relative
abundance in an FOB marketplace emphasizing fluidity found in some mid-vols.
Compression of prices between grades is greater than normal (the wide spreads
relatively recently seen between coals has tightened further).
Accounting for those valuations through VIU remains explicable and predictable….
Low-vol/
mid-vol
spread
highly
variable. 70
80
90
100
110
120
130
Low Vol Mid Vol
VIU Remains the way to value coals
- TSI (The Steel Index) Introduction
- Index methodology
- Valuing coal properties, not relativities
- Key Considerations
Agenda

1. Index Liquidity
2. Structure and Pricing
3. Long Term vision for TSI
Index Robustness
Key Considerations
Index Credibility
All following data refers only to TSI’s FOB Australia PHCC index. It is:
- Our index against which most physical deals are linked or referred to.
- The settlement index used by SGX for derivatives trade.
- The pricing point which TSI believes to be the long-term global
benchmark/anchor-point.
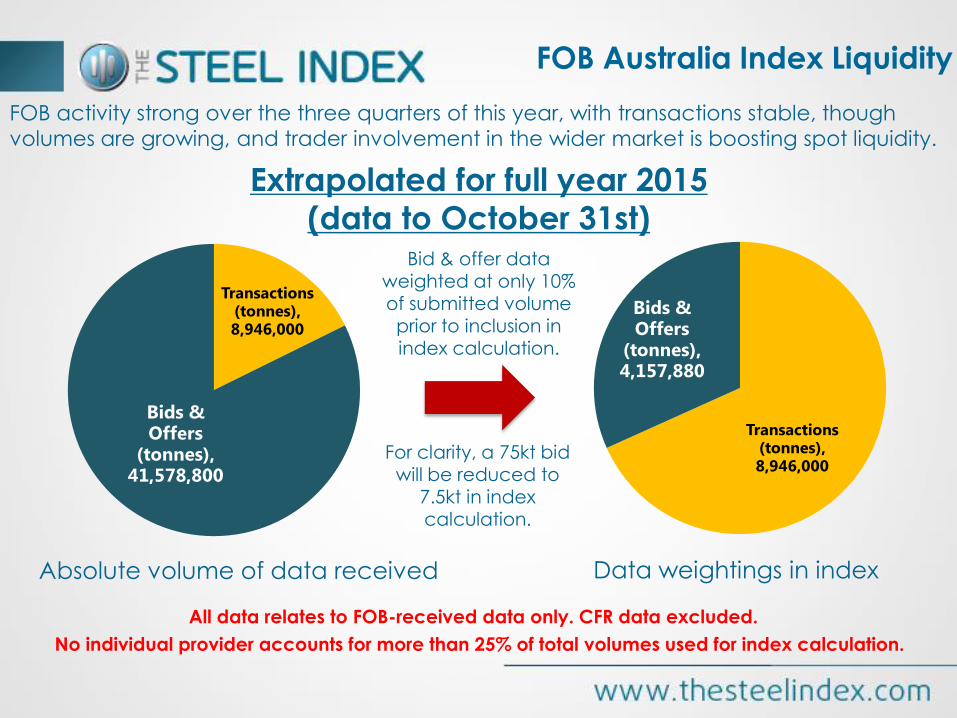
FOB activity strong over the three quarters of this year, with transactions stable, though
volumes are growing, and trader involvement in the wider market is boosting spot liquidity.
Transactions (tonnes), 8,946,000
Bids & Offers
(tonnes), 41,578,800
Extrapolated for full year 2015
(data to October 31st)
Transactions (tonnes), 8,946,000
Bids & Offers
(tonnes), 4,157,880
Absolute volume of data received
Bid & offer data weighted at only 10%
of submitted volume prior to inclusion in index calculation.
Data weightings in index
All data relates to FOB-received data only. CFR data excluded.
No individual provider accounts for more than 25% of total volumes used for index calculation.
FOB Australia Index Liquidity
For clarity, a 75kt bid will be reduced to
7.5kt in index calculation.
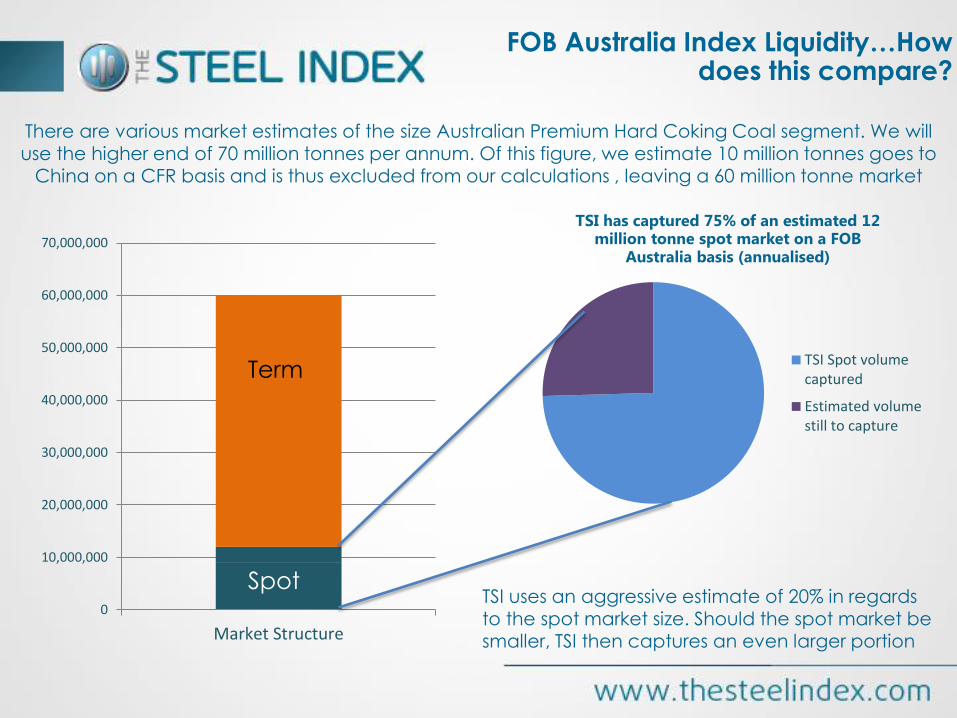
There are various market estimates of the size Australian Premium Hard Coking Coal segment. We will
use the higher end of 70 million tonnes per annum. Of this figure, we estimate 10 million tonnes goes to China on a CFR basis and is thus excluded from our calculations , leaving a 60 million tonne market
0
10,000,000
20,000,000
30,000,000
40,000,000
50,000,000
60,000,000
70,000,000
Market Structure
TSI has captured 75% of an estimated 12 million tonne spot market on a FOB
Australia basis (annualised)
TSI Spot volumecaptured
Estimated volumestill to capture
Term
Spot TSI uses an aggressive estimate of 20% in regards to the spot market size. Should the spot market be smaller, TSI then captures an even larger portion
FOB Australia Index Liquidity…How does this compare?

Pre-normalised data points
FOB Australia Index Liquidity…How this looks in practise
$70
$90
$110
$130
$150
$170
$190
20
13
-01
-14
20
13
-02
-14
20
13
-03
-14
20
13
-04
-14
20
13
-05
-14
20
13
-06
-14
20
13
-07
-14
20
13
-08
-14
20
13
-09
-14
20
13
-10
-14
20
13
-11
-14
20
13
-12
-14
20
14
-01
-14
20
14
-02
-14
20
14
-03
-14
20
14
-04
-14
20
14
-05
-14
20
14
-06
-14
20
14
-07
-14
20
14
-08
-14
20
14
-09
-14
20
14
-10
-14
20
14
-11
-14
20
14
-12
-14
20
15
-01
-14
20
15
-02
-14
20
15
-03
-14
20
15
-04
-14
20
15
-05
-14
20
15
-06
-14
20
15
-07
-14
20
15
-08
-14
20
15
-09
-14
20
15
-10
-14
FOB Australia
Bid
Offer
Transaction
2015 data-to-date132 Transactions452 Bids/Offers

• The TSI index is 70% driven by transaction data. 30% is firm bid/offer volumes. Bid offer
data is extremely useful to see transactions developing through narrowing spreads and
adds additional data.
• Annualised, TSI will receive around 8,946,000 tonnes of spot FOB Australia data in 2015.
We received 7.445mmt by October 31st. Transaction volumes get full (100%) weighting.
• In supplementary data, TSI will also receive 41,578,800 tonnes of bid/offer data. Bid/offer
volumes only get a 10% weighting.
• Using aggressively high estimates of the total spot market, TSI will capture 75% of trades
• Annualised, TSI will receive around 694 data points for FOB Australia coking coal (156
transactions). By Oct 31st, we received 130 transactions and 448 bids and offers.
• If there is no transaction on a given day, the prior transaction is rolled-over at a reduced
weighting. Though a day old, it remains relevant and sets buyer and seller expectations.
• Any spot market actor can take part in the index, after signing our legal agreement. Miner/trader/coke maker/mill. TSI is a neutral, industry-impartial organisation.
FOB Australia Index Liquidity…Key takeaways

Index Development
• The Steel Index was founded in order to develop long-term ferrous benchmarks, through
direct industry participation.
• Any spot market actor can take part in the index, after signing our legal agreement.
Miner/trader/coke maker/mill. TSI is a neutral, industry-impartial organisation.
• TSI seeks to get 100% participation in our indices. There is no commercial disincentive to
participation: TSI offers legal guarantees of the confidentiality of data provided to us.
The data is ring-fenced for use in indices only.
• Direct participation in the indices engenders greater confidence in the process – you
can see how your reported spot trades effect the index directly.
• The Steel Index will continue to solicit industry feedback in all of our products in order to
produce, develop and maintain robust and accurate ferrous indices.
• We are happy to present one-to-one so that buyers and sellers are able to drill down
directly into the index methodology. Contact us to arrange a discussion about physical
index use, liquidity-growth for price risk management, or direct index participation.

0.0
10.0
20.0
30.0
40.0
50.0
60.0
70.0
80.0
90.0
0
50000
100000
150000
200000
250000
300000
Jun-15 Jul-15 Aug-15 Sep-15 Oct-15 Nov-15
CME
SGX share of total volumes
%
Vo
lum
e
SGX
TSI-linked FOB Australian swaps and futures volumes picking up at SGX.
TSI aims to produce indices which are accurate not only for the physical industry
embedding them, but also for the financial instruments doing the same: so that companies
who manage risk find their hedge to be highly effective in practice.
Derivatives
TD
Steel: since 2006
Iron Ore: since 2008
Scrap: since 2010
Coking Coal: since 2012
Regional Virtual Steel Mill: since 2014
Thank you for your attention!