Embed Size (px)
Citation preview
CALMAC Mfg. Corp. 2014 ©
Understanding The Electricity Bill
1
Evan BergerDirector of Energy Solutions
CALMAC Manufacturing Corp.Fair Lawn, NJ
December [email protected]
CALMAC Mfg. Corp. 2014 ©
Conclusions1. There are three ways to lower electric costs:
a) Buy fewer units of energy.
b) Lower electricity costs by purchasing it when it’s cheaper, at night.
c) Negotiate a better rate.
2
CALMAC Mfg. Corp. 2014 ©
3
Conclusions2. Commercial Rates are Different than
Residential Rates:
a) Residential Rates are based solely on usage (kWh)
b) Commercial Rates are based on a mixture of usage (kWh) and Demand (peak kW).
c) In deregulated states like New Jersey, Demand Charges are how utilities like PSE&G make money off of their commercial and institutional customers.
CALMAC Mfg. Corp. 2014 ©
4
Conclusions3. Rates and tariffs are complicated.
Why? A few possible* reasons come to mind—
a) Lawyers write them
b) Regulators dislike plain English
c) The less customers know about their electricity bills, the more utilities and Third-Party Suppliers can possibly* earn more money at their expense
*Note: pure speculation
CALMAC Mfg. Corp. 2014 ©
Demand Charges
Definition: any electricity charge that is assessed on a per-kW basis
In NJ, there are two types of Demand Charges:1. Utility Demand Charges2. Grid Demand Charges (in New Jersey, PJM)
5
CALMAC Mfg. Corp. 2014 ©
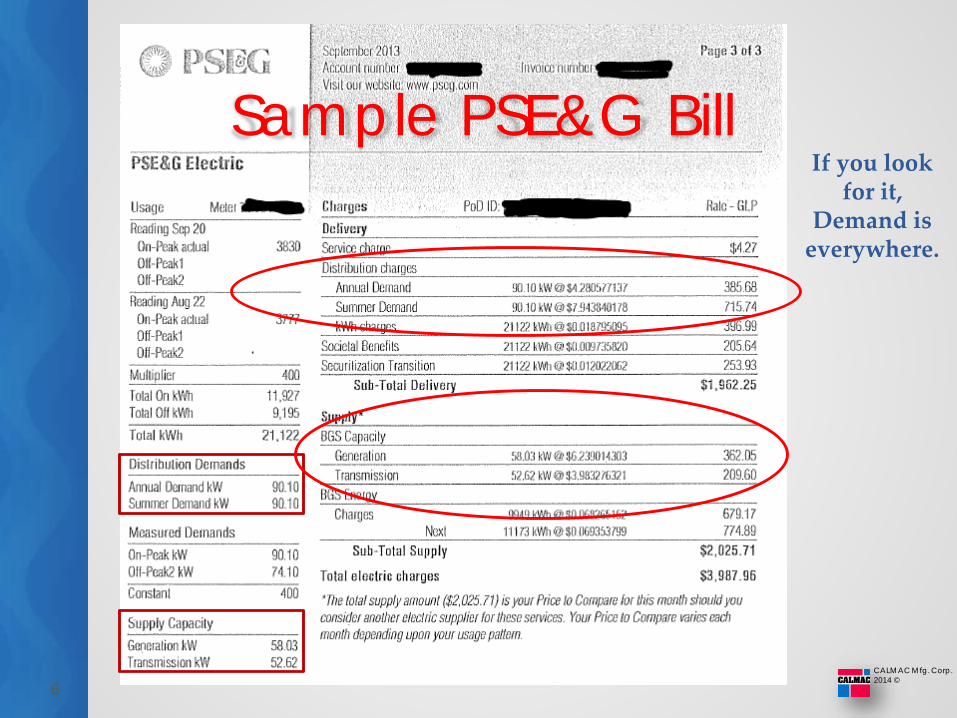
6
Sample PSE&G BillIf you look
for it, Demand is
everywhere.
CALMAC Mfg. Corp. 2014 ©
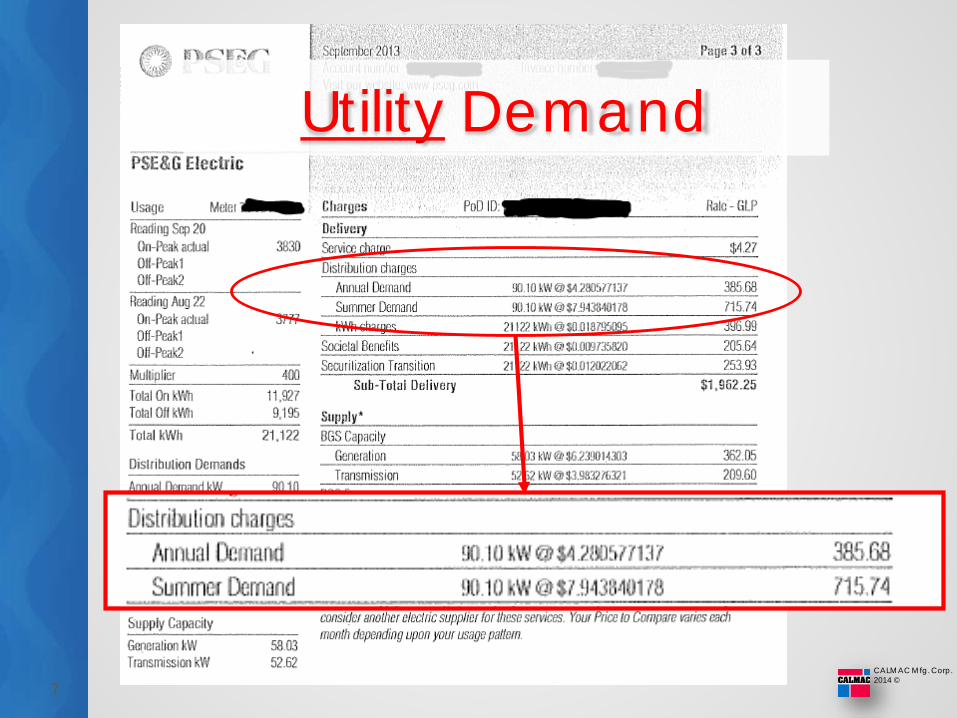
7
Utility Demand
CALMAC Mfg. Corp. 2014 ©
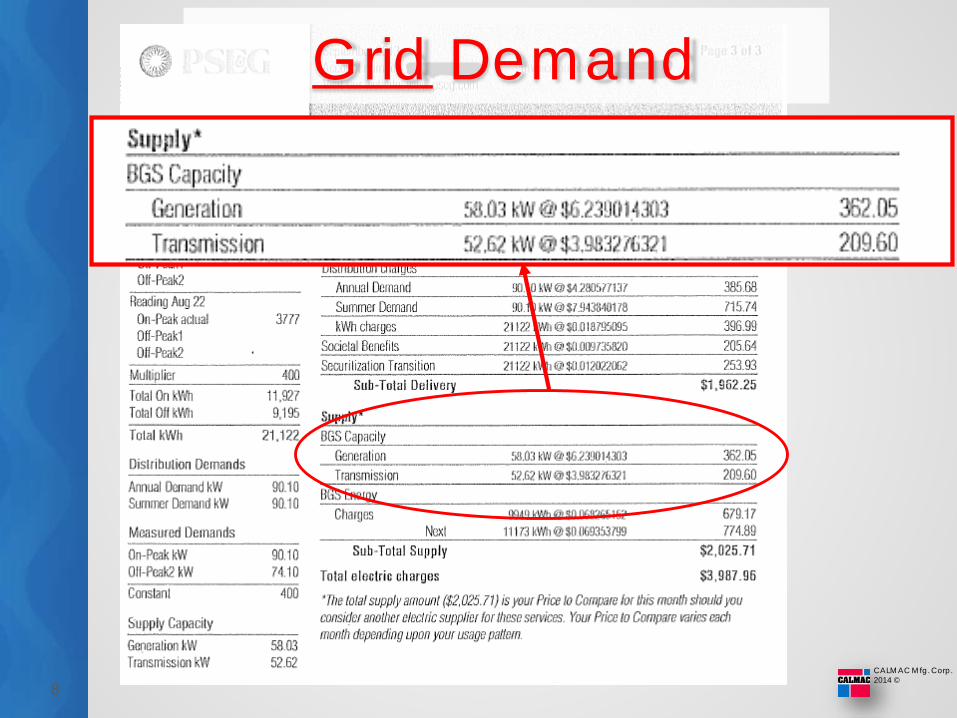
8
Grid Demand
CALMAC Mfg. Corp. 2014 ©
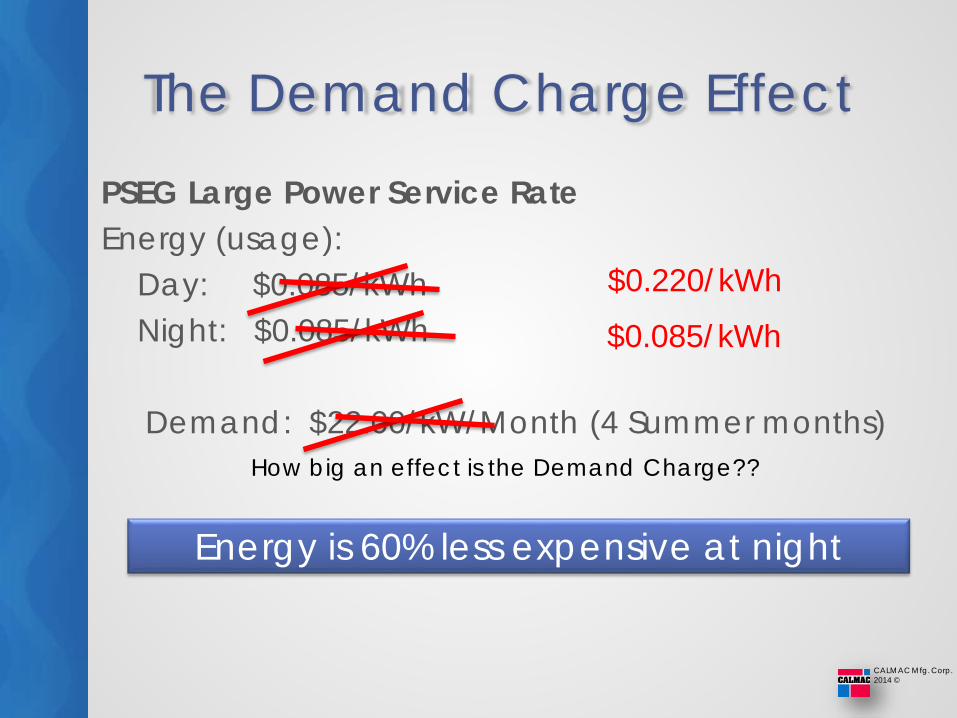
The Demand Charge Effect
PSEG Large Power Service RateEnergy (usage):
Day: $0.085/kWhNight: $0.085/kWh
Demand: $22.00/kW/Month (4 Summer months)How big an effect is the Demand Charge??
Energy is 60% less expensive at night
$0.085/kWh
$0.220/kWh
CALMAC Mfg. Corp. 2014 ©
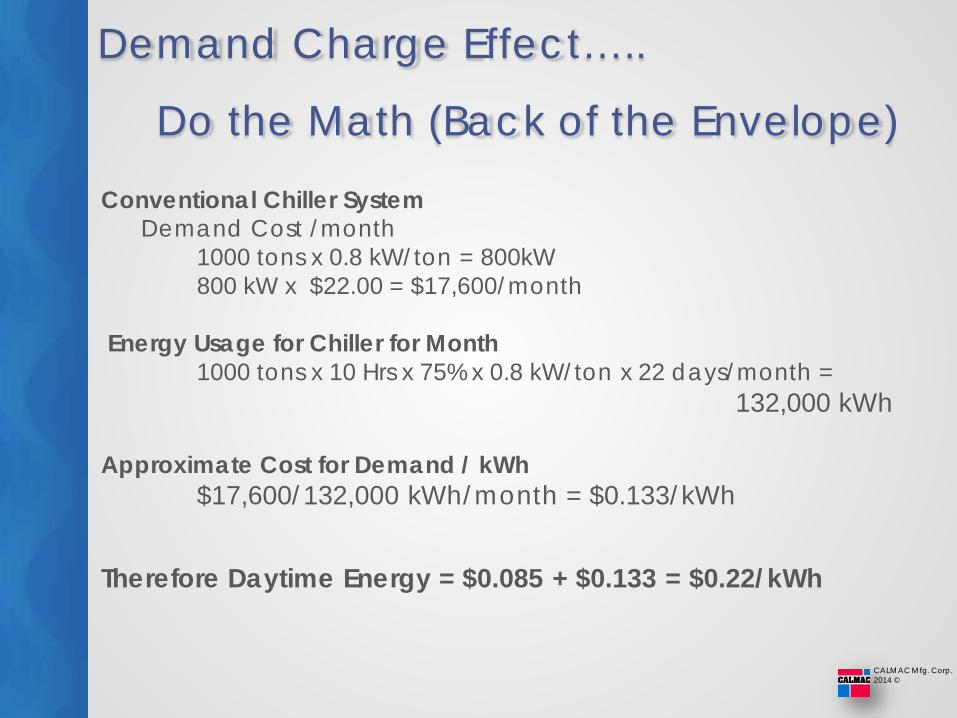
Demand Charge Effect…..
Do the Math (Back of the Envelope)
Conventional Chiller System Demand Cost /month
1000 tons x 0.8 kW/ton = 800kW 800 kW x $22.00 = $17,600/month
Energy Usage for Chiller for Month1000 tons x 10 Hrs x 75% x 0.8 kW/ton x 22 days/month =
132,000 kWh
Approximate Cost for Demand / kWh $17,600/132,000 kWh/month = $0.133/kWh
Therefore Daytime Energy = $0.085 + $0.133 = $0.22/kWh
CALMAC Mfg. Corp. 2014 ©
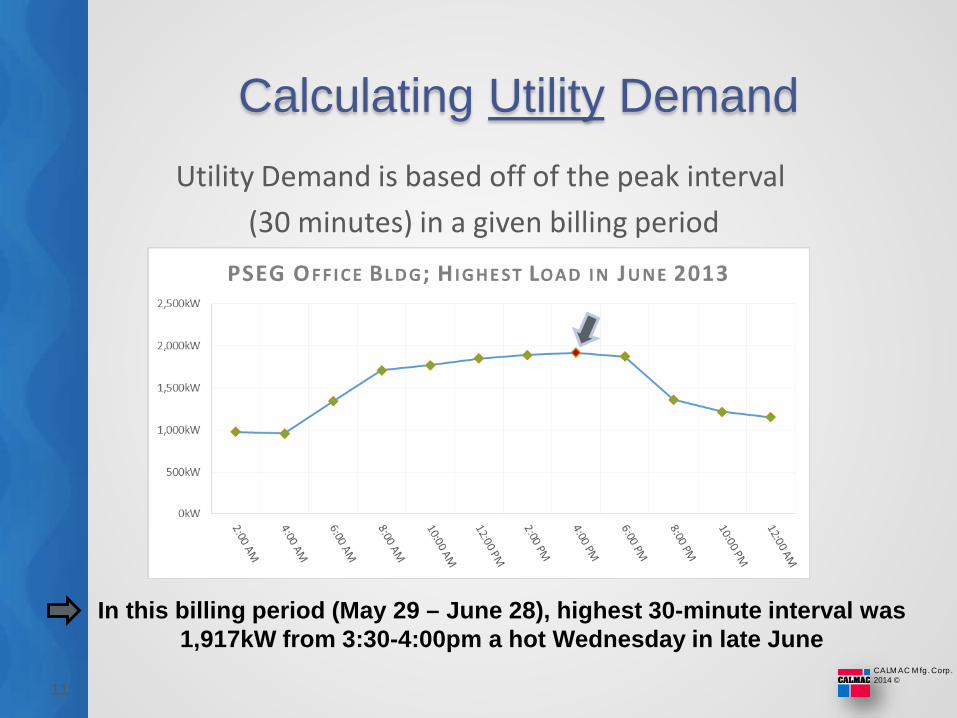
Calculating Utility DemandUtility Demand is based off of the peak interval
(30 minutes) in a given billing period
11
In this billing period (May 29 – June 28), highest 30-minute interval was 1,917kW from 3:30-4:00pm a hot Wednesday in late June
CALMAC Mfg. Corp. 2014 ©
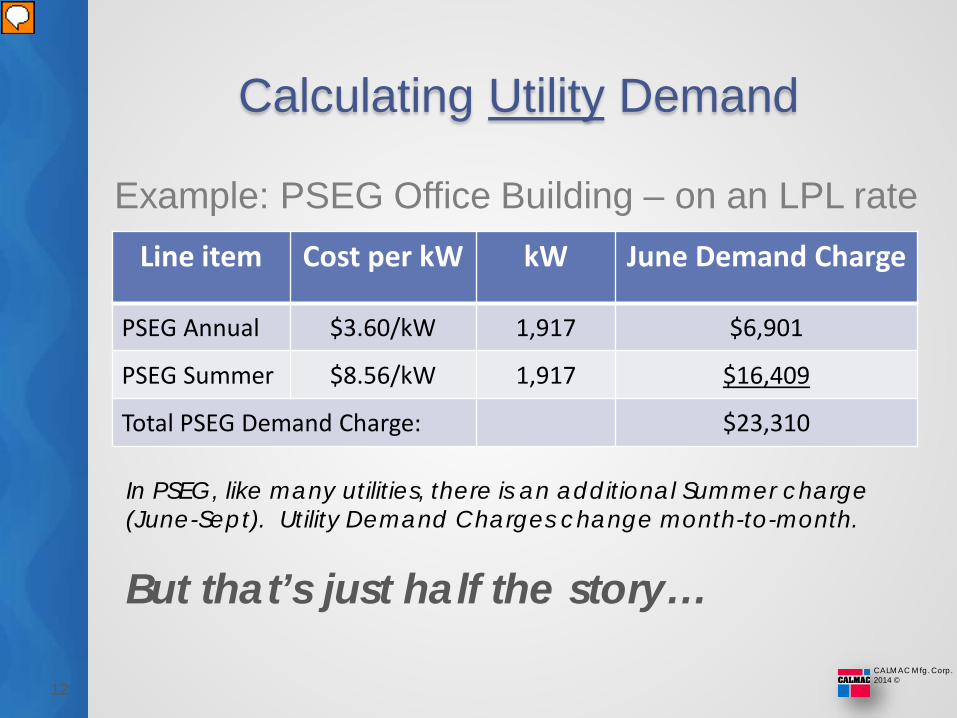
Example: PSEG Office Building – on an LPL rate
12
Line item Cost per kW kW June Demand Charge
PSEG Annual $3.60/kW 1,917 $6,901
PSEG Summer $8.56/kW 1,917 $16,409
Total PSEG Demand Charge: $23,310
In PSEG, like many utilities, there is an additional Summer charge (June-Sept). Utility Demand Charges change month-to-month.
But that’s just half the story…
Calculating Utility Demand
CALMAC Mfg. Corp. 2014 ©
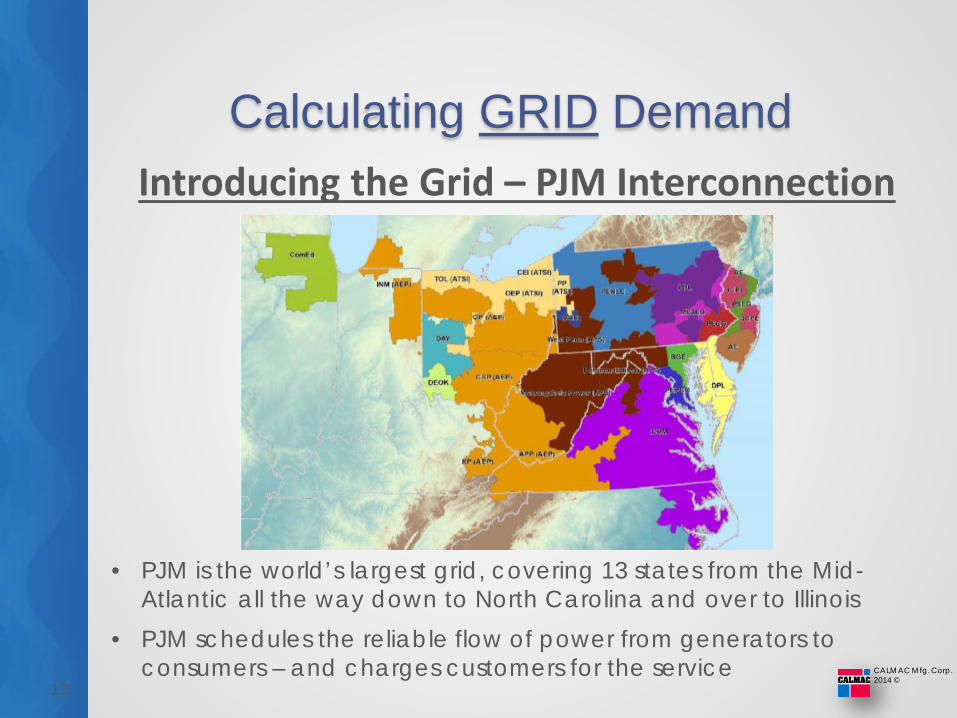
Calculating GRID DemandIntroducing the Grid – PJM Interconnection
13
• PJM is the world’s largest grid, covering 13 states from the Mid-Atlantic all the way down to North Carolina and over to Illinois
• PJM schedules the reliable flow of power from generators to consumers – and charges customers for the service
CALMAC Mfg. Corp. 2014 ©
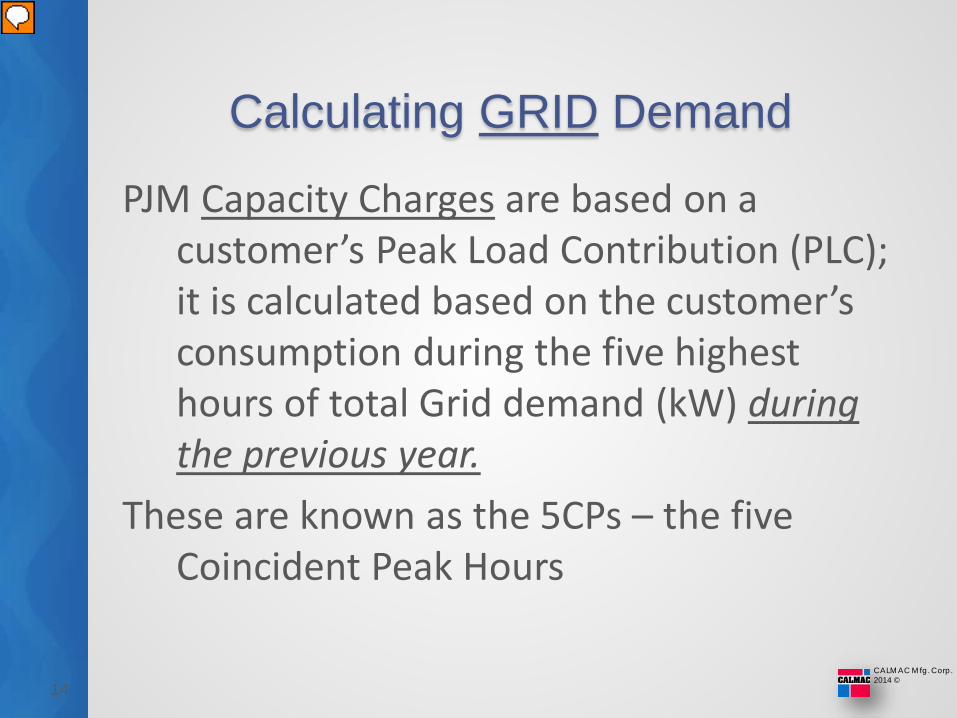
PJM Capacity Charges are based on a customer’s Peak Load Contribution (PLC); it is calculated based on the customer’s consumption during the five highest hours of total Grid demand (kW) during the previous year.
These are known as the 5CPs – the five Coincident Peak Hours
14
Calculating GRID Demand
CALMAC Mfg. Corp. 2014 ©
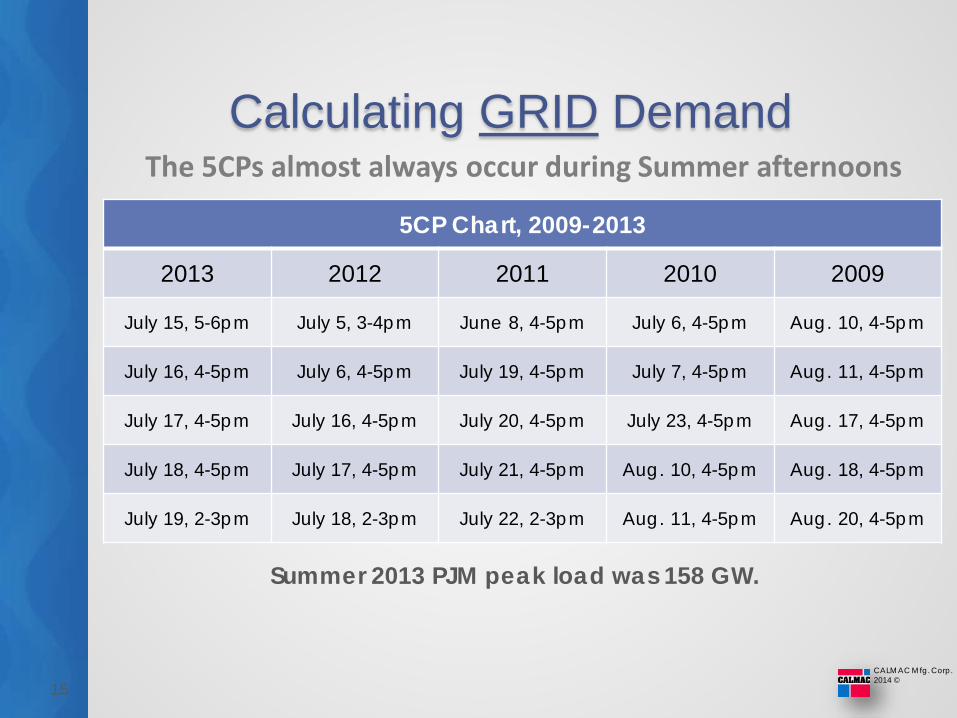
The 5CPs almost always occur during Summer afternoons
15
5CP Chart, 2009-2013
2013 2012 2011 2010 2009
July 15, 5-6pm July 5, 3-4pm June 8, 4-5pm July 6, 4-5pm Aug. 10, 4-5pm
July 16, 4-5pm July 6, 4-5pm July 19, 4-5pm July 7, 4-5pm Aug. 11, 4-5pm
July 17, 4-5pm July 16, 4-5pm July 20, 4-5pm July 23, 4-5pm Aug. 17, 4-5pm
July 18, 4-5pm July 17, 4-5pm July 21, 4-5pm Aug. 10, 4-5pm Aug. 18, 4-5pm
July 19, 2-3pm July 18, 2-3pm July 22, 2-3pm Aug. 11, 4-5pm Aug. 20, 4-5pm
Summer 2013 PJM peak load was 158 GW.
Calculating GRID Demand
CALMAC Mfg. Corp. 2014 ©
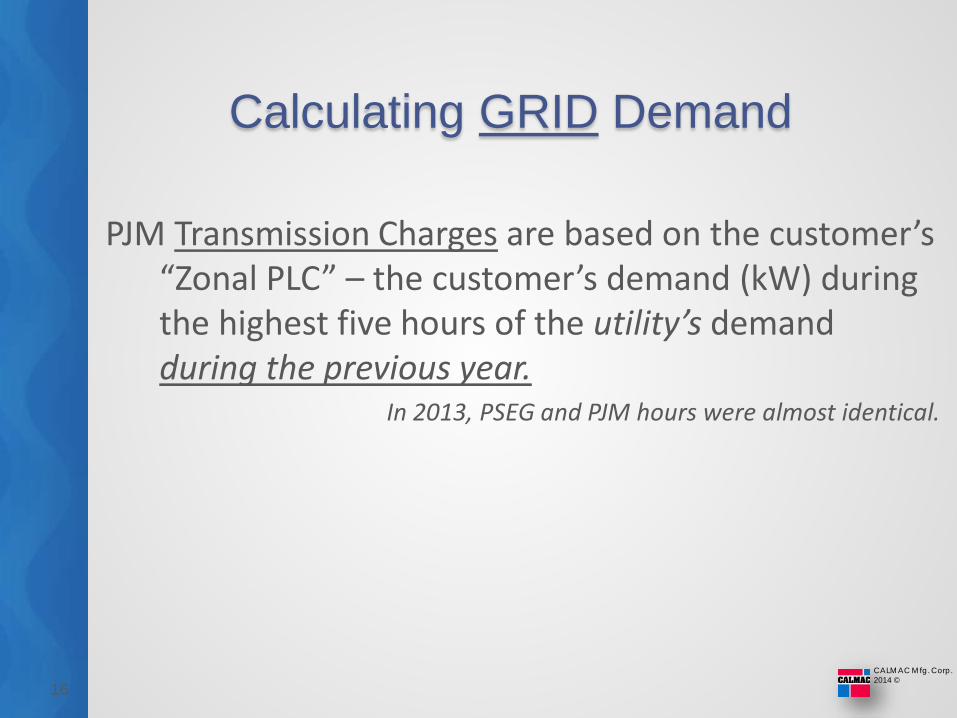
PJM Transmission Charges are based on the customer’s “Zonal PLC” – the customer’s demand (kW) during the highest five hours of the utility’s demand during the previous year.
In 2013, PSEG and PJM hours were almost identical.
16
Calculating GRID Demand
CALMAC Mfg. Corp. 2014 ©
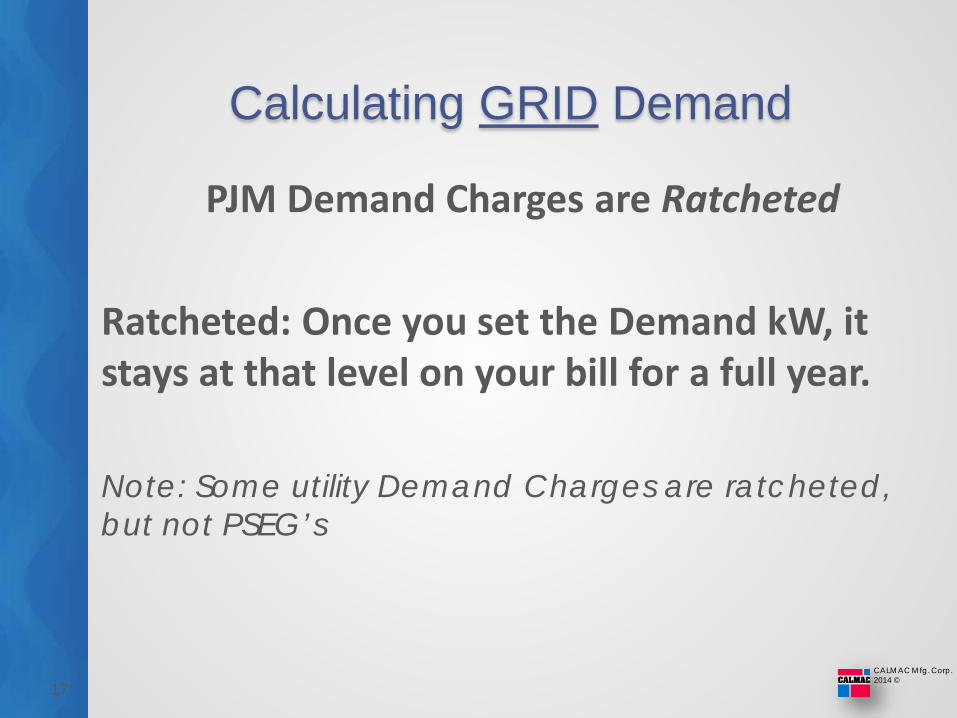
PJM Demand Charges are Ratcheted
Ratcheted: Once you set the Demand kW, it stays at that level on your bill for a full year.
Note: Some utility Demand Charges are ratcheted, but not PSEG’s
17
Calculating GRID Demand
CALMAC Mfg. Corp. 2014 ©
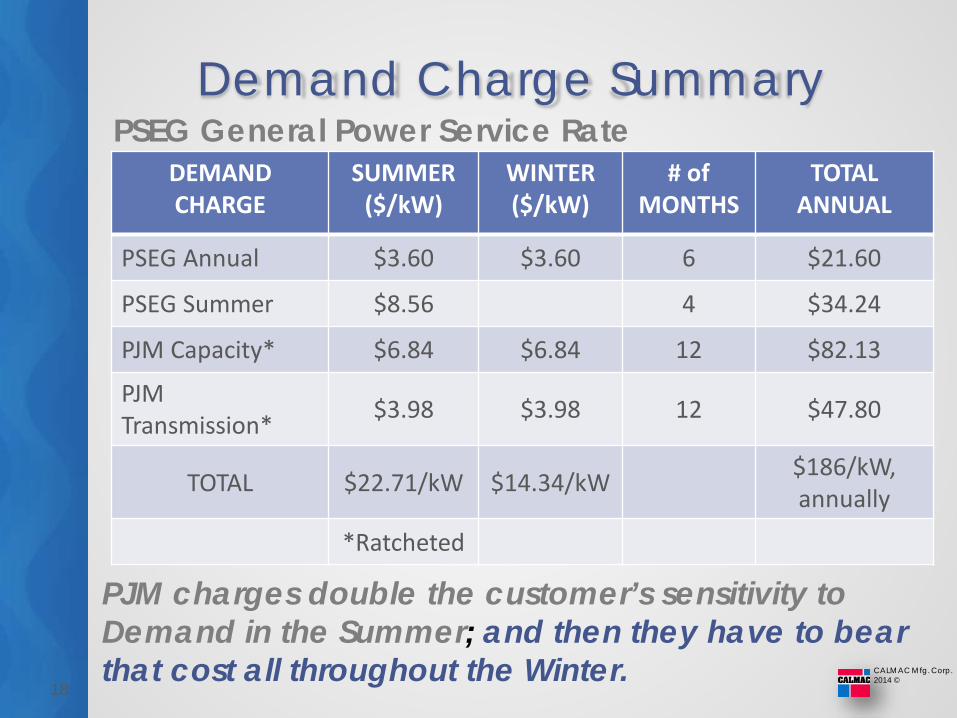
Demand Charge Summary
18
PSEG General Power Service Rate DEMANDCHARGE
SUMMER($/kW)
WINTER($/kW)
# of MONTHS
TOTAL ANNUAL
PSEG Annual $3.60 $3.60 6 $21.60
PSEG Summer $8.56 4 $34.24
PJM Capacity* $6.84 $6.84 12 $82.13
PJM Transmission* $3.98 $3.98 12 $47.80
TOTAL $22.71/kW $14.34/kW $186/kW, annually
*Ratcheted
PJM charges double the customer’s sensitivity to Demand in the Summer; and then they have to bear that cost all throughout the Winter.
CALMAC Mfg. Corp. 2014 ©
19
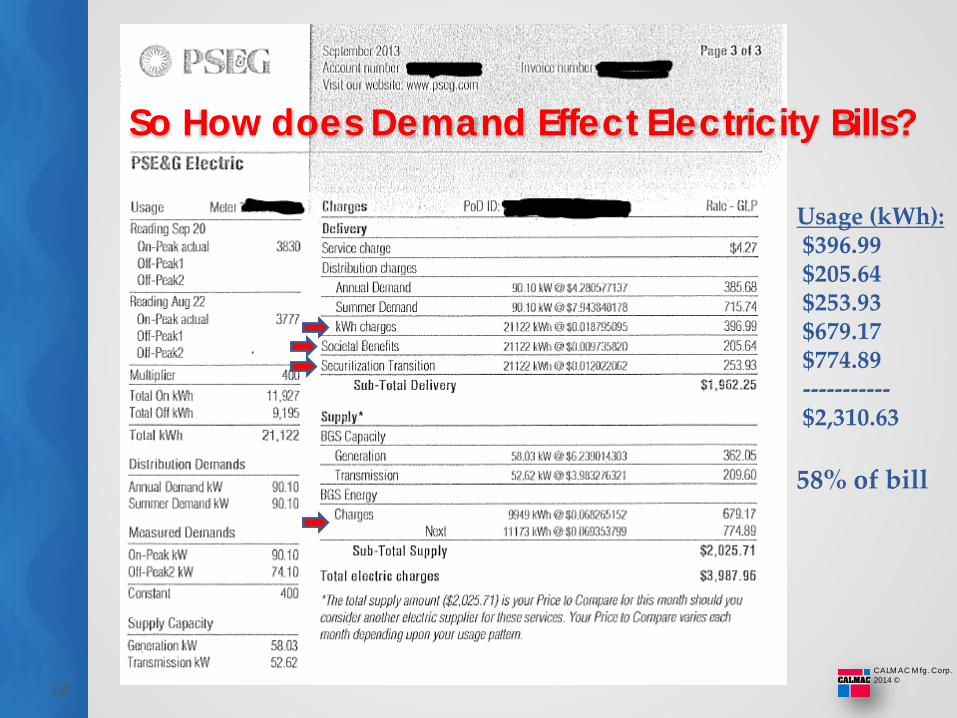
So How does Demand Effect Electricity Bills?
Usage (kWh):$396.99 $205.64$253.93$679.17$774.89-----------$2,310.63
58% of bill
CALMAC Mfg. Corp. 2014 ©
20
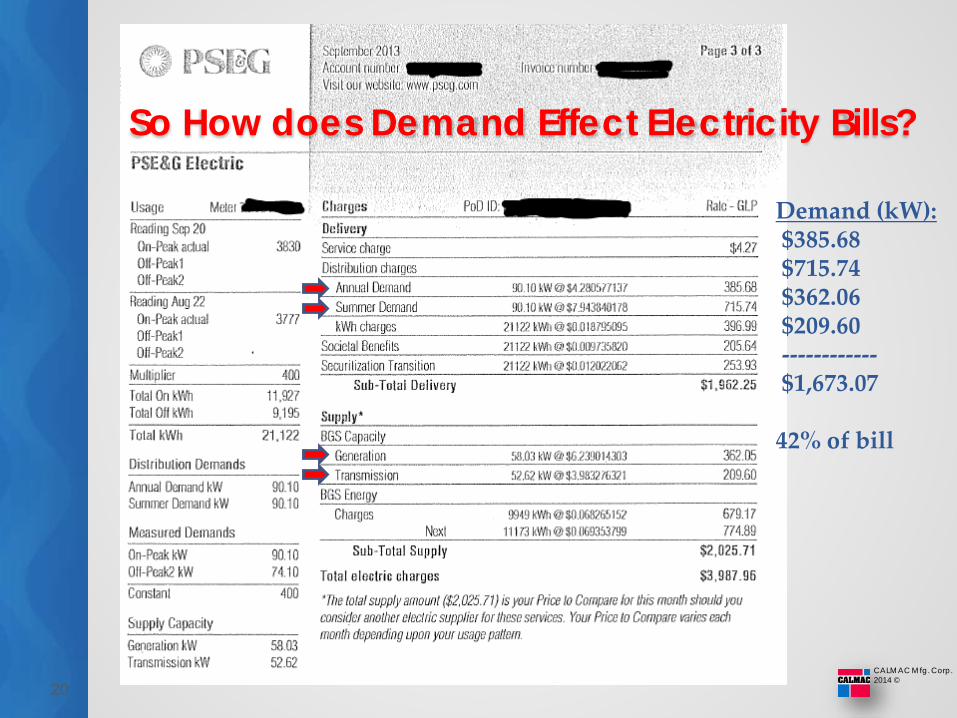
So How does Demand Effect Electricity Bills?
Demand (kW):$385.68 $715.74$362.06$209.60------------$1,673.07
42% of bill
CALMAC Mfg. Corp. 2014 ©
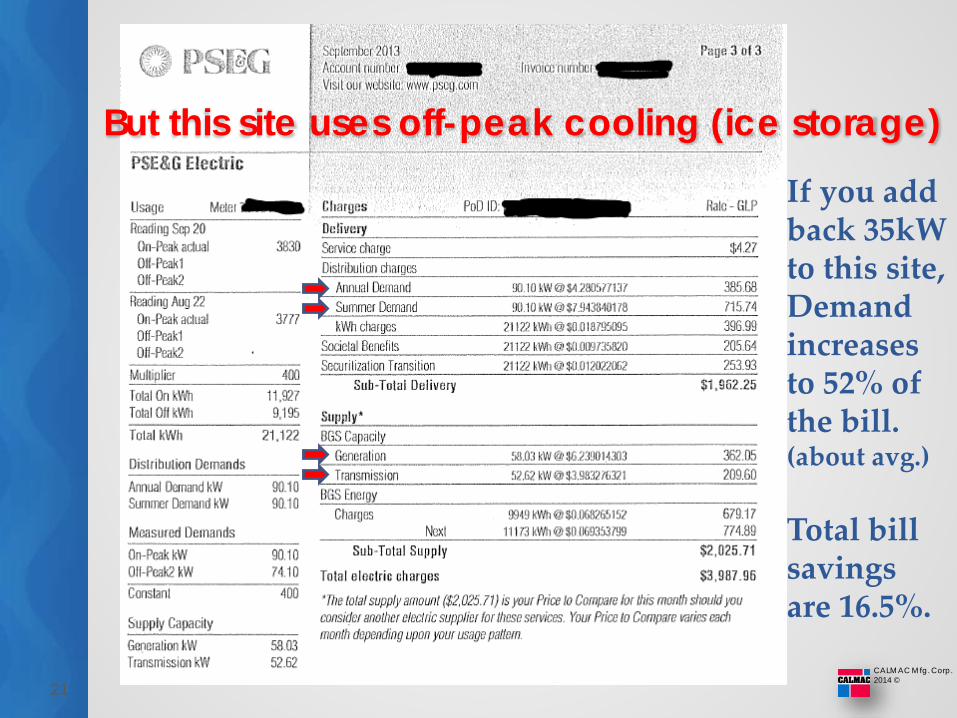
21
But this site uses off-peak cooling (ice storage)If you add back 35kW to this site, Demand increases to 52% of the bill. (about avg.)
Total bill savings are 16.5%.
CALMAC Mfg. Corp. 2014 ©
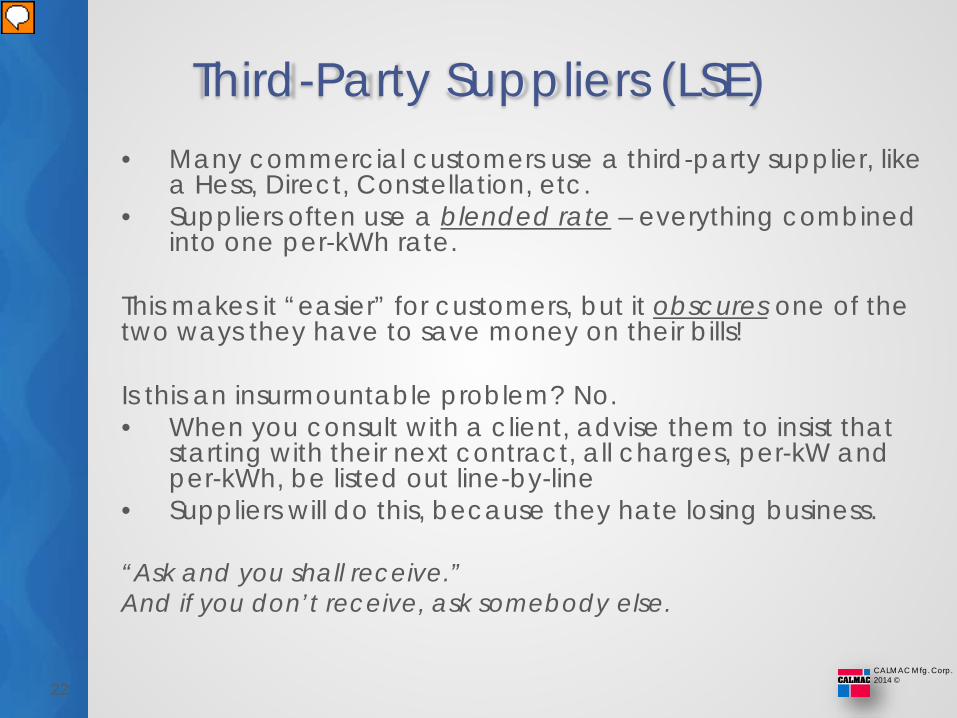
Third-Party Suppliers (LSE)• Many commercial customers use a third-party supplier, like
a Hess, Direct, Constellation, etc. • Suppliers often use a blended rate – everything combined
into one per-kWh rate.
This makes it “easier” for customers, but it obscures one of the two ways they have to save money on their bills!
Is this an insurmountable problem? No. • When you consult with a client, advise them to insist that
starting with their next contract, all charges, per-kW and per-kWh, be listed out line-by-line
• Suppliers will do this, because they hate losing business.
“Ask and you shall receive.” And if you don’t receive, ask somebody else.
22
CALMAC Mfg. Corp. 2014 ©
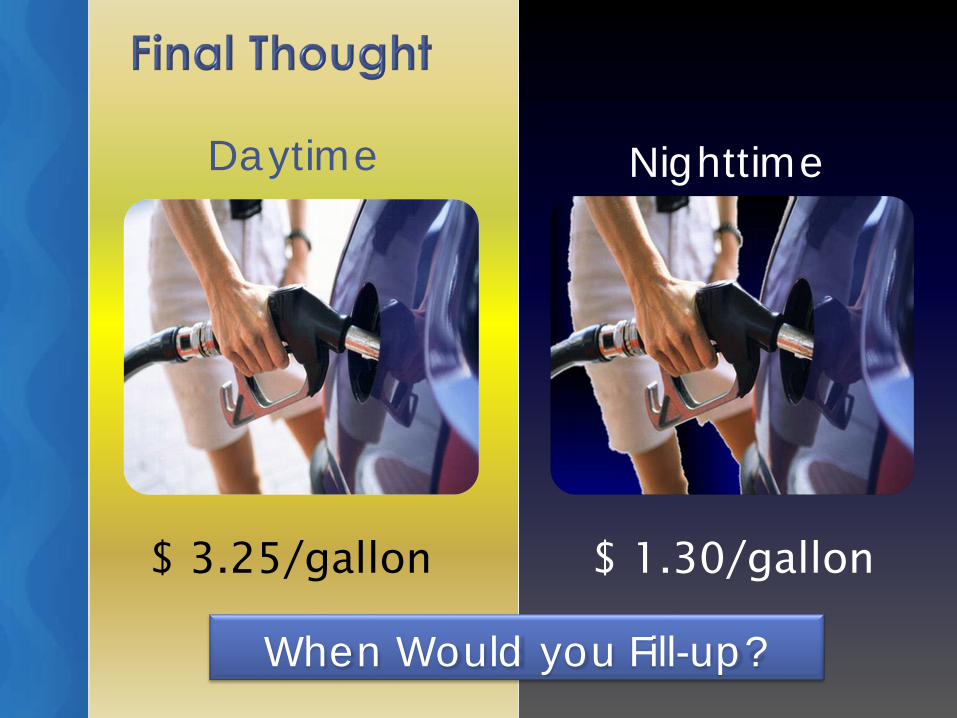
When Would you Fill-up?
Daytime
$ 3.25/gallon
Nighttime
$ 1.30/gallon

CALMAC Mfg. Corp. 2014 ©
24
Questions?
Evan Berger, Director of Energy SolutionsCALMAC Manufacturing Corp.

CALMAC Mfg. Corp. 2014 ©
25
APPENDIXor, slides that were left on the cutting floor
CALMAC Mfg. Corp. 2014 ©
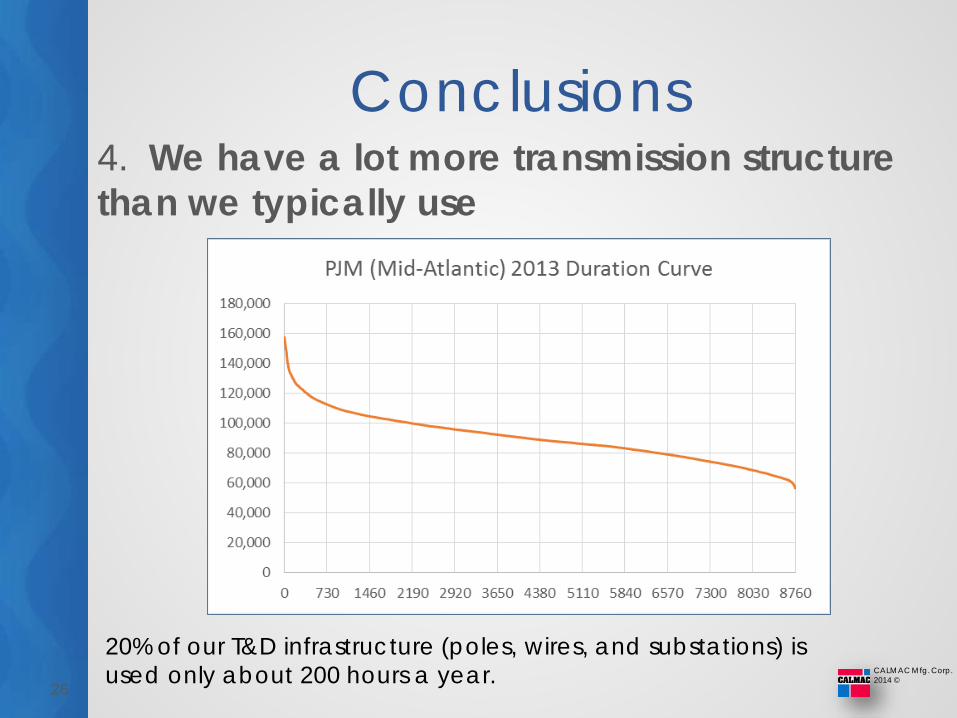
Conclusions4. We have a lot more transmission structure than we typically use
26
20% of our T&D infrastructure (poles, wires, and substations) is used only about 200 hours a year.
CALMAC Mfg. Corp. 2014 ©
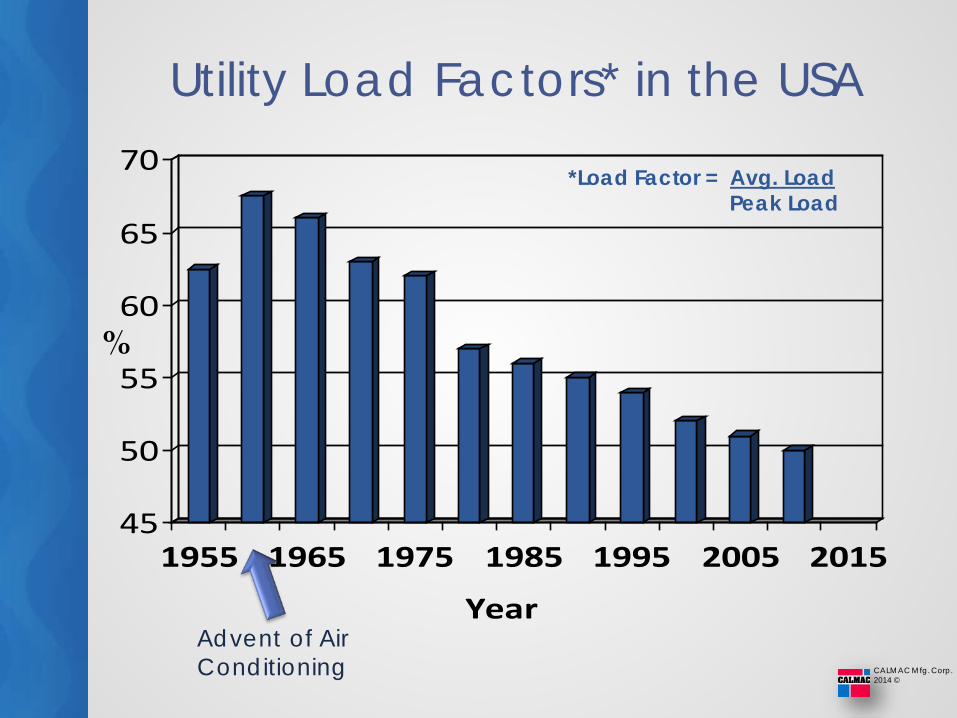
Utility Load Factors* in the USA
45
50
55
60
65
70
1955 1965 1975 1985 1995 2005 2015
Year
*Load Factor = Avg. LoadPeak Load
%
Advent of Air Conditioning
CALMAC Mfg. Corp. 2014 ©
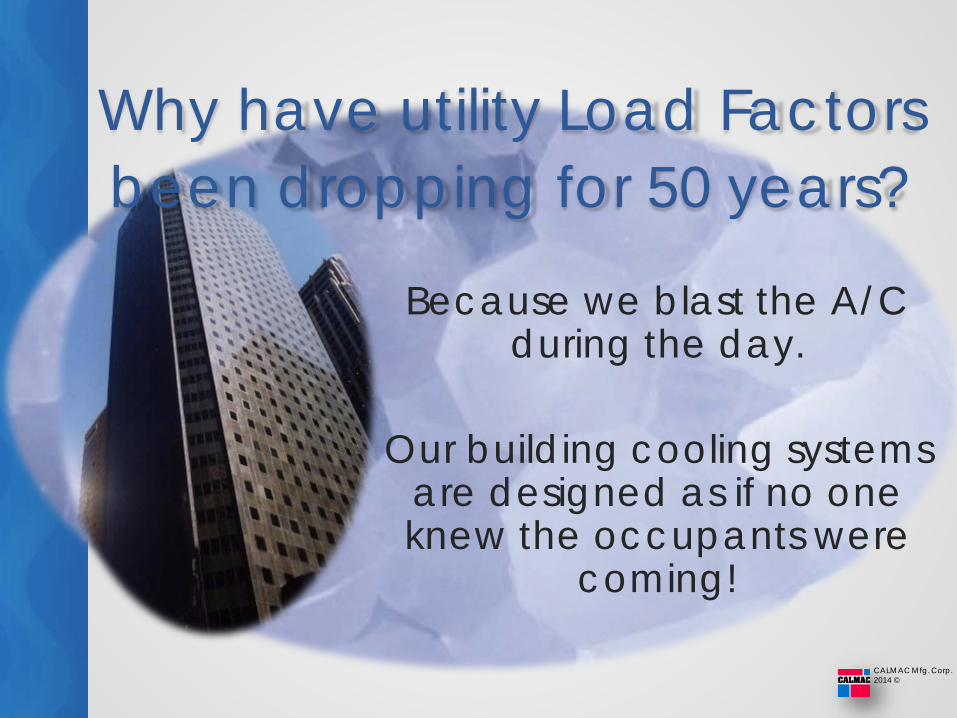
Because we blast the A/C during the day.
Our building cooling systems are designed as if no one knew the occupants were
coming!
Why have utility Load Factors been dropping for 50 years?
CALMAC Mfg. Corp. 2014 ©
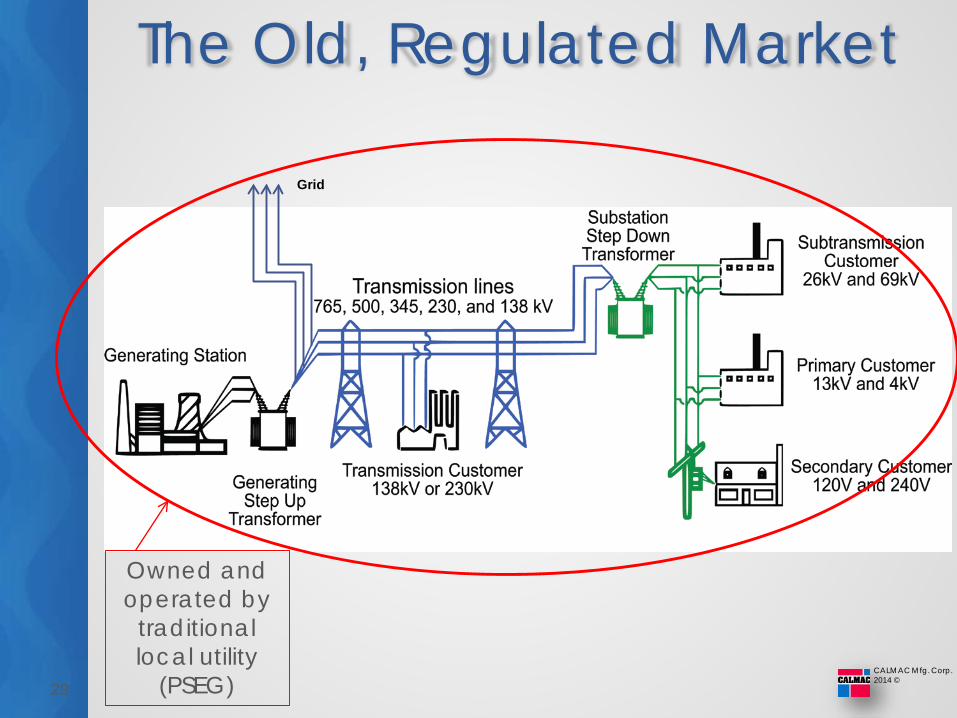
The Old, Regulated Market
29
Grid
Owned and operated by
traditional local utility
(PSEG)
CALMAC Mfg. Corp. 2014 ©
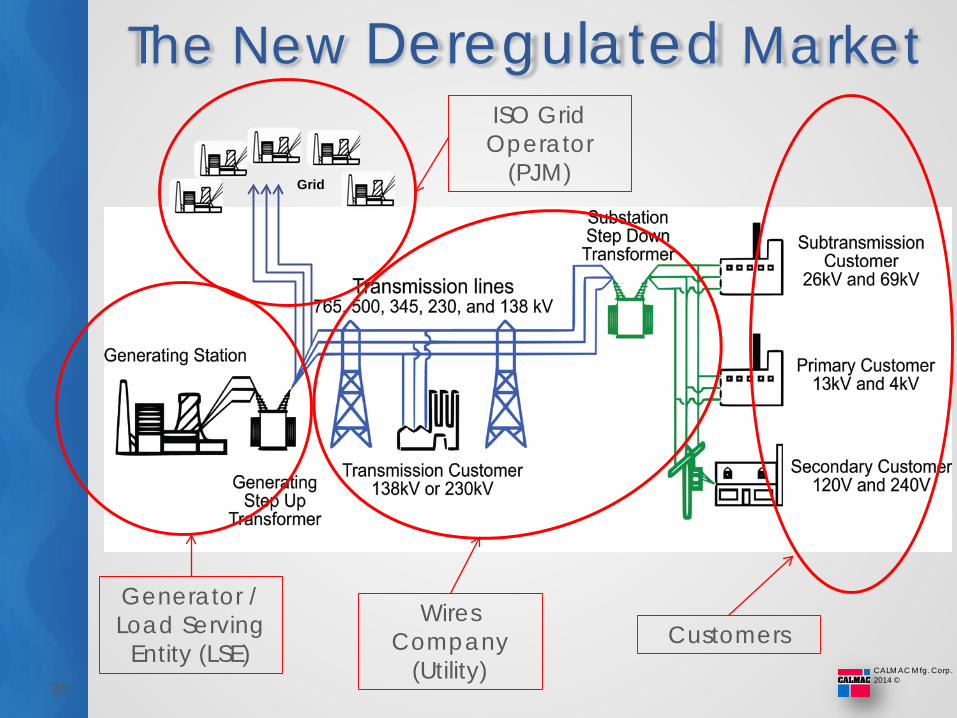
The New Deregulated Market
30
Grid
Generator / Load Serving
Entity (LSE)
ISO Grid Operator
(PJM)
Wires Company
(Utility)Customers
CALMAC Mfg. Corp. 2014 ©
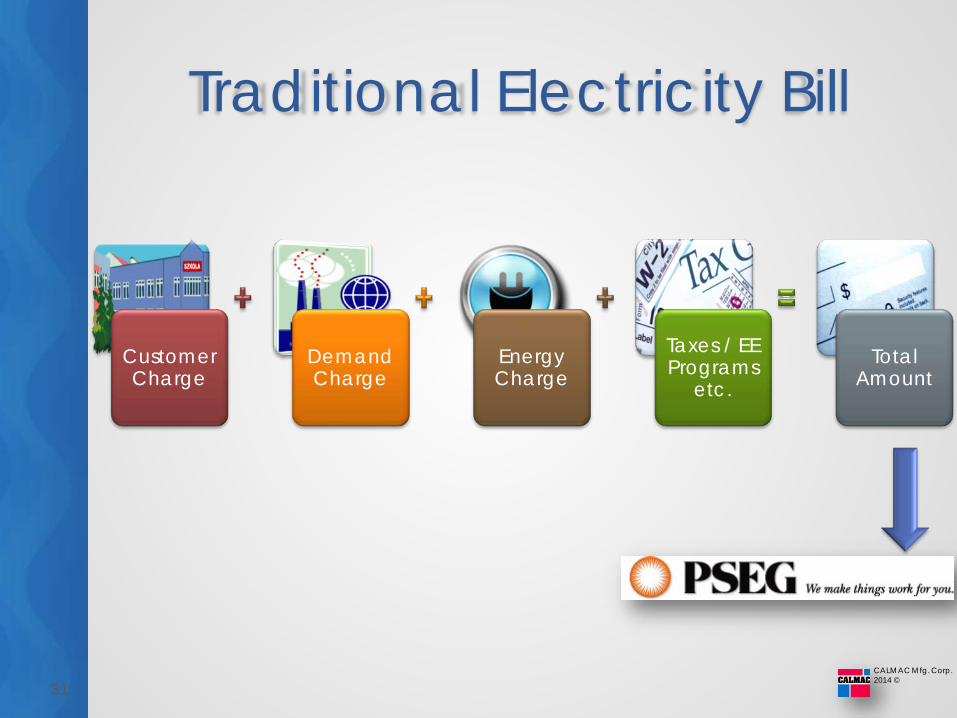
Traditional Electricity Bill
31
Customer Charge
Demand Charge
Energy Charge
Taxes / EE Programs
etc.
=
Total Amount
CALMAC Mfg. Corp. 2014 ©
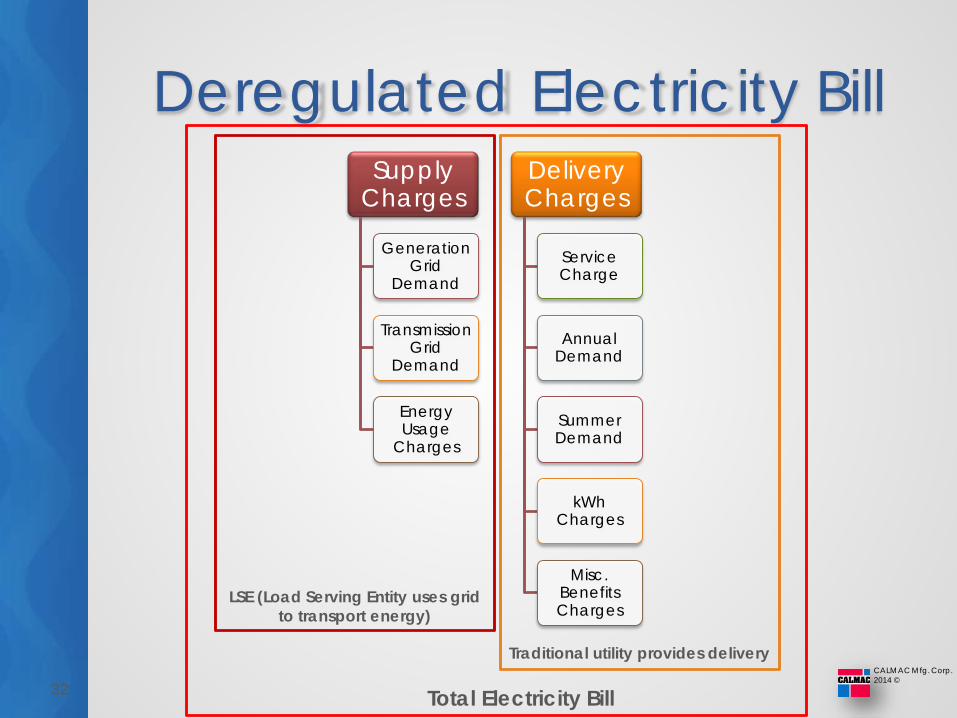
Deregulated Electricity Bill
32
Supply Charges
Generation Grid
Demand
Transmission Grid
Demand
Energy Usage
Charges
Delivery Charges
Service Charge
Annual Demand
Summer Demand
kWh Charges
Misc. Benefits Charges
LSE (Load Serving Entity uses gridto transport energy)
Traditional utility provides delivery
Total Electricity Bill
CALMAC Mfg. Corp. 2014 ©
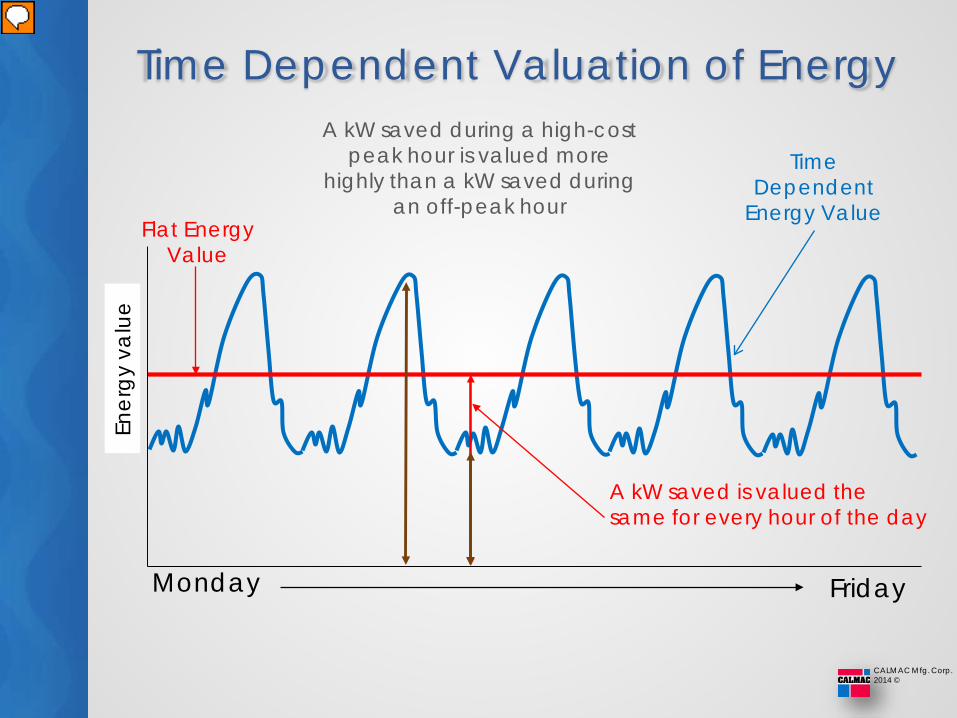
Time Dependent Valuation of Energy
Monday Friday
A kW saved is valued the same for every hour of the day
A kW saved during a high-cost peak hour is valued more
highly than a kW saved during an off-peak hour
Flat Energy Value
Time Dependent
Energy Value
Ener
gy v
alu
e