Embed Size (px)
Citation preview
Why Is Sales & Operations Planning So Hard? Insights from Quantitative Studies
5/28/2015
By Lora Cecere
Founder and CEO Supply Chain Insights LLC
Page 2
Contents
Research Methodology
Disclosure
Executive Overview
What Is S&OP Maturity?
Five Barriers to S&OP Maturity
Misconceptions
Conclusion
Other Reports in This Series
Appendix
About Supply Chain Insights, LLC
About Lora Cecere
3
4
6
7
11
17
23
24
25
31
31
Page 3
Research Methodology This report answers the question “Why is S&OP so hard?” It is based on the results of two recent
quantitative surveys: one survey on Sales and Operations Planning (S&OP) and another survey on
the use of inventory management technologies. To gain additional insights, and to make this a better
report, both sets of findings were vetted with small roundtables of supply chain professionals.
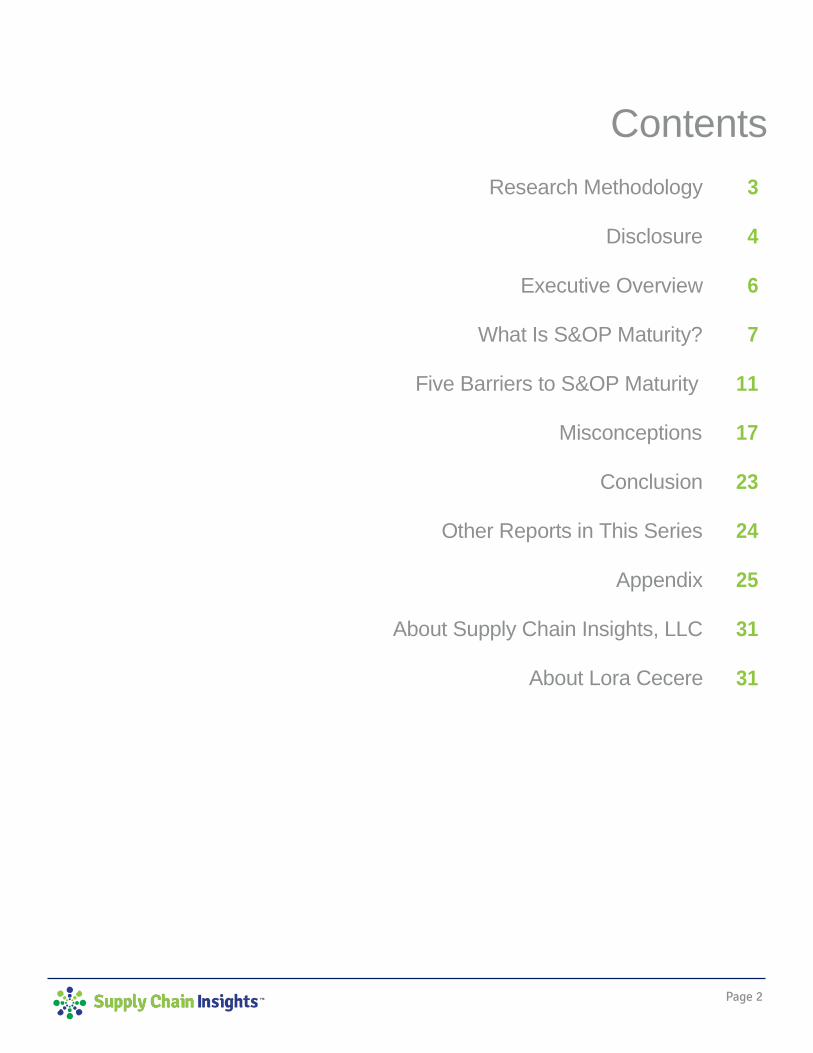
In Figure 1, we share the objectives, methodology, and demographics of the S&OP study, and in
Figure 2, we share the design of the inventory management study. In this report we use the outputs of
these two studies to explain why S&OP as a business process is so hard.
Figure 1. Survey Overview of the S&OP Study
Page 4
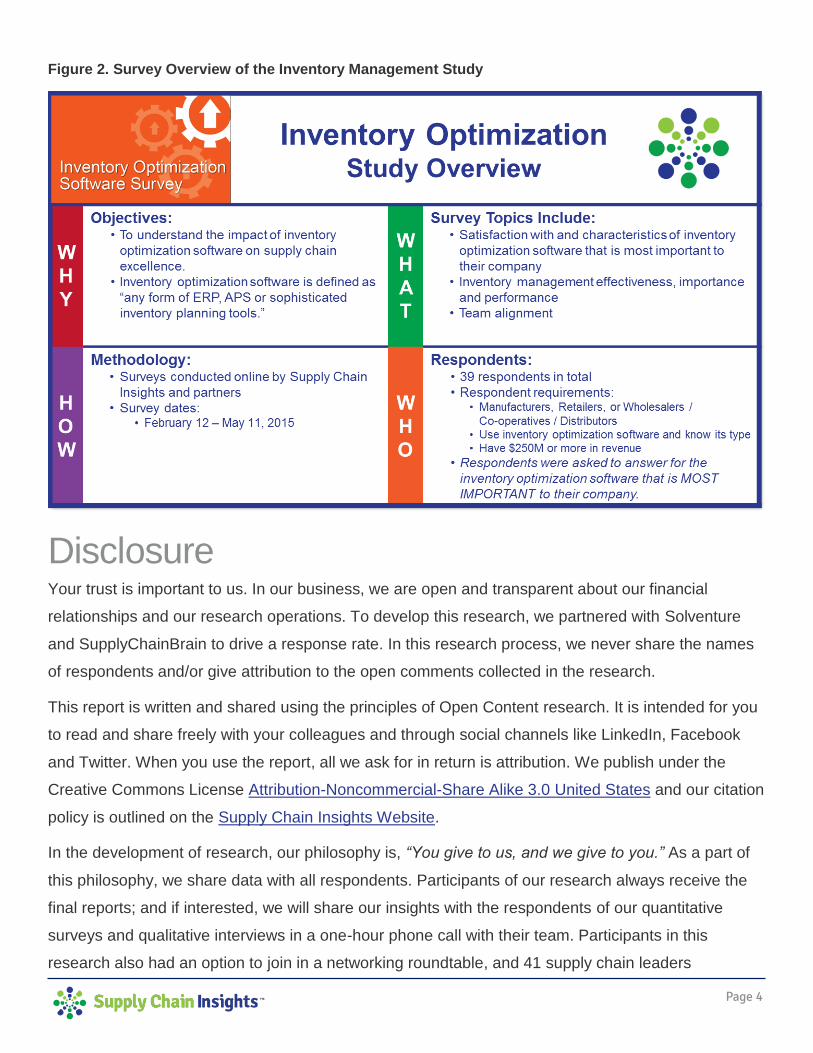
Figure 2. Survey Overview of the Inventory Management Study
Disclosure Your trust is important to us. In our business, we are open and transparent about our financial
relationships and our research operations. To develop this research, we partnered with Solventure
and SupplyChainBrain to drive a response rate. In this research process, we never share the names
of respondents and/or give attribution to the open comments collected in the research.
This report is written and shared using the principles of Open Content research. It is intended for you
to read and share freely with your colleagues and through social channels like LinkedIn, Facebook
and Twitter. When you use the report, all we ask for in return is attribution. We publish under the
Creative Commons License Attribution-Noncommercial-Share Alike 3.0 United States and our citation
policy is outlined on the Supply Chain Insights Website.
In the development of research, our philosophy is, “You give to us, and we give to you.” As a part of
this philosophy, we share data with all respondents. Participants of our research always receive the
final reports; and if interested, we will share our insights with the respondents of our quantitative
surveys and qualitative interviews in a one-hour phone call with their team. Participants in this
research also had an option to join in a networking roundtable, and 41 supply chain leaders

Page 5
participated in these roundtables. Where appropriate, we share their feedback on the quantitative
study in this report.
We are committed to delivering thought-leading content for the supply chain leader. It is our goal for
Supply Chain Insights to be the place where visionaries turn to gain an understanding of the future of
supply chain management.
Page 6
Executive Overview Sales and Operations Planning (S&OP), the cross-functional process to align the commercial
processes of sales and marketing with the operational processes of supply and manufacturing, is
having a renaissance. It is not a new process. Companies have worked on these processes for over
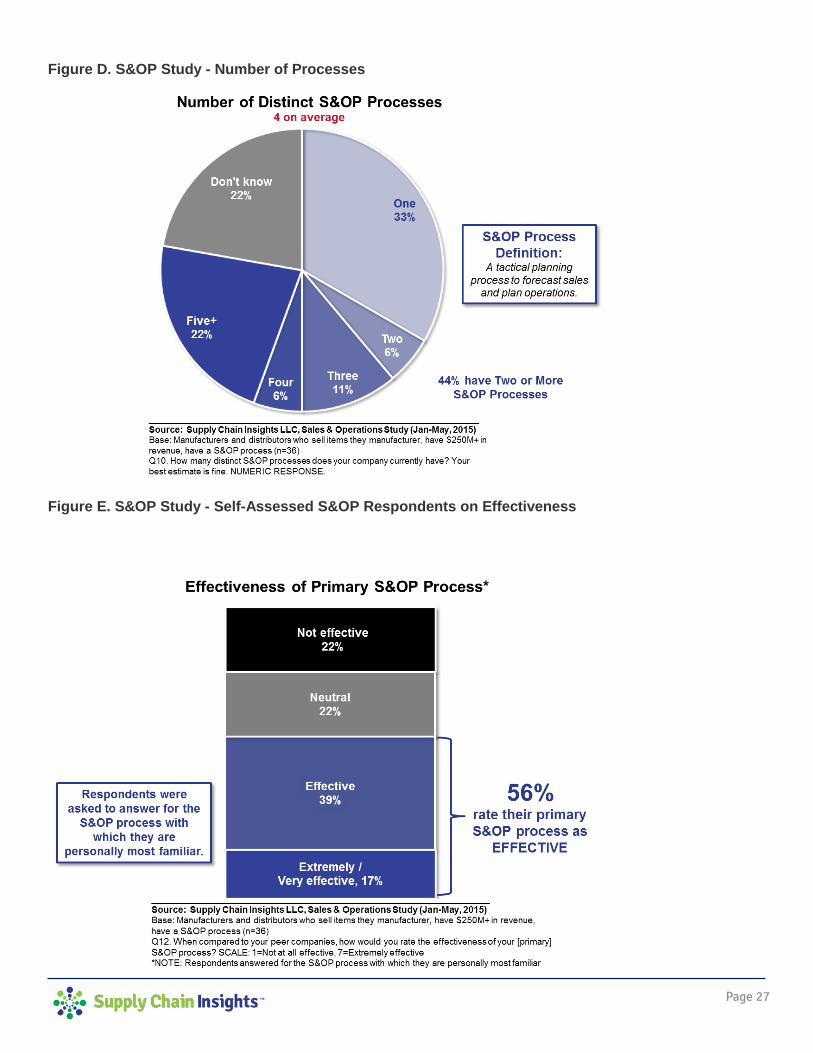
35 years; but today, only one out of two companies believes that their processes are effective.
Why is it so hard? Answering this question is the goal of this report.
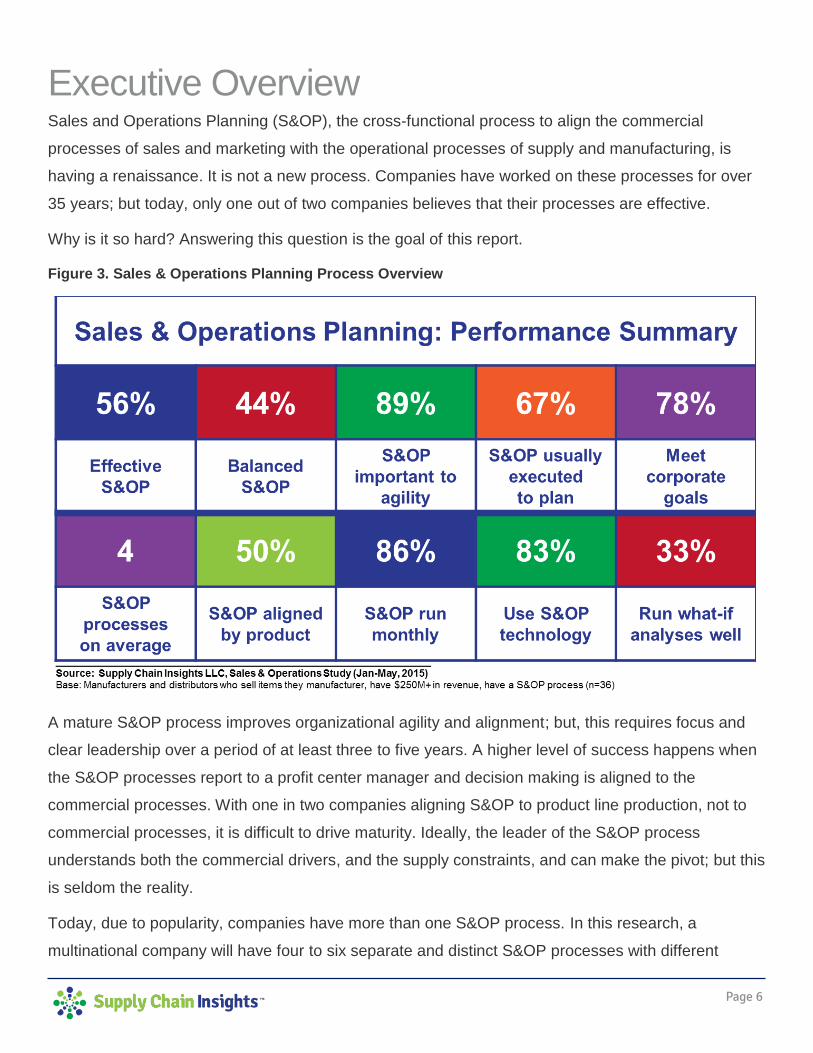
Figure 3. Sales & Operations Planning Process Overview
A mature S&OP process improves organizational agility and alignment; but, this requires focus and
clear leadership over a period of at least three to five years. A higher level of success happens when
the S&OP processes report to a profit center manager and decision making is aligned to the
commercial processes. With one in two companies aligning S&OP to product line production, not to
commercial processes, it is difficult to drive maturity. Ideally, the leader of the S&OP process
understands both the commercial drivers, and the supply constraints, and can make the pivot; but this
is seldom the reality.
Today, due to popularity, companies have more than one S&OP process. In this research, a
multinational company will have four to six separate and distinct S&OP processes with different
Page 7
maturity levels. While many will try to drive improvements with big technology initiatives, based on a
decade of research on the topic, we recommend starting by tackling the change management issues.
In this report, we share five barriers, and four misconceptions while giving supporting research to
challenge change in the organization.
What Is S&OP Maturity? Companies in this study have an average of four different processes, each with differing levels of
maturity. With the growth of the global multinational, based on our advisory work with clients, this is a
very common situation.
One of the first questions that an S&OP leadership team will ask is, “How do I define S&OP
maturity?” The maturity of an S&OP process can easily be determined by answering five questions:
What are the goals of the S&OP processes?
How is balance achieved between demand and supply?
How are decisions made? Are the decisions made in a cadence to the market?
How does the organization measure success?
How is S&OP tied to execution?
The maturity of the S&OP process needs to be a carefully controlled migration. The definition of both
process excellence and technology requirements are very different along the life cycle of S&OP
maturity. To understand S&OP maturity, let’s start with a discussion of goal evolution within S&OP
processes, and then discuss the issues and complexities of S&OP governance. A diagram outlining
S&OP process goal definition and evolution is shared in Figure 4.
Page 8
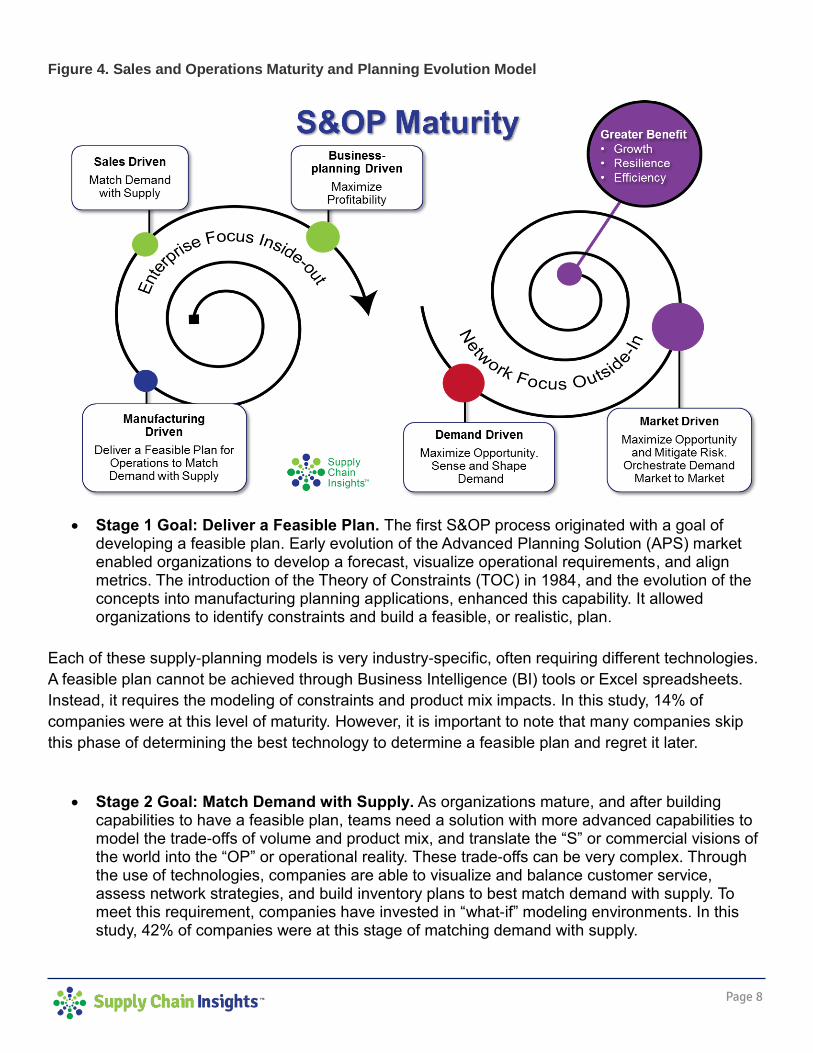
Figure 4. Sales and Operations Maturity and Planning Evolution Model
Stage 1 Goal: Deliver a Feasible Plan. The first S&OP process originated with a goal of developing a feasible plan. Early evolution of the Advanced Planning Solution (APS) market enabled organizations to develop a forecast, visualize operational requirements, and align metrics. The introduction of the Theory of Constraints (TOC) in 1984, and the evolution of the concepts into manufacturing planning applications, enhanced this capability. It allowed organizations to identify constraints and build a feasible, or realistic, plan.
Each of these supply-planning models is very industry-specific, often requiring different technologies.
A feasible plan cannot be achieved through Business Intelligence (BI) tools or Excel spreadsheets.
Instead, it requires the modeling of constraints and product mix impacts. In this study, 14% of
companies were at this level of maturity. However, it is important to note that many companies skip
this phase of determining the best technology to determine a feasible plan and regret it later.
Stage 2 Goal: Match Demand with Supply. As organizations mature, and after building capabilities to have a feasible plan, teams need a solution with more advanced capabilities to model the trade-offs of volume and product mix, and translate the “S” or commercial visions of the world into the “OP” or operational reality. These trade-offs can be very complex. Through the use of technologies, companies are able to visualize and balance customer service, assess network strategies, and build inventory plans to best match demand with supply. To meet this requirement, companies have invested in “what-if” modeling environments. In this study, 42% of companies were at this stage of matching demand with supply.
Page 9
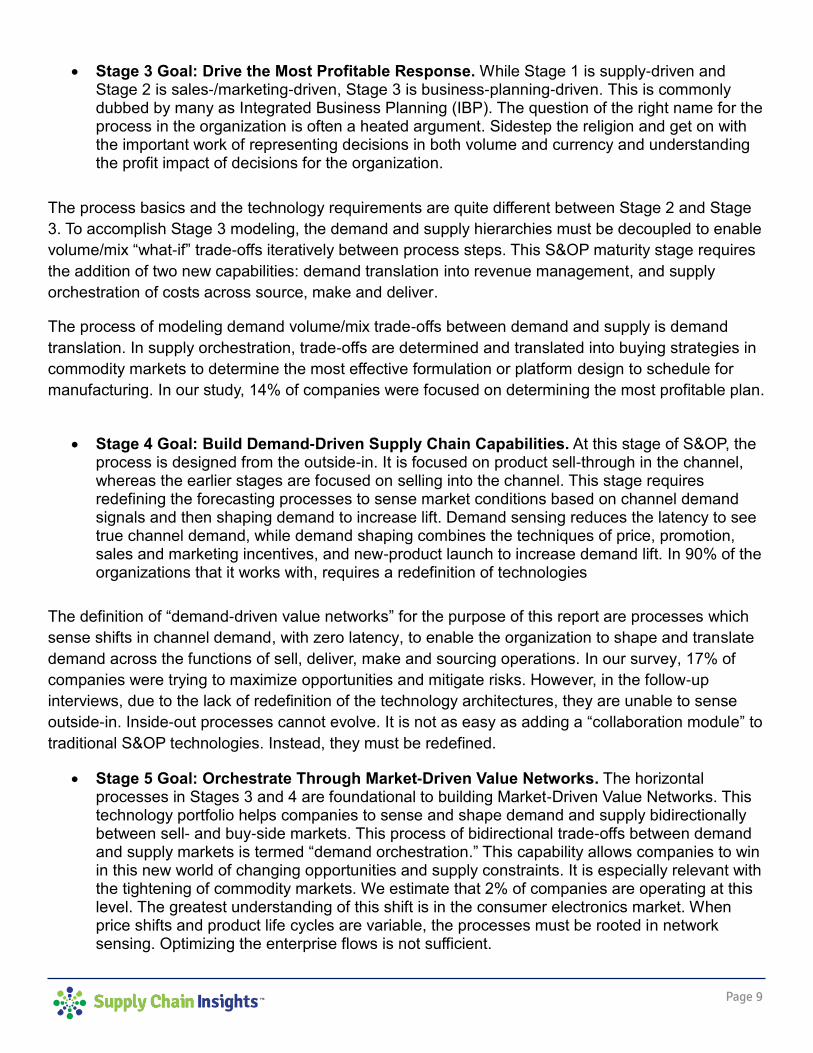
Stage 3 Goal: Drive the Most Profitable Response. While Stage 1 is supply-driven and Stage 2 is sales-/marketing-driven, Stage 3 is business-planning-driven. This is commonly dubbed by many as Integrated Business Planning (IBP). The question of the right name for the process in the organization is often a heated argument. Sidestep the religion and get on with the important work of representing decisions in both volume and currency and understanding the profit impact of decisions for the organization.
The process basics and the technology requirements are quite different between Stage 2 and Stage
3. To accomplish Stage 3 modeling, the demand and supply hierarchies must be decoupled to enable
volume/mix “what-if” trade-offs iteratively between process steps. This S&OP maturity stage requires
the addition of two new capabilities: demand translation into revenue management, and supply
orchestration of costs across source, make and deliver.
The process of modeling demand volume/mix trade-offs between demand and supply is demand
translation. In supply orchestration, trade-offs are determined and translated into buying strategies in
commodity markets to determine the most effective formulation or platform design to schedule for
manufacturing. In our study, 14% of companies were focused on determining the most profitable plan.
Stage 4 Goal: Build Demand-Driven Supply Chain Capabilities. At this stage of S&OP, the process is designed from the outside-in. It is focused on product sell-through in the channel, whereas the earlier stages are focused on selling into the channel. This stage requires redefining the forecasting processes to sense market conditions based on channel demand signals and then shaping demand to increase lift. Demand sensing reduces the latency to see true channel demand, while demand shaping combines the techniques of price, promotion, sales and marketing incentives, and new-product launch to increase demand lift. In 90% of the organizations that it works with, requires a redefinition of technologies
The definition of “demand-driven value networks” for the purpose of this report are processes which
sense shifts in channel demand, with zero latency, to enable the organization to shape and translate
demand across the functions of sell, deliver, make and sourcing operations. In our survey, 17% of
companies were trying to maximize opportunities and mitigate risks. However, in the follow-up
interviews, due to the lack of redefinition of the technology architectures, they are unable to sense
outside-in. Inside-out processes cannot evolve. It is not as easy as adding a “collaboration module” to
traditional S&OP technologies. Instead, they must be redefined.
Stage 5 Goal: Orchestrate Through Market-Driven Value Networks. The horizontal processes in Stages 3 and 4 are foundational to building Market-Driven Value Networks. This technology portfolio helps companies to sense and shape demand and supply bidirectionally between sell- and buy-side markets. This process of bidirectional trade-offs between demand and supply markets is termed “demand orchestration.” This capability allows companies to win in this new world of changing opportunities and supply constraints. It is especially relevant with the tightening of commodity markets. We estimate that 2% of companies are operating at this level. The greatest understanding of this shift is in the consumer electronics market. When price shifts and product life cycles are variable, the processes must be rooted in network sensing. Optimizing the enterprise flows is not sufficient.
Page 10
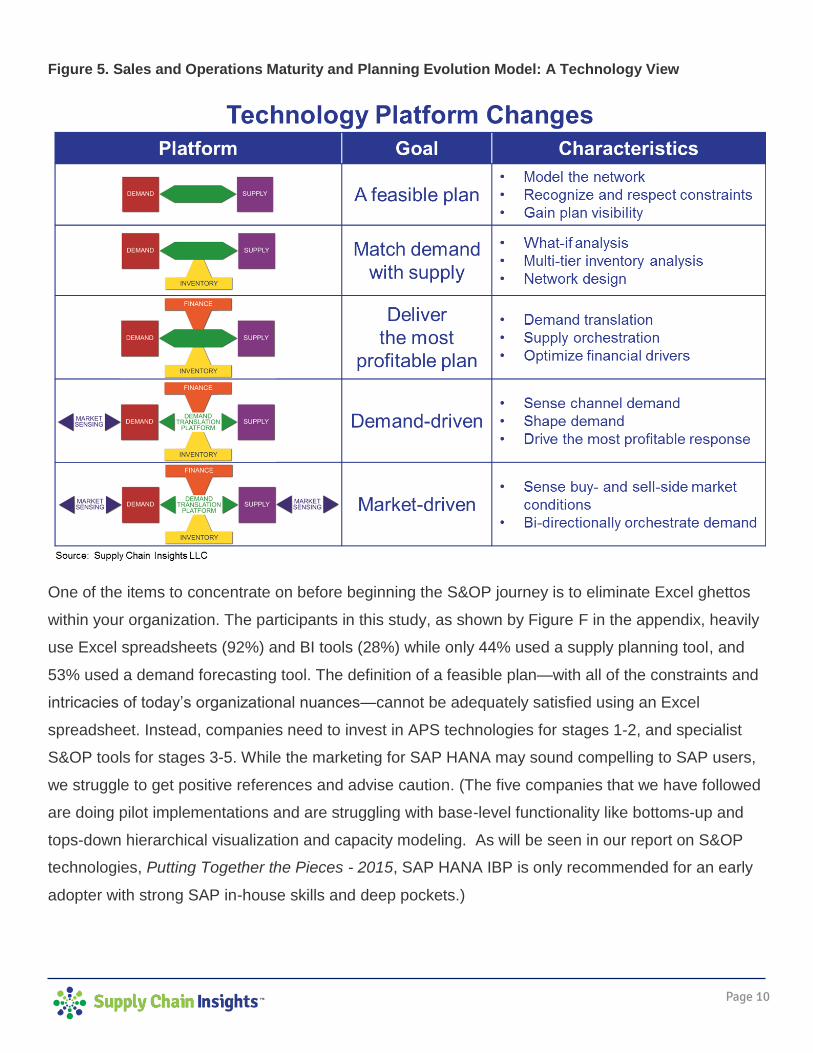
Figure 5. Sales and Operations Maturity and Planning Evolution Model: A Technology View
One of the items to concentrate on before beginning the S&OP journey is to eliminate Excel ghettos
within your organization. The participants in this study, as shown by Figure F in the appendix, heavily
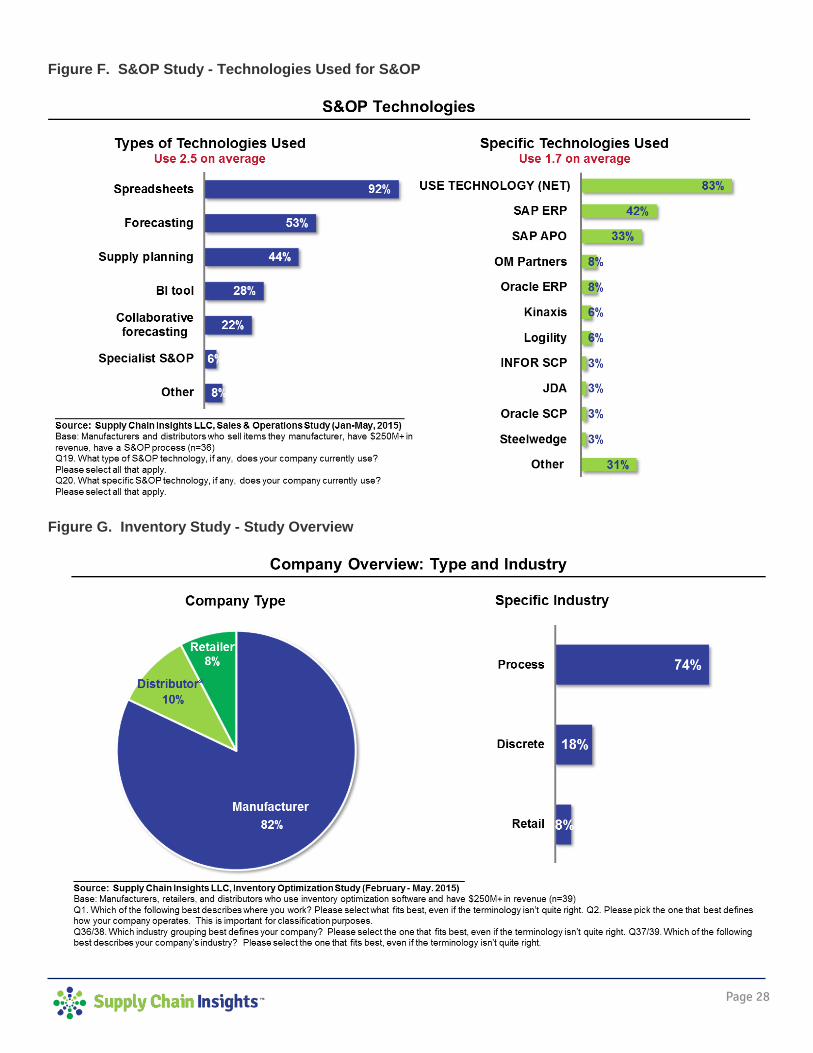
use Excel spreadsheets (92%) and BI tools (28%) while only 44% used a supply planning tool, and
53% used a demand forecasting tool. The definition of a feasible plan—with all of the constraints and
intricacies of today’s organizational nuances—cannot be adequately satisfied using an Excel
spreadsheet. Instead, companies need to invest in APS technologies for stages 1-2, and specialist
S&OP tools for stages 3-5. While the marketing for SAP HANA may sound compelling to SAP users,
we struggle to get positive references and advise caution. (The five companies that we have followed
are doing pilot implementations and are struggling with base-level functionality like bottoms-up and
tops-down hierarchical visualization and capacity modeling. As will be seen in our report on S&OP
technologies, Putting Together the Pieces - 2015, SAP HANA IBP is only recommended for an early
adopter with strong SAP in-house skills and deep pockets.)
Page 11
Five Barriers to S&OP Maturity In our research, and work with clients, we find that the leader of S&OP faces five barriers and four
organizational misconceptions. A barrier is defined as a process or technology gap, whereas a
misconception is deeply rooted in organizational culture. In this report we outline each barrier and
give advice to help the team move past them.
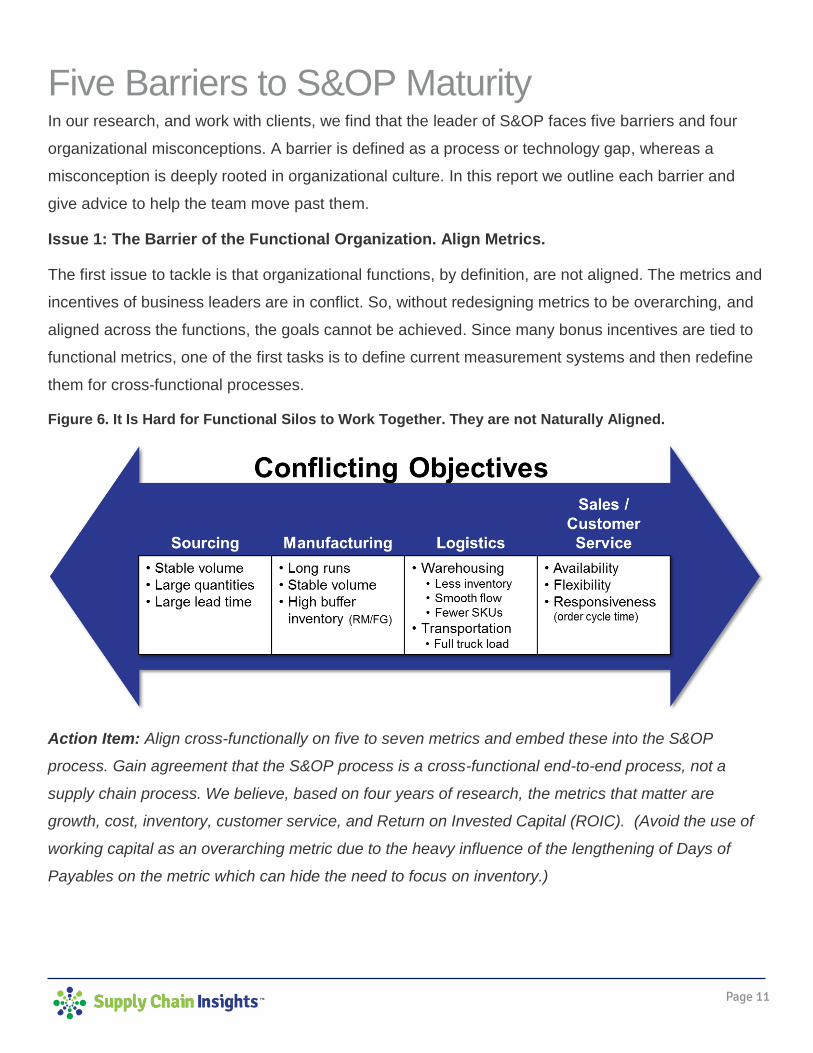
Issue 1: The Barrier of the Functional Organization. Align Metrics.
The first issue to tackle is that organizational functions, by definition, are not aligned. The metrics and
incentives of business leaders are in conflict. So, without redesigning metrics to be overarching, and
aligned across the functions, the goals cannot be achieved. Since many bonus incentives are tied to
functional metrics, one of the first tasks is to define current measurement systems and then redefine
them for cross-functional processes.
Figure 6. It Is Hard for Functional Silos to Work Together. They are not Naturally Aligned.
Action Item: Align cross-functionally on five to seven metrics and embed these into the S&OP
process. Gain agreement that the S&OP process is a cross-functional end-to-end process, not a
supply chain process. We believe, based on four years of research, the metrics that matter are
growth, cost, inventory, customer service, and Return on Invested Capital (ROIC). (Avoid the use of
working capital as an overarching metric due to the heavy influence of the lengthening of Days of
Payables on the metric which can hide the need to focus on inventory.)

Page 12
Issue 2: The Lack of Understanding of the Supply Chain as a Complex System.
For many, the management of the supply chain as a complex system is an enigma. Many executive
teams struggle to understand the tightly-interconnected nonlinear relationships of supply chain
metrics. As a result, the initiative fights to survive with ever-changing priorities. To drive the
improvements that most companies want and crave, the S&OP metrics need to be part of the
operating strategy. The organization needs to be held accountable for shared metrics. We find that
most companies measure too many metrics and that they are not holistic and cross-functional. To
improve S&OP processes, we recommend the metrics of growth, market share, forecast accuracy,
inventory levels, cost (operating margin, EBITDA, or gross margin), Return on Invested Capital
(ROIC) and customer service. These metrics are tightly interwoven with non-linear relationships.
These metrics need to be shared and owned by the entire organization. To make this work, functional
metrics must be reengineered to focus on reliability. Examples of functional reliability metrics include
first-pass yield, schedule adherence, and hands-free orders.
This is not the reality in most organizations. As a result, the metrics are siloed with unequal ownership
across the organization. An unfortunate, but common, example of this is the ownership of inventory.
To make progress, inventory must be owned by the entire organization. However, as seen in Figure
7, inventory is usually owned by the supply chain group, not the entire organization
Figure 7. Inventory Ownership in the Typical Company
Page 13
Action Item: Align cross-functionally on five to seven metrics and embed these into the S&OP
process. Hold the entire organization responsible for the metrics and manage them as a complex
system. While many companies measure working capital, companies should measure inventory
levels directly and hold the entire organization accountable.
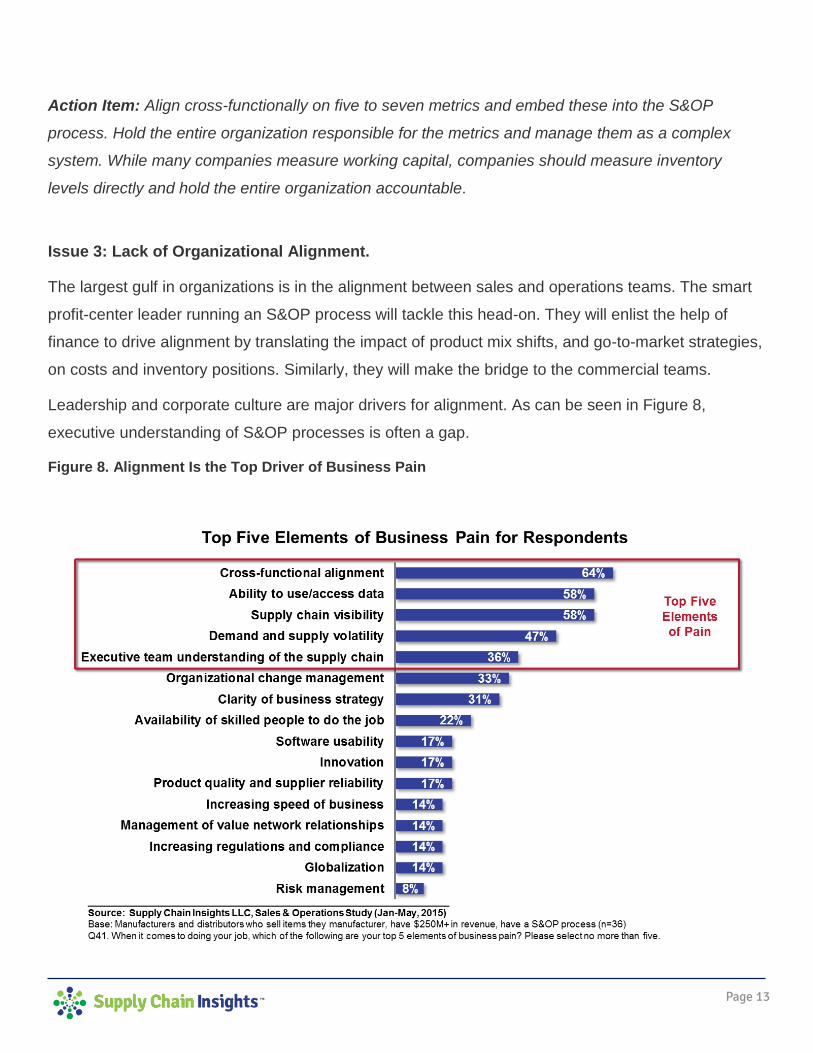
Issue 3: Lack of Organizational Alignment.
The largest gulf in organizations is in the alignment between sales and operations teams. The smart
profit-center leader running an S&OP process will tackle this head-on. They will enlist the help of
finance to drive alignment by translating the impact of product mix shifts, and go-to-market strategies,
on costs and inventory positions. Similarly, they will make the bridge to the commercial teams.
Leadership and corporate culture are major drivers for alignment. As can be seen in Figure 8,
executive understanding of S&OP processes is often a gap.
Figure 8. Alignment Is the Top Driver of Business Pain
Page 14
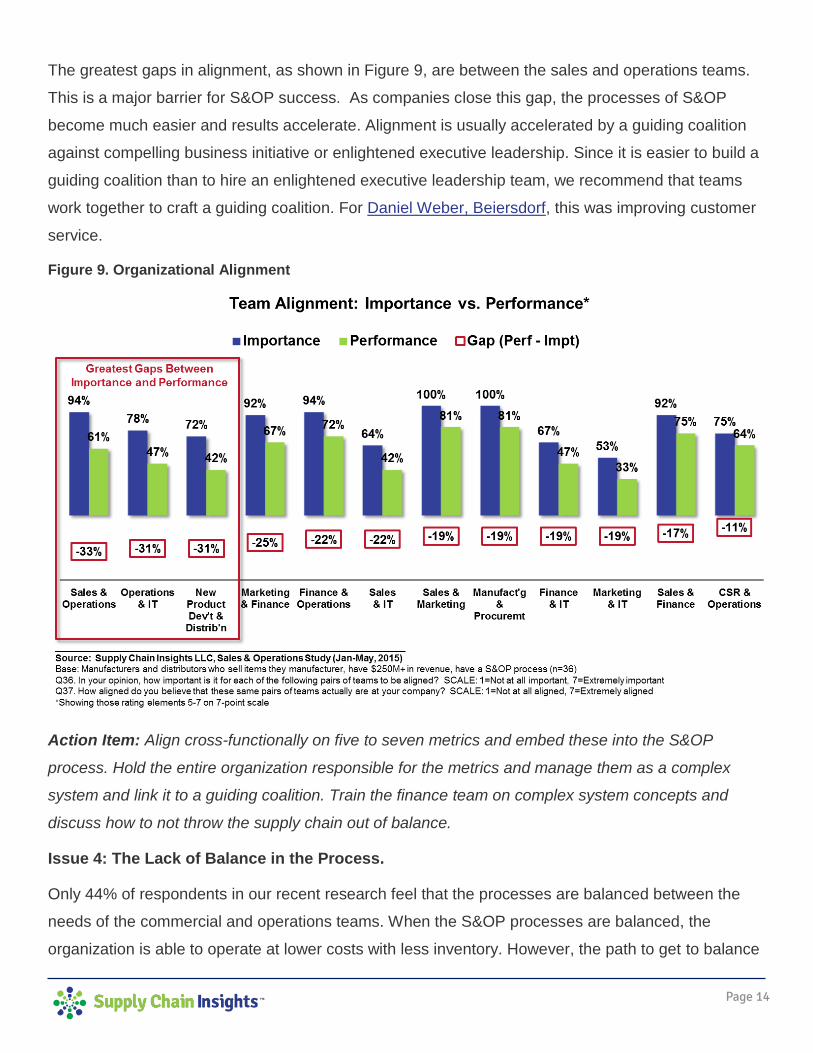
The greatest gaps in alignment, as shown in Figure 9, are between the sales and operations teams.
This is a major barrier for S&OP success. As companies close this gap, the processes of S&OP
become much easier and results accelerate. Alignment is usually accelerated by a guiding coalition
against compelling business initiative or enlightened executive leadership. Since it is easier to build a
guiding coalition than to hire an enlightened executive leadership team, we recommend that teams
work together to craft a guiding coalition. For Daniel Weber, Beiersdorf, this was improving customer
service.
Figure 9. Organizational Alignment
Action Item: Align cross-functionally on five to seven metrics and embed these into the S&OP
process. Hold the entire organization responsible for the metrics and manage them as a complex
system and link it to a guiding coalition. Train the finance team on complex system concepts and
discuss how to not throw the supply chain out of balance.
Issue 4: The Lack of Balance in the Process.
Only 44% of respondents in our recent research feel that the processes are balanced between the
needs of the commercial and operations teams. When the S&OP processes are balanced, the
organization is able to operate at lower costs with less inventory. However, the path to get to balance
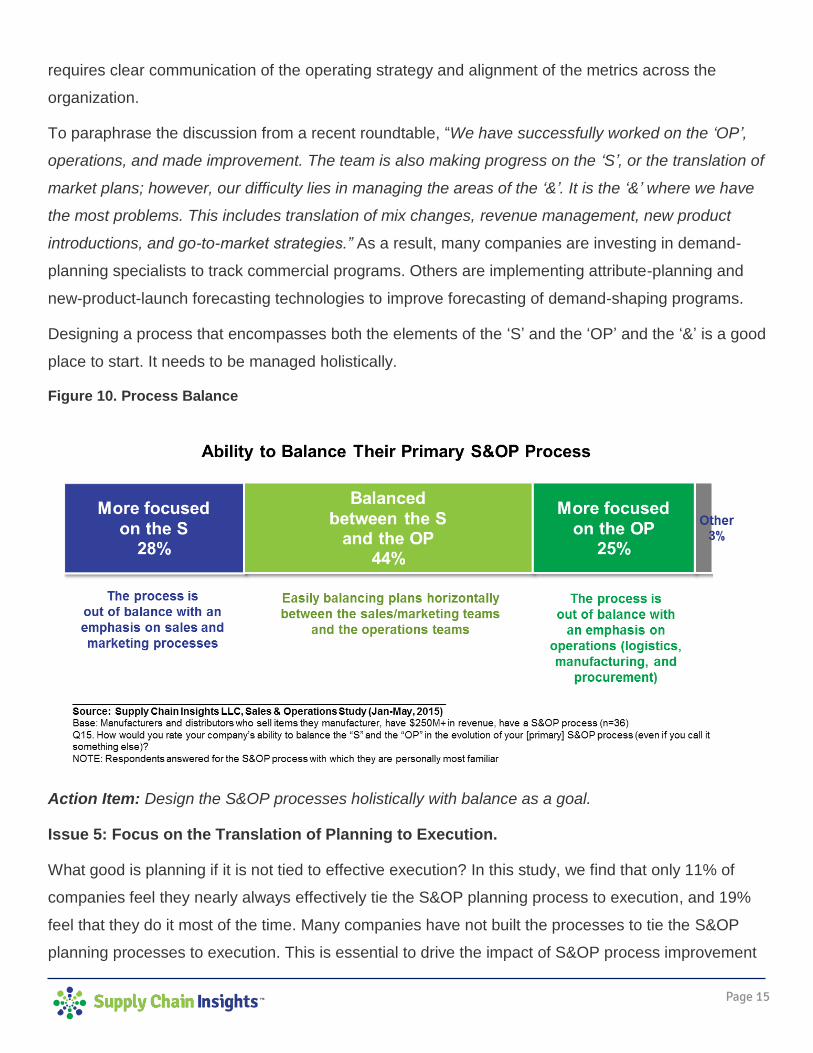
Page 15
requires clear communication of the operating strategy and alignment of the metrics across the
organization.
To paraphrase the discussion from a recent roundtable, “We have successfully worked on the ‘OP’,
operations, and made improvement. The team is also making progress on the ‘S’, or the translation of
market plans; however, our difficulty lies in managing the areas of the ‘&’. It is the ‘&’ where we have
the most problems. This includes translation of mix changes, revenue management, new product
introductions, and go-to-market strategies.” As a result, many companies are investing in demand-
planning specialists to track commercial programs. Others are implementing attribute-planning and
new-product-launch forecasting technologies to improve forecasting of demand-shaping programs.
Designing a process that encompasses both the elements of the ‘S’ and the ‘OP’ and the ‘&’ is a good
place to start. It needs to be managed holistically.
Figure 10. Process Balance
Action Item: Design the S&OP processes holistically with balance as a goal.
Issue 5: Focus on the Translation of Planning to Execution.
What good is planning if it is not tied to effective execution? In this study, we find that only 11% of
companies feel they nearly always effectively tie the S&OP planning process to execution, and 19%
feel that they do it most of the time. Many companies have not built the processes to tie the S&OP
planning processes to execution. This is essential to drive the impact of S&OP process improvement
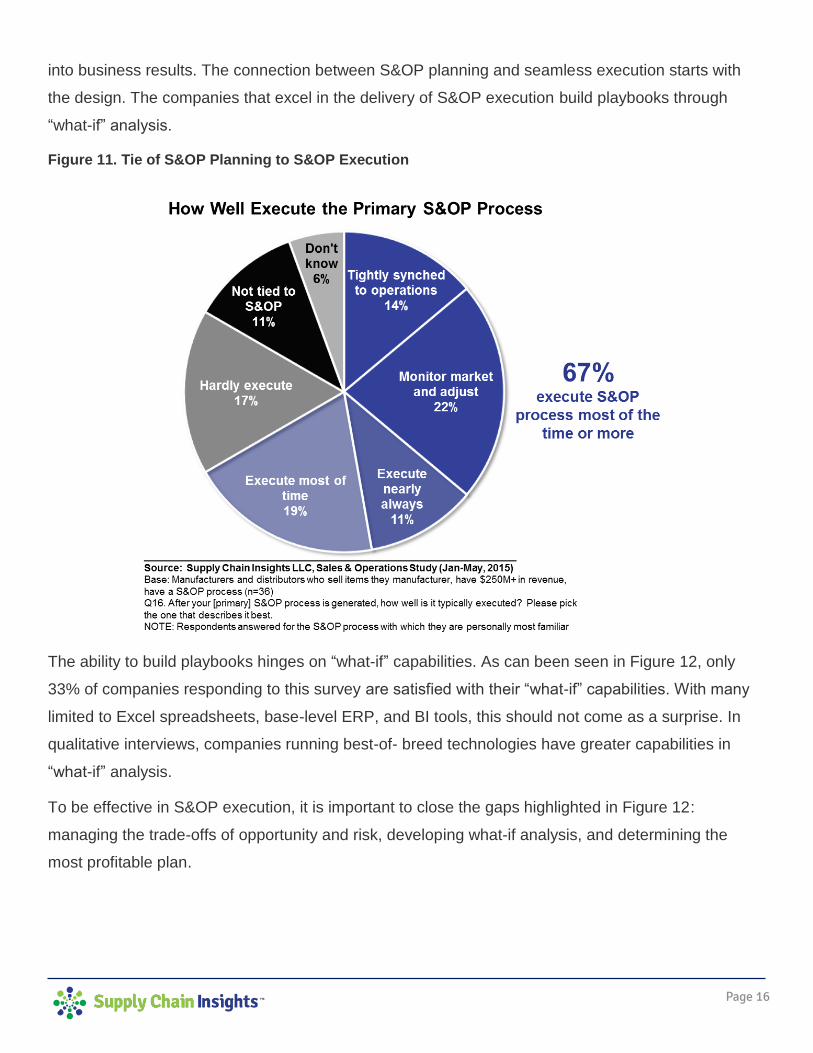
Page 16
into business results. The connection between S&OP planning and seamless execution starts with
the design. The companies that excel in the delivery of S&OP execution build playbooks through
“what-if” analysis.
Figure 11. Tie of S&OP Planning to S&OP Execution
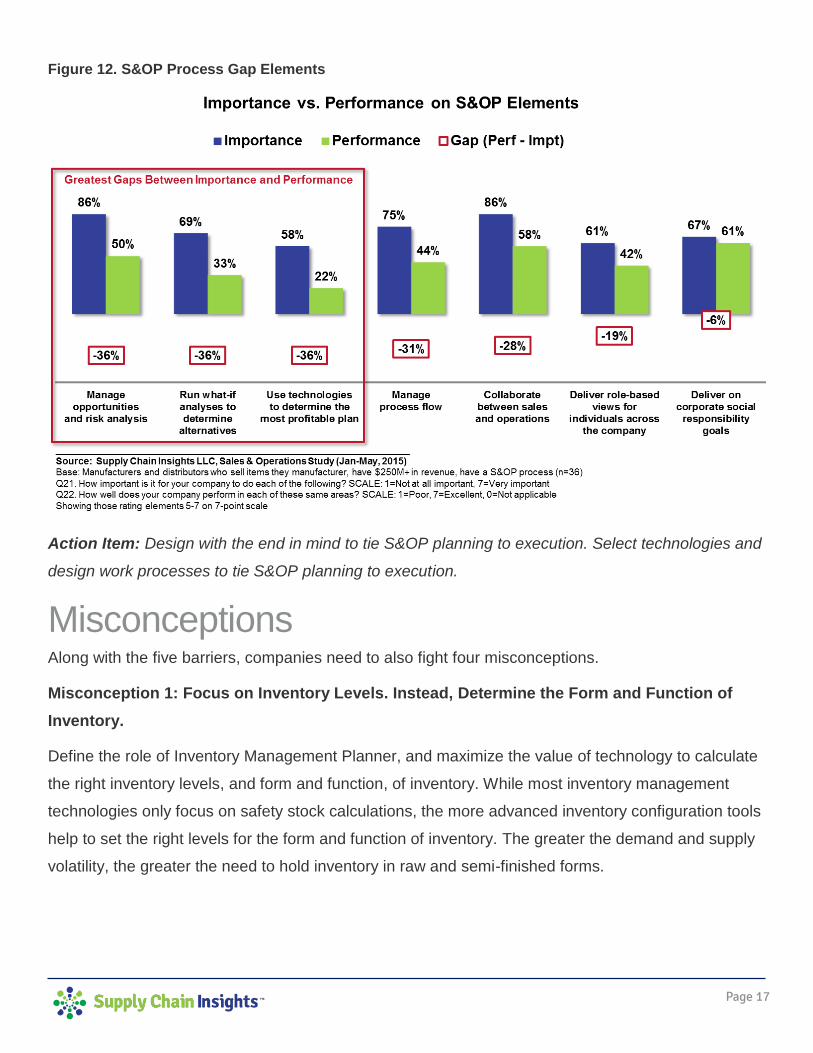
The ability to build playbooks hinges on “what-if” capabilities. As can been seen in Figure 12, only
33% of companies responding to this survey are satisfied with their “what-if” capabilities. With many
limited to Excel spreadsheets, base-level ERP, and BI tools, this should not come as a surprise. In
qualitative interviews, companies running best-of- breed technologies have greater capabilities in
“what-if” analysis.
To be effective in S&OP execution, it is important to close the gaps highlighted in Figure 12:
managing the trade-offs of opportunity and risk, developing what-if analysis, and determining the
most profitable plan.
Page 17
Figure 12. S&OP Process Gap Elements
Action Item: Design with the end in mind to tie S&OP planning to execution. Select technologies and
design work processes to tie S&OP planning to execution.
Misconceptions Along with the five barriers, companies need to also fight four misconceptions.
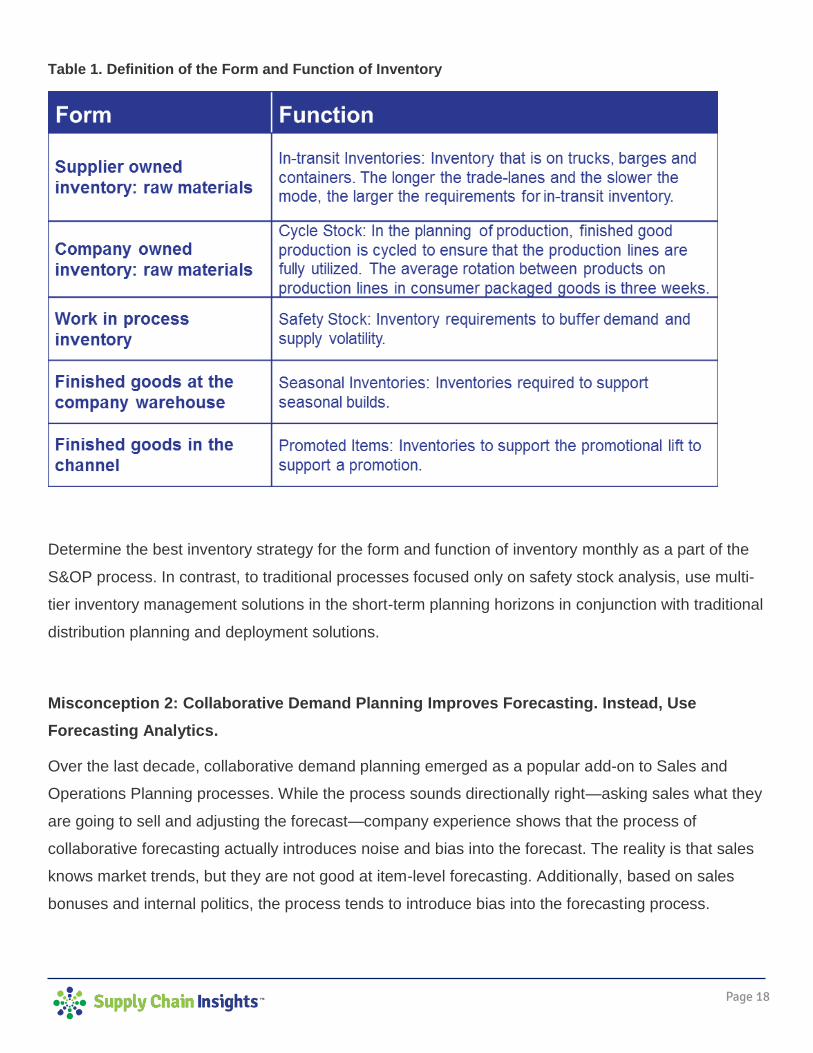
Misconception 1: Focus on Inventory Levels. Instead, Determine the Form and Function of
Inventory.
Define the role of Inventory Management Planner, and maximize the value of technology to calculate
the right inventory levels, and form and function, of inventory. While most inventory management
technologies only focus on safety stock calculations, the more advanced inventory configuration tools
help to set the right levels for the form and function of inventory. The greater the demand and supply
volatility, the greater the need to hold inventory in raw and semi-finished forms.
Page 18
Table 1. Definition of the Form and Function of Inventory
Determine the best inventory strategy for the form and function of inventory monthly as a part of the
S&OP process. In contrast, to traditional processes focused only on safety stock analysis, use multi-
tier inventory management solutions in the short-term planning horizons in conjunction with traditional
distribution planning and deployment solutions.
Misconception 2: Collaborative Demand Planning Improves Forecasting. Instead, Use
Forecasting Analytics.
Over the last decade, collaborative demand planning emerged as a popular add-on to Sales and
Operations Planning processes. While the process sounds directionally right—asking sales what they
are going to sell and adjusting the forecast—company experience shows that the process of
collaborative forecasting actually introduces noise and bias into the forecast. The reality is that sales
knows market trends, but they are not good at item-level forecasting. Additionally, based on sales
bonuses and internal politics, the process tends to introduce bias into the forecasting process.
Page 19
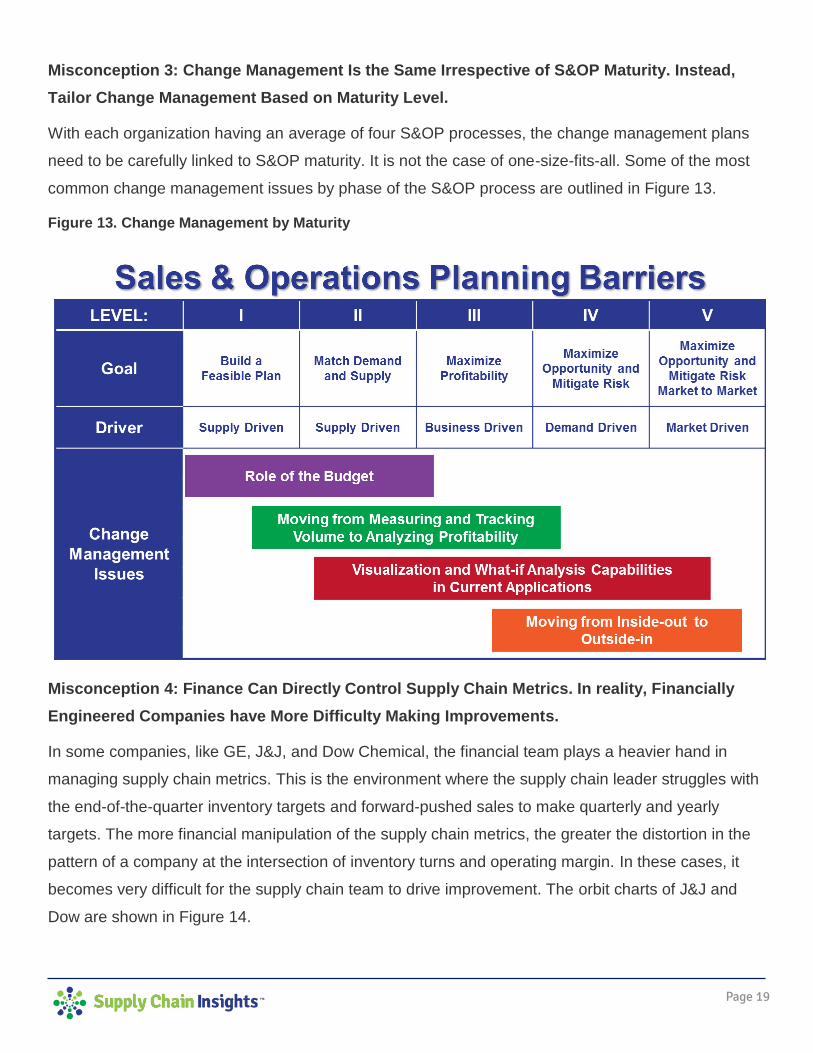
Misconception 3: Change Management Is the Same Irrespective of S&OP Maturity. Instead,
Tailor Change Management Based on Maturity Level.
With each organization having an average of four S&OP processes, the change management plans
need to be carefully linked to S&OP maturity. It is not the case of one-size-fits-all. Some of the most
common change management issues by phase of the S&OP process are outlined in Figure 13.
Figure 13. Change Management by Maturity
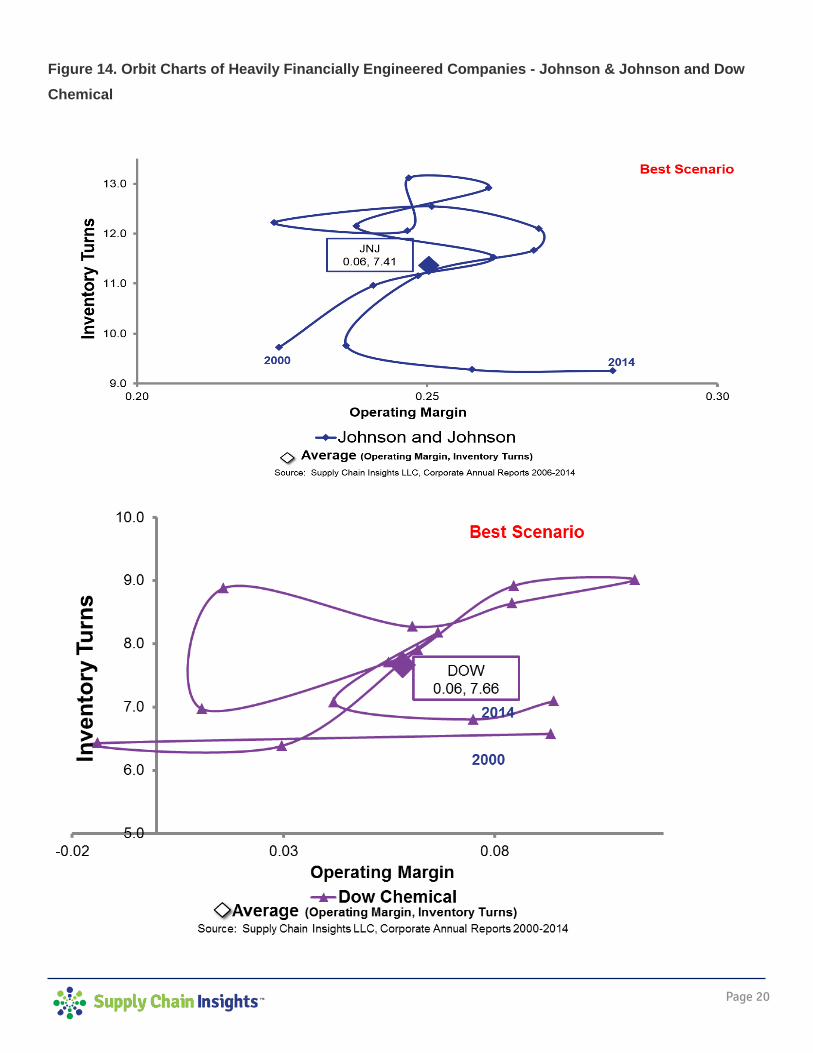
Misconception 4: Finance Can Directly Control Supply Chain Metrics. In reality, Financially
Engineered Companies have More Difficulty Making Improvements.
In some companies, like GE, J&J, and Dow Chemical, the financial team plays a heavier hand in
managing supply chain metrics. This is the environment where the supply chain leader struggles with
the end-of-the-quarter inventory targets and forward-pushed sales to make quarterly and yearly
targets. The more financial manipulation of the supply chain metrics, the greater the distortion in the
pattern of a company at the intersection of inventory turns and operating margin. In these cases, it
becomes very difficult for the supply chain team to drive improvement. The orbit charts of J&J and
Dow are shown in Figure 14.
Page 20
Figure 14. Orbit Charts of Heavily Financially Engineered Companies - Johnson & Johnson and Dow
Chemical
Page 21
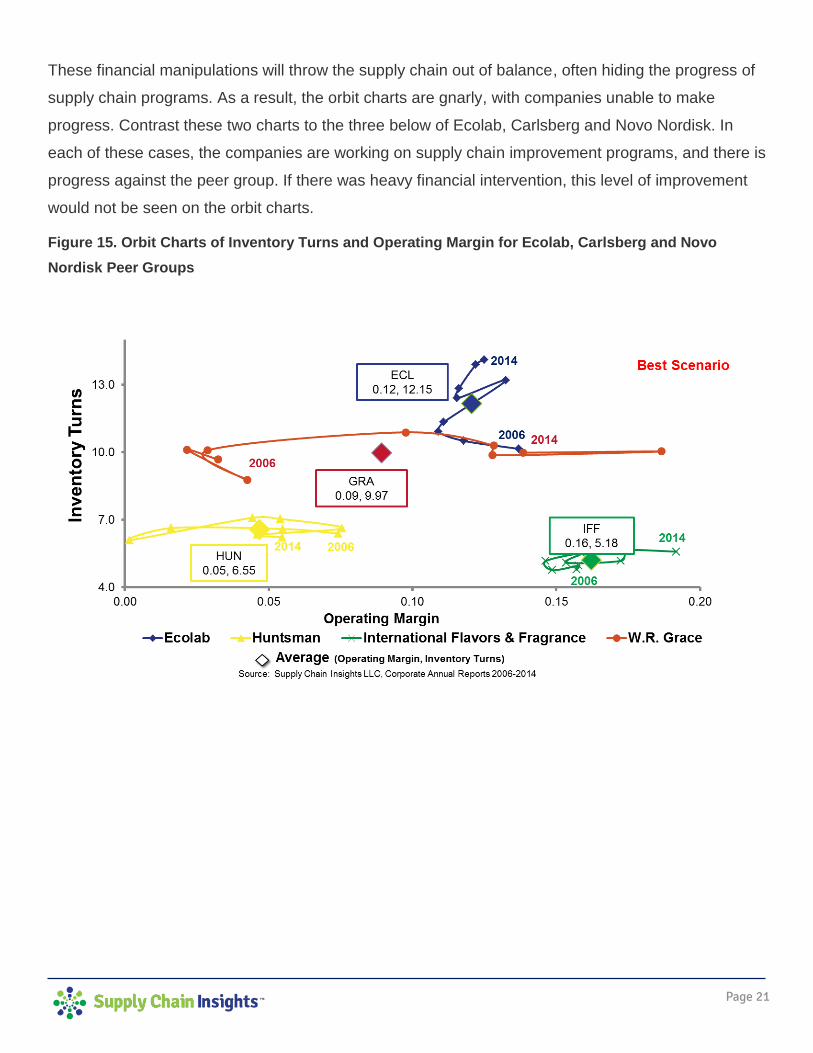
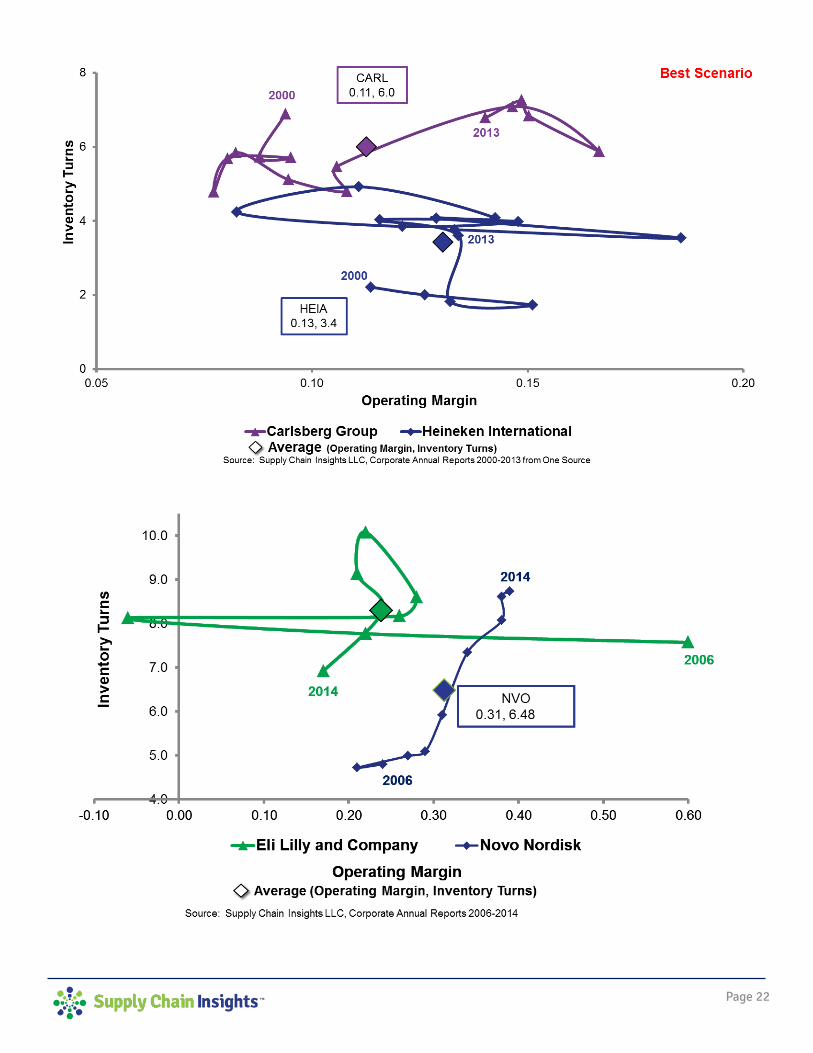
These financial manipulations will throw the supply chain out of balance, often hiding the progress of
supply chain programs. As a result, the orbit charts are gnarly, with companies unable to make
progress. Contrast these two charts to the three below of Ecolab, Carlsberg and Novo Nordisk. In
each of these cases, the companies are working on supply chain improvement programs, and there is
progress against the peer group. If there was heavy financial intervention, this level of improvement
would not be seen on the orbit charts.
Figure 15. Orbit Charts of Inventory Turns and Operating Margin for Ecolab, Carlsberg and Novo
Nordisk Peer Groups
Page 22
Page 23
Conclusion Implementing S&OP processes sounds easy, but it is not. The purpose of this report was to highlight
the issues, and to allow leaders to focus on building an S&OP process with the goal in mind.
Overcome the barriers through process and technology enhancements, and work through the cultural
issues and misconceptions using leadership and influence management.
Page 24
Other Reports in This Series This is the first report Sales and Operations Planning in 2015; however, readers may gain added
value by accessing complimentary reports on Sales and Operations Planning and use of supply chain
applications on our Supply Chain Insights website:
Voice of the Supply Chain Leader
Sales and Operations Planning: Current State of the Union
Maximizing the ROI in Supply Chain Planning
Research in Review 2014
Voice of the Supply Chain Leader 2014
Supply Chains to Admire
Maximizing the Return on Investment in Supply Chain Planning
Three Techniques to Improve Organizational Alignment
Supply Chain Visibility in Business Networks
Page 25
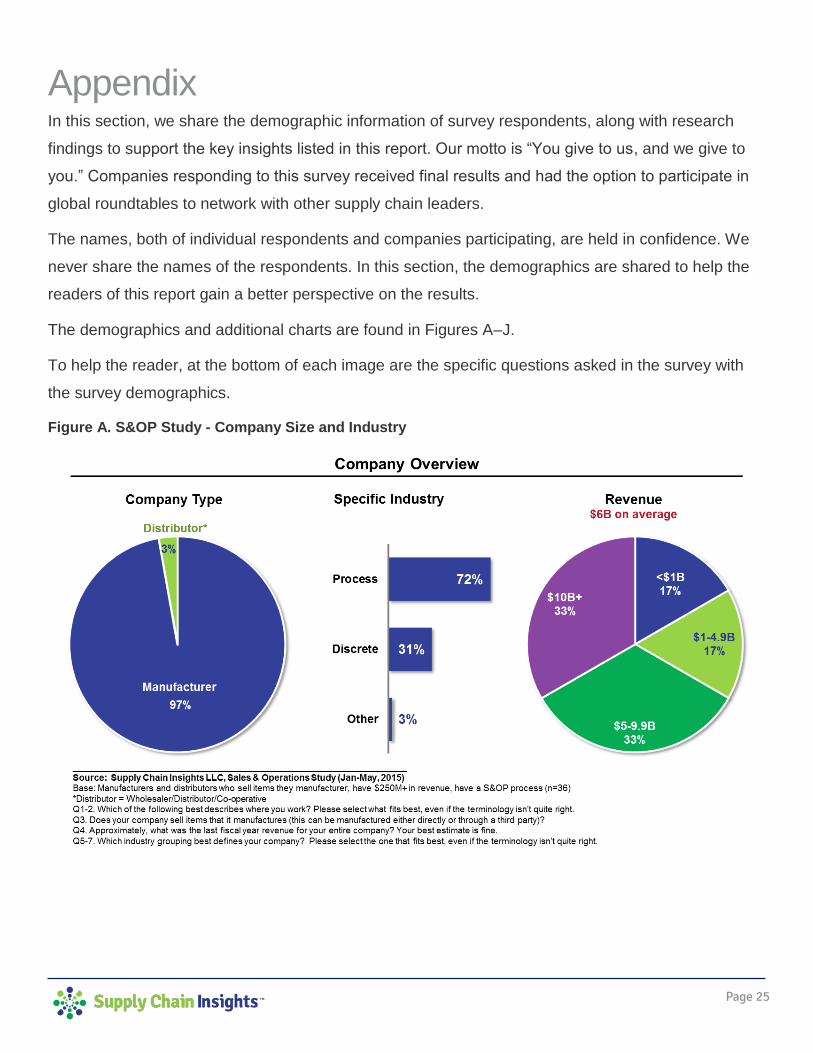
Appendix In this section, we share the demographic information of survey respondents, along with research
findings to support the key insights listed in this report. Our motto is “You give to us, and we give to
you.” Companies responding to this survey received final results and had the option to participate in
global roundtables to network with other supply chain leaders.
The names, both of individual respondents and companies participating, are held in confidence. We
never share the names of the respondents. In this section, the demographics are shared to help the
readers of this report gain a better perspective on the results.
The demographics and additional charts are found in Figures A–J.
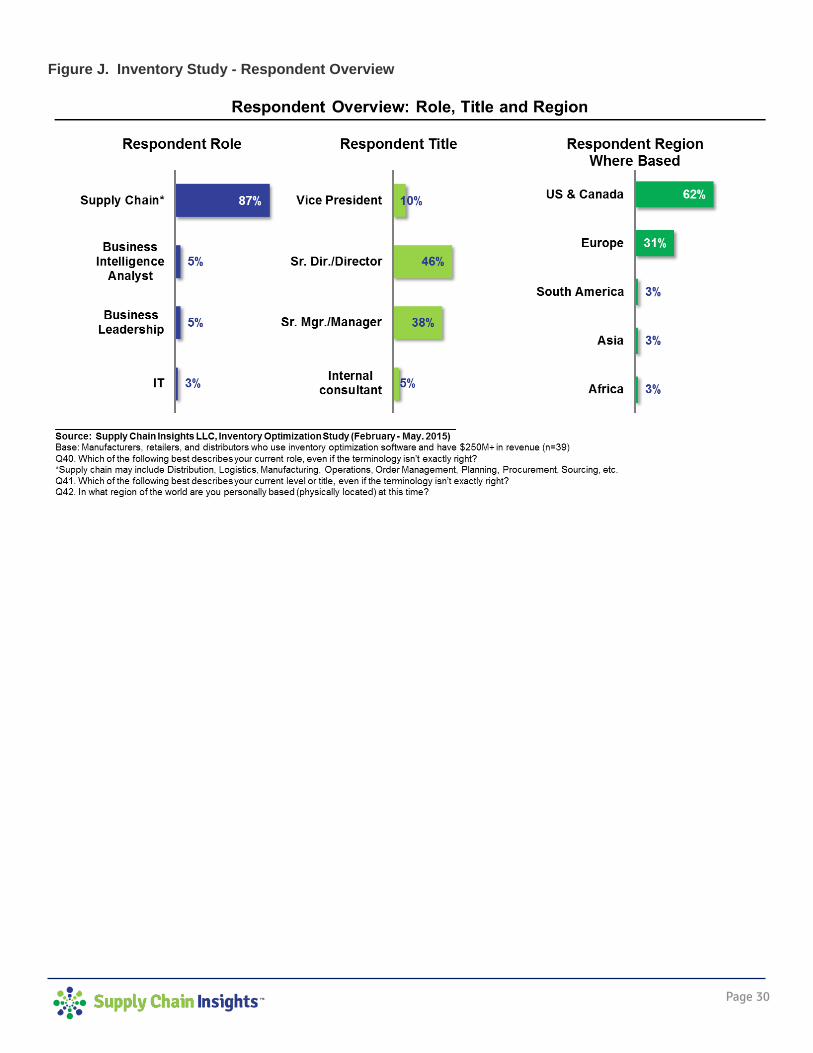
To help the reader, at the bottom of each image are the specific questions asked in the survey with
the survey demographics.
Figure A. S&OP Study - Company Size and Industry
Page 26
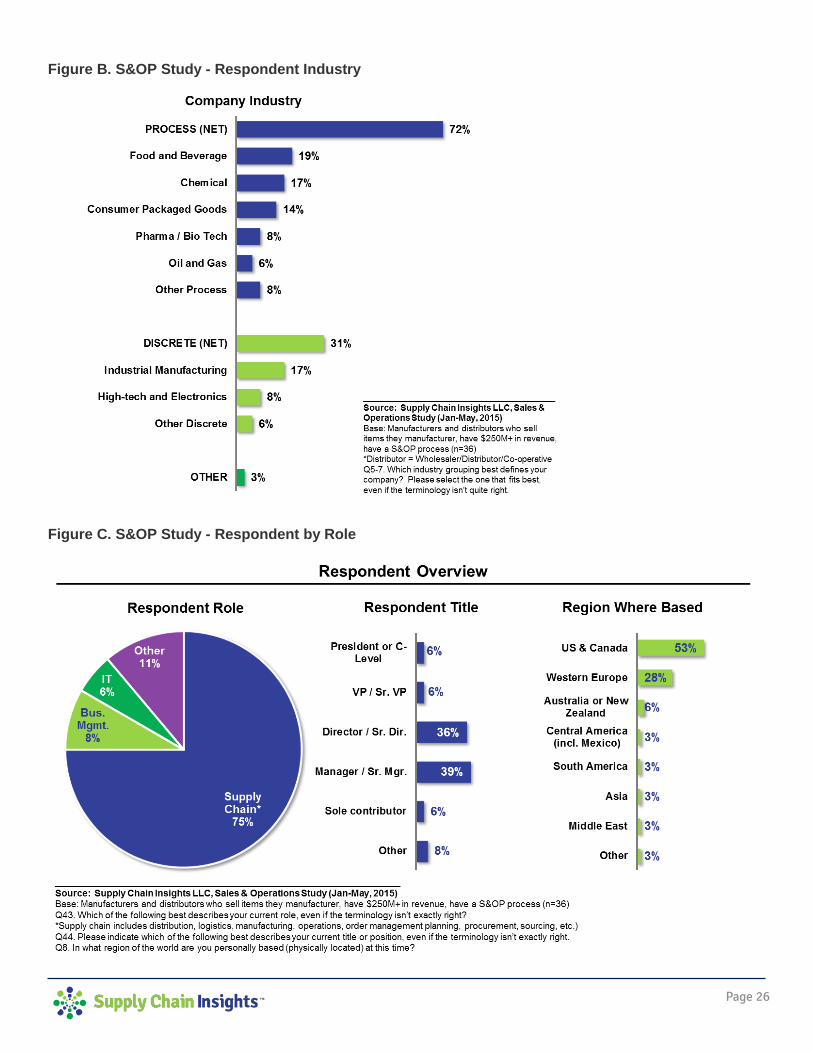
Figure B. S&OP Study - Respondent Industry
Figure C. S&OP Study - Respondent by Role
Page 27
Figure D. S&OP Study - Number of Processes
Figure E. S&OP Study - Self-Assessed S&OP Respondents on Effectiveness
Page 28
Figure F. S&OP Study - Technologies Used for S&OP
Figure G. Inventory Study - Study Overview
Page 29
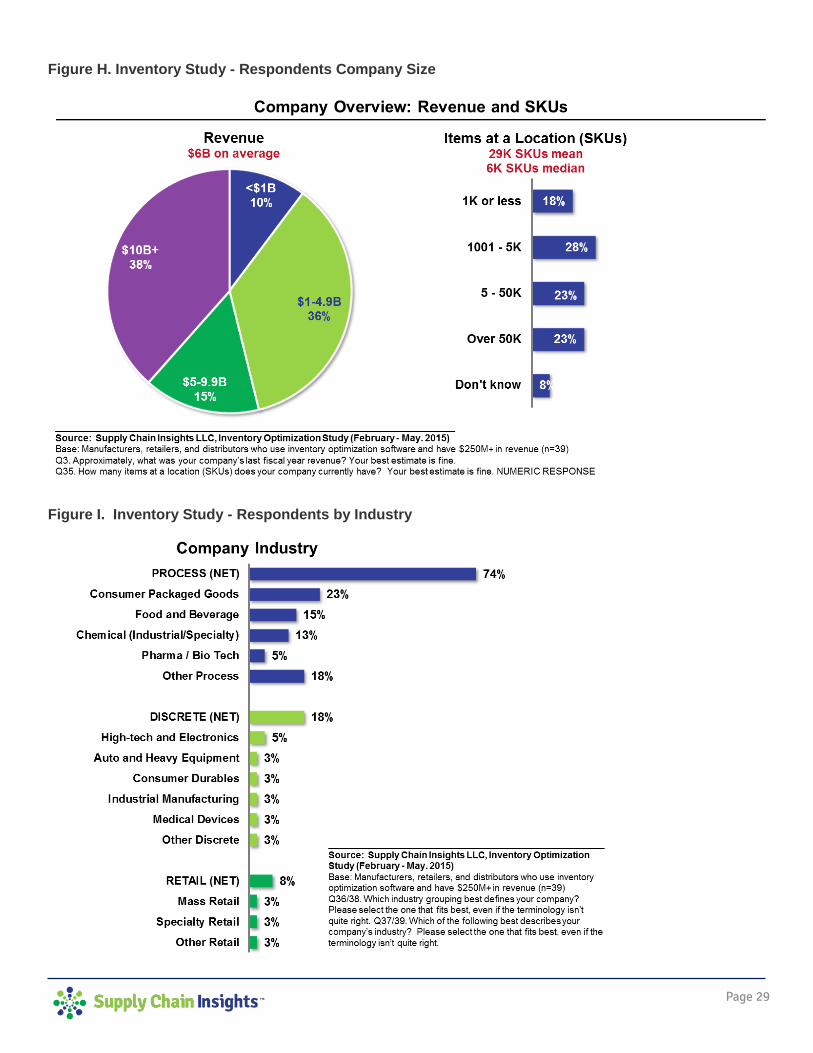
Figure H. Inventory Study - Respondents Company Size
Figure I. Inventory Study - Respondents by Industry
Page 30
Figure J. Inventory Study - Respondent Overview
Page 31
About Supply Chain Insights, LLC Founded in February, 2012 by Lora Cecere, Supply Chain Insights LLC is now in its fourth year of
writing research focused on delivering independent, actionable, and objective advice for supply
chain leaders. If you need to know which practices and technologies make the biggest difference to
corporate performance, turn to us. We are a company dedicated to this research. Our goal is to help
you understand supply chain trends, evolving technologies and which metrics matter.
About Lora Cecere Lora Cecere (twitter ID @lcecere) is the Founder of Supply Chain Insights LLC and
the author of popular enterprise software blog Supply Chain Shaman currently read
by 5,000 supply chain professionals. She also writes as a Linkedin Influencer and
is a a contributor for Forbes. She has written three books. The first book, Bricks
Matter, (co-authored with Charlie Chase) published in 2012. The second book,
Shaman’s Journal published in September 2014, and the third book, Supply Chain
Metrics That Matter, published in December 2014.
With over twelve years as a research analyst with AMR Research, Altimeter Group, and Gartner
Group and now as the Founder of Supply Chain Insights, Lora understands supply chain. She has
worked with over 600 companies on their supply chain strategy and speaks at over 50 conferences a
year on the evolution of supply chain processes and technologies. Her research is designed for the
early adopter seeking first mover advantage.