Embed Size (px)
Citation preview
Andrew Leon Palashewsky
Chartered Market Technician

The person who says it cannot be done
should not interrupt the person doing it.
Old Chinese Proverb
Today, we stand at an extraordinary time in financial markets. Electronic
round-the-clock trading has been a reality in many markets for at least
10 years. Technology, trading costs and the ability to perform complex
quantitative analysis have improved dramatically through this period.
Moreover, during this time, various Equity, Commodity and FX markets
have gone through a few cycles each.
This allows the study of present-day markets to encompass innovations
in technology, expansion of choices and a substantial range of market
conditions. Therefore, we can be more comprehensive than ever in our
search for workable strategies.
Introduction to Andrew Palashewsky, CMT and Partners
Primary Concepts of the Advance IQ Capital model
Primary Problems of the model
Phases of the Markets
Application of the Model
Risks
Testing of the Model
Purpose
Advantages
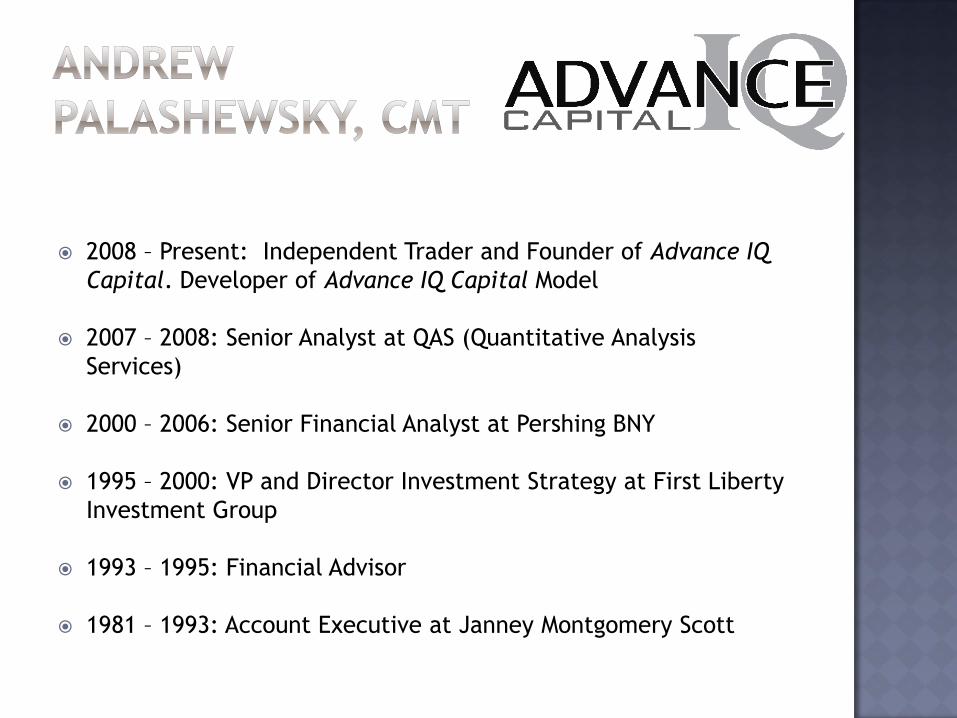
2008 – Present: Independent Trader and Founder of Advance IQ
Capital. Developer of Advance IQ Capital Model
2007 – 2008: Senior Analyst at QAS (Quantitative Analysis
Services)
2000 – 2006: Senior Financial Analyst at Pershing BNY
1995 – 2000: VP and Director Investment Strategy at First Liberty
Investment Group
1993 – 1995: Financial Advisor
1981 – 1993: Account Executive at Janney Montgomery Scott
Andrew Palashewsky, CMT began building algorithmic
models in 2011 to quantify an investment philosophy honed
over decades as an investment professional and analyst to
emulate a multi-year period of extraordinary trading
productivity.
Beginning in 2010, electronic trading, 24-hr markets and
catalytic events from different time zones highlighted the
need for a logarithmic strategy to synthesize and objectify
the prior discretionary approach.
The Advance IQ Capital Model is the summation of this
work, using proprietary price momentum measurements
that expand and contract based on market conditions.
Excessive leverage is the long-term enemy of performance.
If price direction is understood, sizable returns can be
captured without much leverage.
If not, amplifying small returns with high leverage can
backfire spectacularly.
Low leverage maintains integrity of capital.
Low leverage means that much more capital can
effectively be deployed without disrupting markets.

Model envisions using 1 to 3x leverage on commodity
futures.
Currency contracts are less volatile, so leverage of up to
5x can be used while maintaining risk profile.
ETFs can be margined 2x or left unleveraged.
Huge macro theme bets may be very profitable if the PM is
correct in his predictions.
Many PMs who got one major theme right have had trouble
with subsequent major theme victories.
Solution
The Model adapts to changing conditions.
Model typically produces 15 changes in direction each year.
There is less room for entrenched ego to hamper results.
Selected investment instruments are selected for their
tendency to trend well and make broad swings in price.
Solution
Commodity futures contracts, FX and related ETFs are
prime instruments.
Broad market ETFs and Futures are poor choices because
they aggregate sector rotation and, thus, tend to exhibit
choppier price movements.
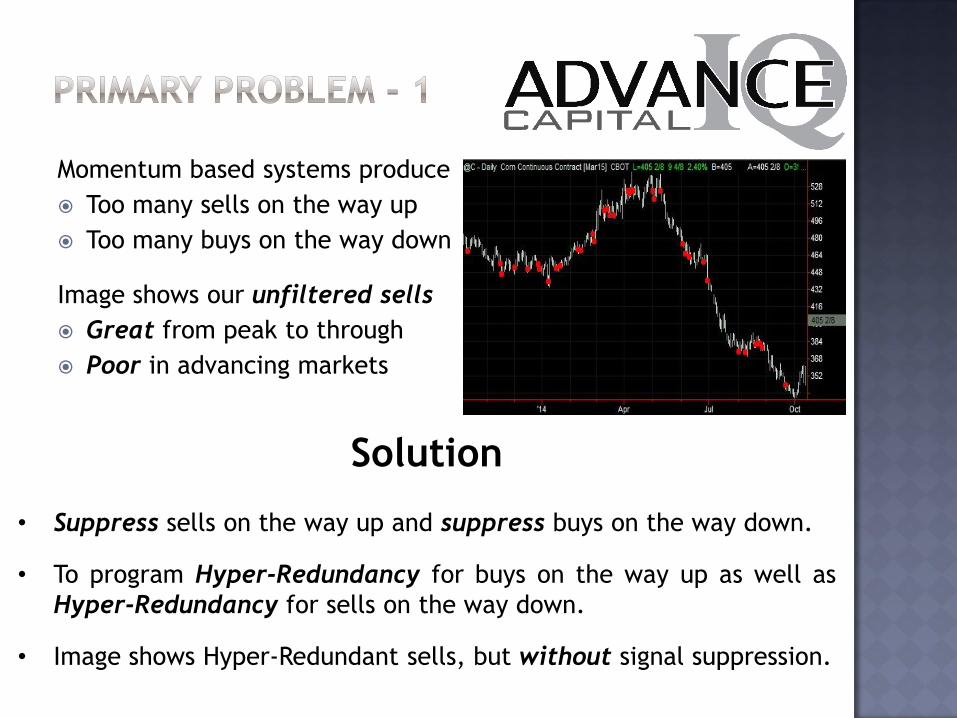
Momentum based systems produce
Too many sells on the way up
Too many buys on the way down
Image shows our unfiltered sells
Great from peak to through
Poor in advancing markets
Solution
• Suppress sells on the way up and suppress buys on the way down.
• To program Hyper-Redundancy for buys on the way up as well as
Hyper-Redundancy for sells on the way down.
• Image shows Hyper-Redundant sells, but without signal suppression.
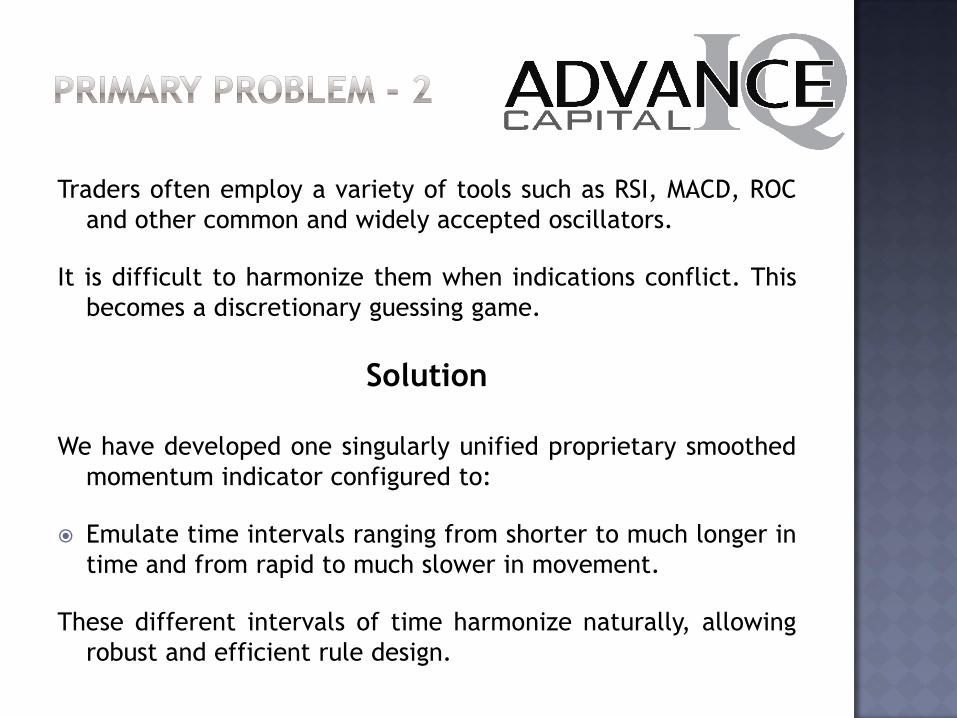
Traders often employ a variety of tools such as RSI, MACD, ROC
and other common and widely accepted oscillators.
It is difficult to harmonize them when indications conflict. This
becomes a discretionary guessing game.
Solution
We have developed one singularly unified proprietary smoothed
momentum indicator configured to:
Emulate time intervals ranging from shorter to much longer in
time and from rapid to much slower in movement.
These different intervals of time harmonize naturally, allowing
robust and efficient rule design.
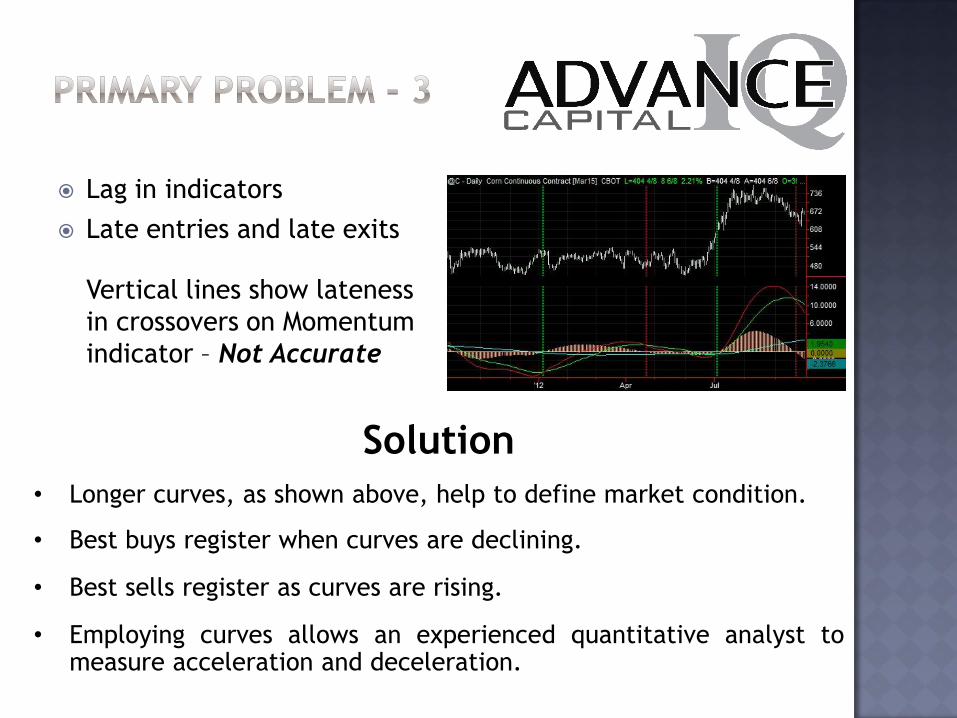
Lag in indicators
Late entries and late exits
Vertical lines show lateness
in crossovers on Momentum
indicator – Not Accurate
Solution
• Longer curves, as shown above, help to define market condition.
• Best buys register when curves are declining.
• Best sells register as curves are rising.
• Employing curves allows an experienced quantitative analyst to measure acceleration and deceleration.
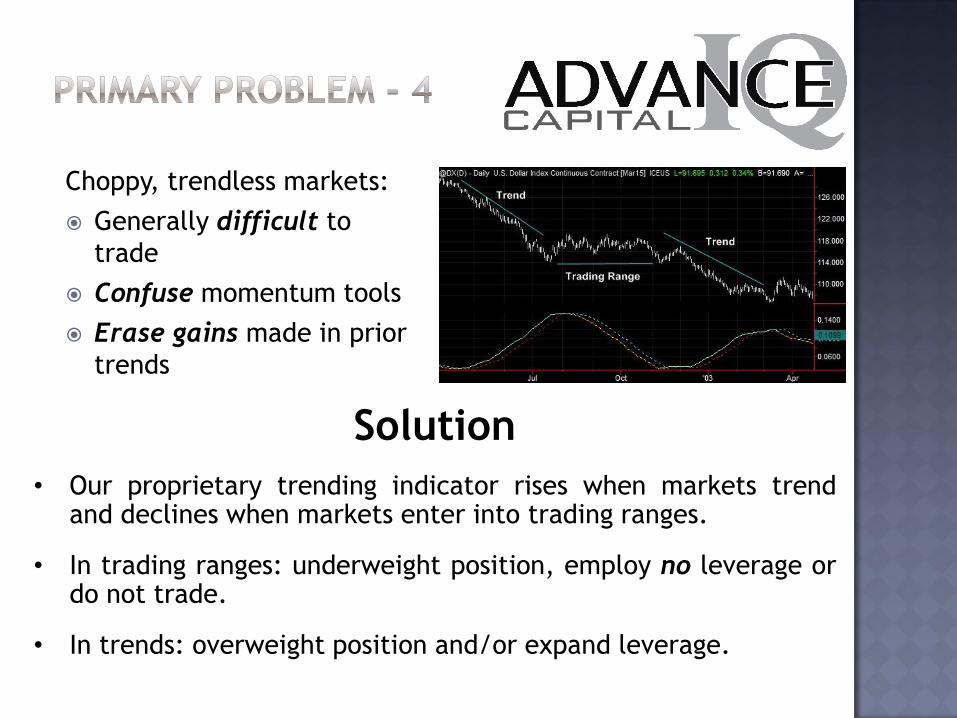
Choppy, trendless markets:
Generally difficult to
trade
Confuse momentum tools
Erase gains made in prior
trends
Solution
• Our proprietary trending indicator rises when markets trend and declines when markets enter into trading ranges.
• In trading ranges: underweight position, employ no leverage or do not trade.
• In trends: overweight position and/or expand leverage.
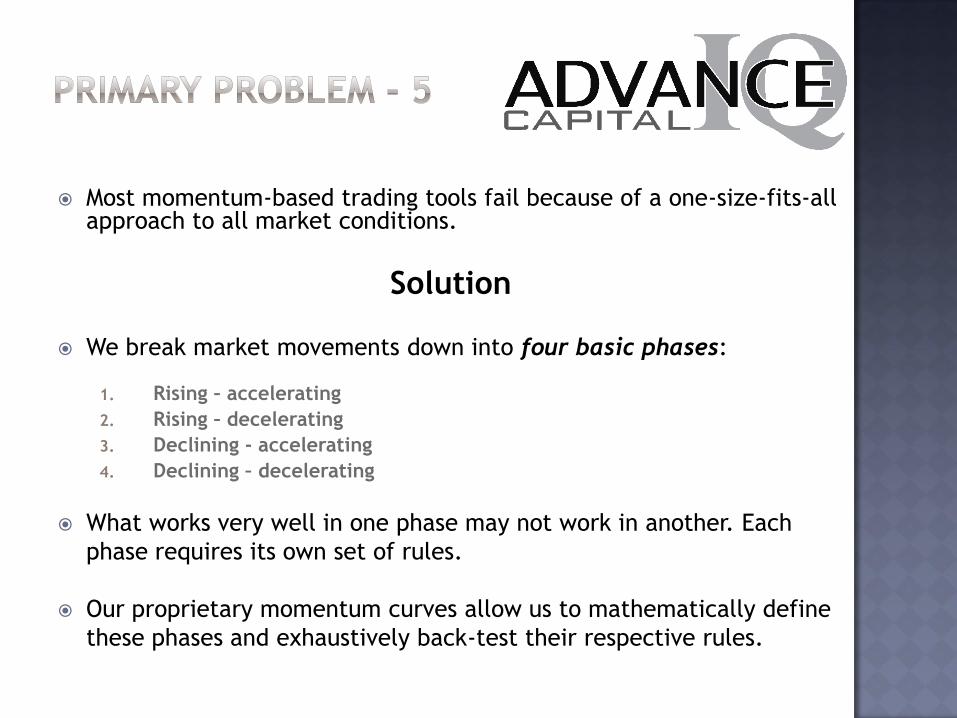
Most momentum-based trading tools fail because of a one-size-fits-all approach to all market conditions.
Solution
We break market movements down into four basic phases:
1. Rising – accelerating
2. Rising – decelerating
3. Declining - accelerating
4. Declining – decelerating
What works very well in one phase may not work in another. Each
phase requires its own set of rules.
Our proprietary momentum curves allow us to mathematically define
these phases and exhaustively back-test their respective rules.
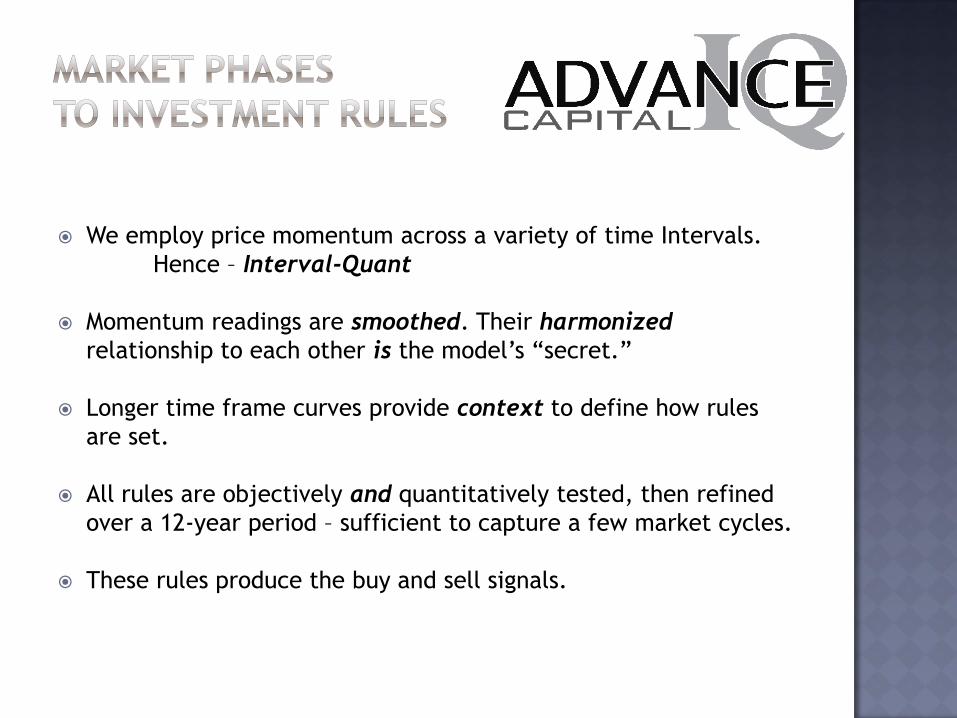
We employ price momentum across a variety of time Intervals.
Hence – Interval-Quant
Momentum readings are smoothed. Their harmonized
relationship to each other is the model’s “secret.”
Longer time frame curves provide context to define how rules
are set.
All rules are objectively and quantitatively tested, then refined
over a 12-year period – sufficient to capture a few market cycles.
These rules produce the buy and sell signals.
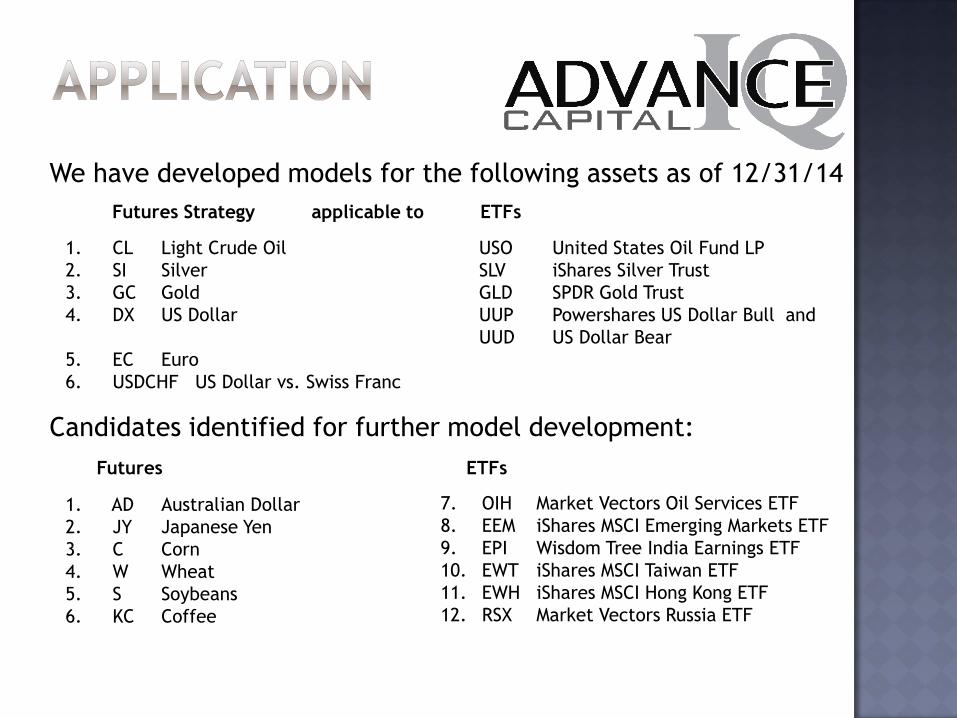
We have developed models for the following assets as of 12/31/14
Futures Strategy applicable to ETFs
1. AD Australian Dollar
2. JY Japanese Yen
3. C Corn
4. W Wheat
5. S Soybeans
6. KC Coffee
7. OIH Market Vectors Oil Services ETF
8. EEM iShares MSCI Emerging Markets ETF
9. EPI Wisdom Tree India Earnings ETF
10. EWT iShares MSCI Taiwan ETF
11. EWH iShares MSCI Hong Kong ETF
12. RSX Market Vectors Russia ETF
1. CL Light Crude Oil
2. SI Silver
3. GC Gold
4. DX US Dollar
5. EC Euro
6. USDCHF US Dollar vs. Swiss Franc
USO United States Oil Fund LP
SLV iShares Silver Trust
GLD SPDR Gold Trust
UUP Powershares US Dollar Bull and
UUD US Dollar Bear
Candidates identified for further model development:
Futures ETFs
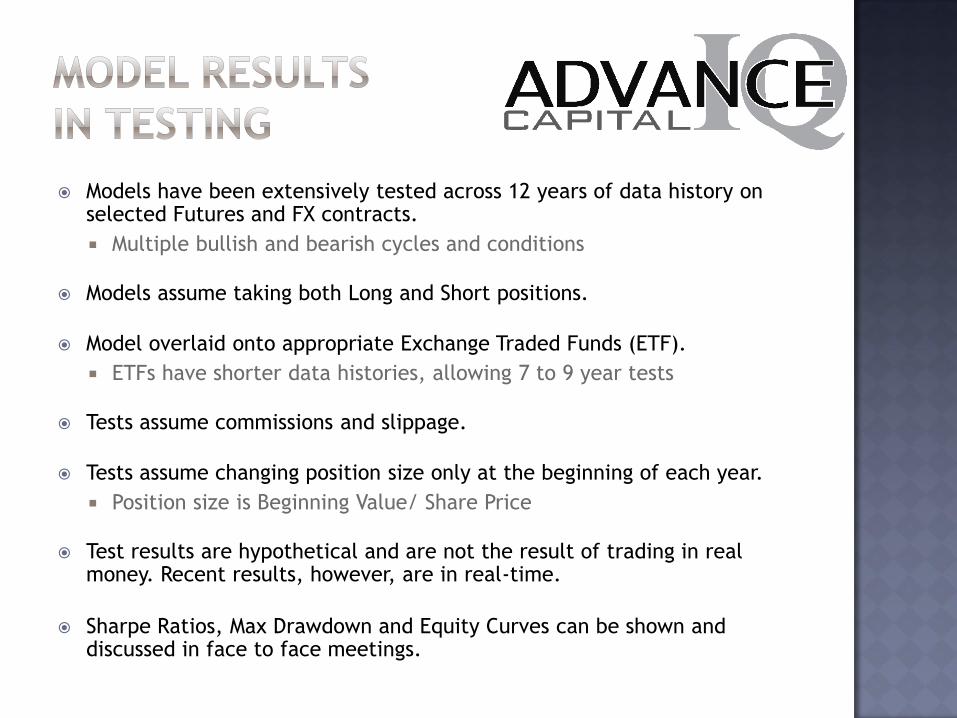
Models have been extensively tested across 12 years of data history on selected Futures and FX contracts.
Multiple bullish and bearish cycles and conditions
Models assume taking both Long and Short positions.
Model overlaid onto appropriate Exchange Traded Funds (ETF).
ETFs have shorter data histories, allowing 7 to 9 year tests
Tests assume commissions and slippage.
Tests assume changing position size only at the beginning of each year.
Position size is Beginning Value/ Share Price
Test results are hypothetical and are not the result of trading in real money. Recent results, however, are in real-time.
Sharpe Ratios, Max Drawdown and Equity Curves can be shown and discussed in face to face meetings.
Primary risk is that a major move can unfold without being preceded by an appropriate signal.
mitigated by stop loss techniques
Market volatility can change in a way that is outside the “harmonic resonance” of the model.
Trading ranges are volatile and open to interpretation, often producing a series of losses.
possibly mitigated by trending indicator
Major unexpected events such as a terrorist attack or Tsunami could close the markets for a time – after which, re-opening dislocations across markets would be anyone’s guess.
mitigated by low to non-existent leverage.

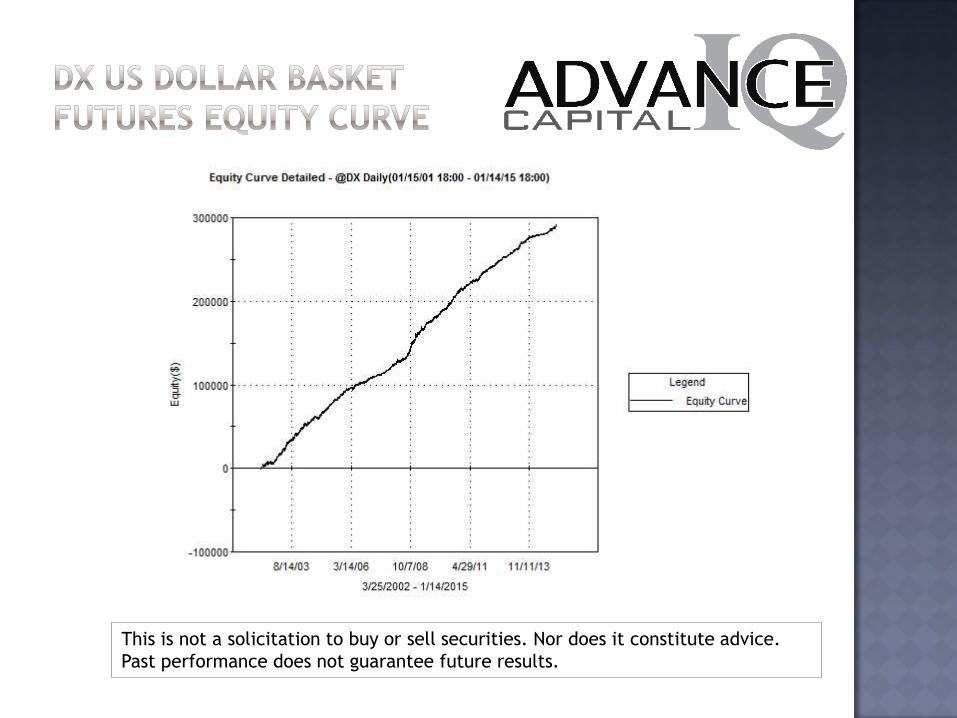
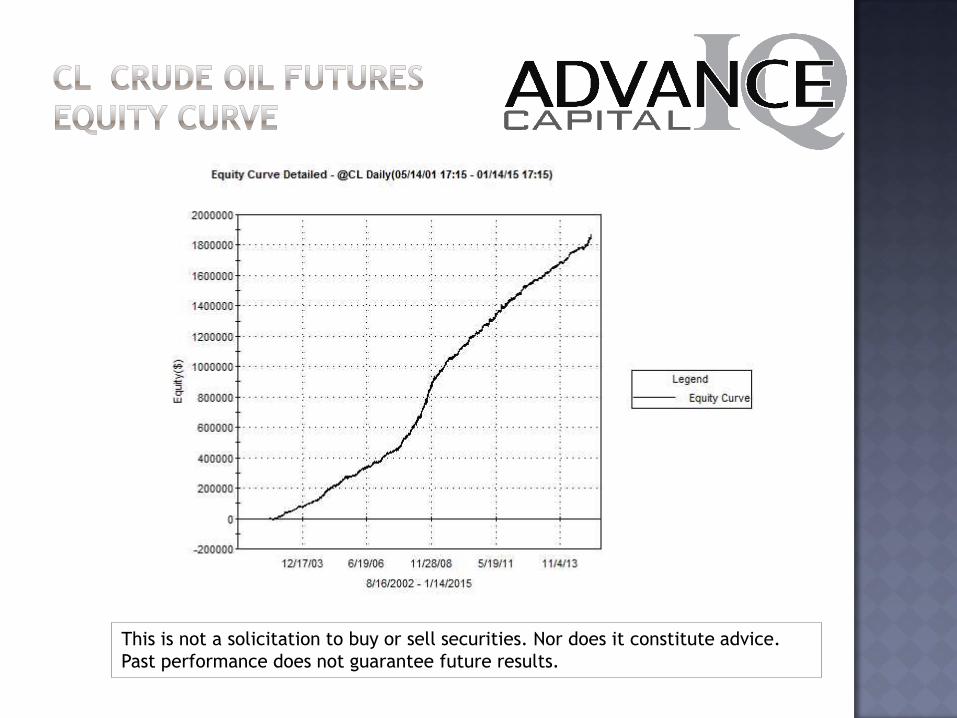
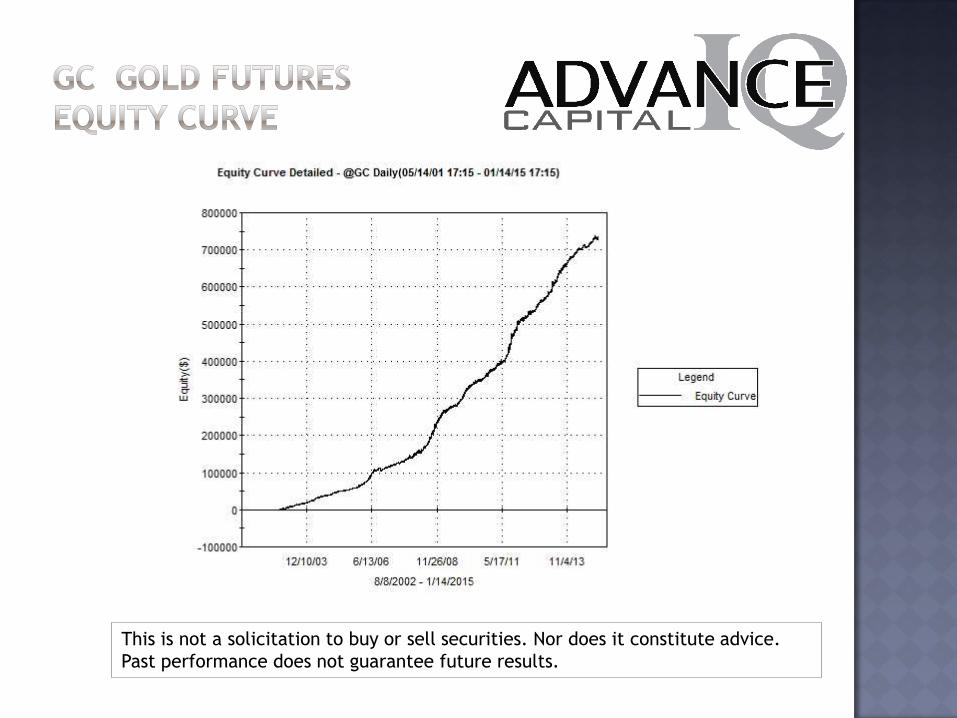
Crude oil has moved from $60 per barrel to $150, back to $35, then to $110, now to $47 per barrel.
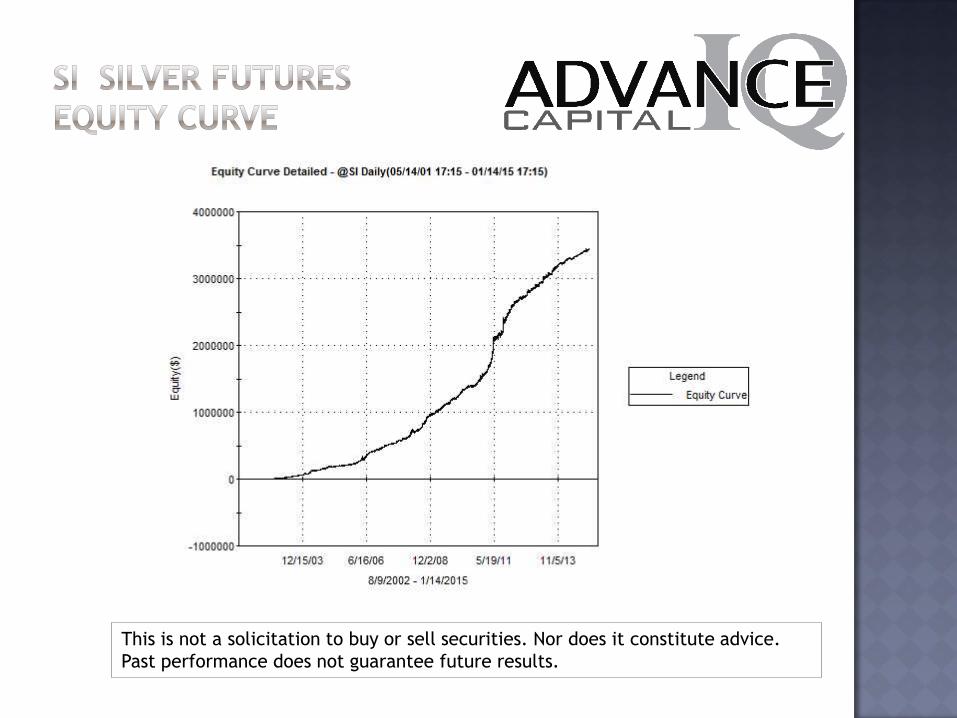
Silver has moved from $16 per ounce to $50 and is now back to $16 per ounce.
Gold has been less volatile than silver, but equally dramatic.
The last eight years, the period covered by the following tests, have
seen swings that are historically extraordinary.
These wide swings amplify the exceptional results in testing in these
three commodities.
However, such vast swings may not be repeated in the coming eight
years. Fortunately, the model appears to work very well with smaller
amplitude swings. The US Dollar model reflects the strategy’s potential
within a lower volatility environment.
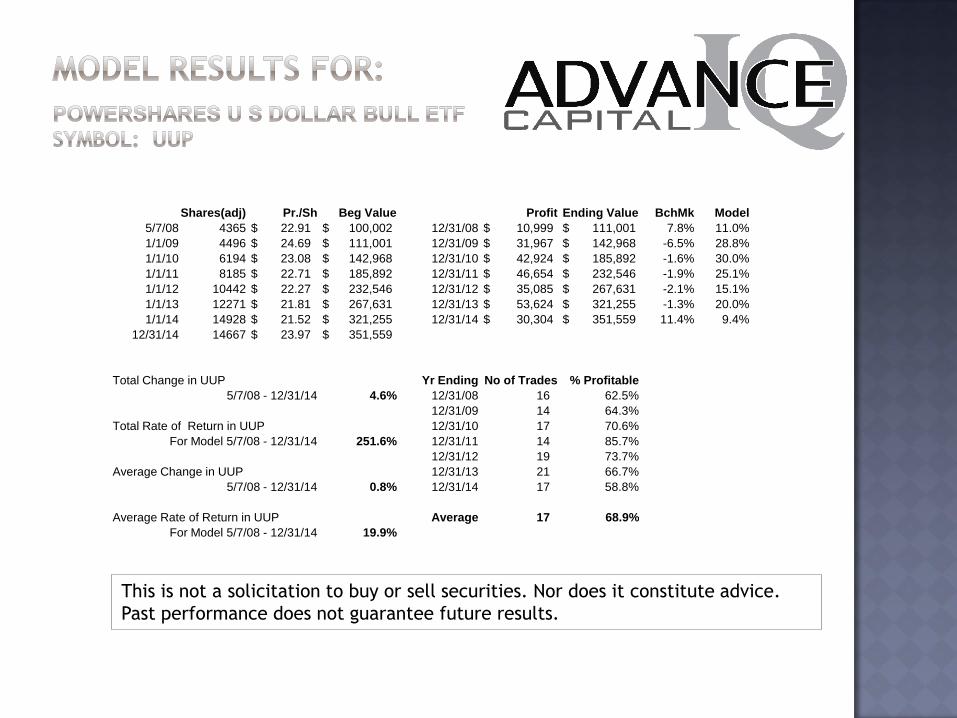
Shares(adj) Pr./Sh Beg Value Profit Ending Value BchMk Model
5/7/08 4365 $ 22.91 $ 100,002 12/31/08 $ 10,999 $ 111,001 7.8% 11.0%
1/1/09 4496 $ 24.69 $ 111,001 12/31/09 $ 31,967 $ 142,968 -6.5% 28.8%
1/1/10 6194 $ 23.08 $ 142,968 12/31/10 $ 42,924 $ 185,892 -1.6% 30.0%
1/1/11 8185 $ 22.71 $ 185,892 12/31/11 $ 46,654 $ 232,546 -1.9% 25.1%
1/1/12 10442 $ 22.27 $ 232,546 12/31/12 $ 35,085 $ 267,631 -2.1% 15.1%
1/1/13 12271 $ 21.81 $ 267,631 12/31/13 $ 53,624 $ 321,255 -1.3% 20.0%
1/1/14 14928 $ 21.52 $ 321,255 12/31/14 $ 30,304 $ 351,559 11.4% 9.4%
12/31/14 14667 $ 23.97 $ 351,559
Total Change in UUP Yr Ending No of Trades % Profitable
5/7/08 - 12/31/14 4.6% 12/31/08 16 62.5%
12/31/09 14 64.3%
Total Rate of Return in UUP 12/31/10 17 70.6%
For Model 5/7/08 - 12/31/14 251.6% 12/31/11 14 85.7%
12/31/12 19 73.7%
Average Change in UUP 12/31/13 21 66.7%
5/7/08 - 12/31/14 0.8% 12/31/14 17 58.8%
Average Rate of Return in UUP Average 17 68.9%
For Model 5/7/08 - 12/31/14 19.9%
This is not a solicitation to buy or sell securities. Nor does it constitute advice.
Past performance does not guarantee future results.
This is not a solicitation to buy or sell securities. Nor does it constitute advice.
Past performance does not guarantee future results.
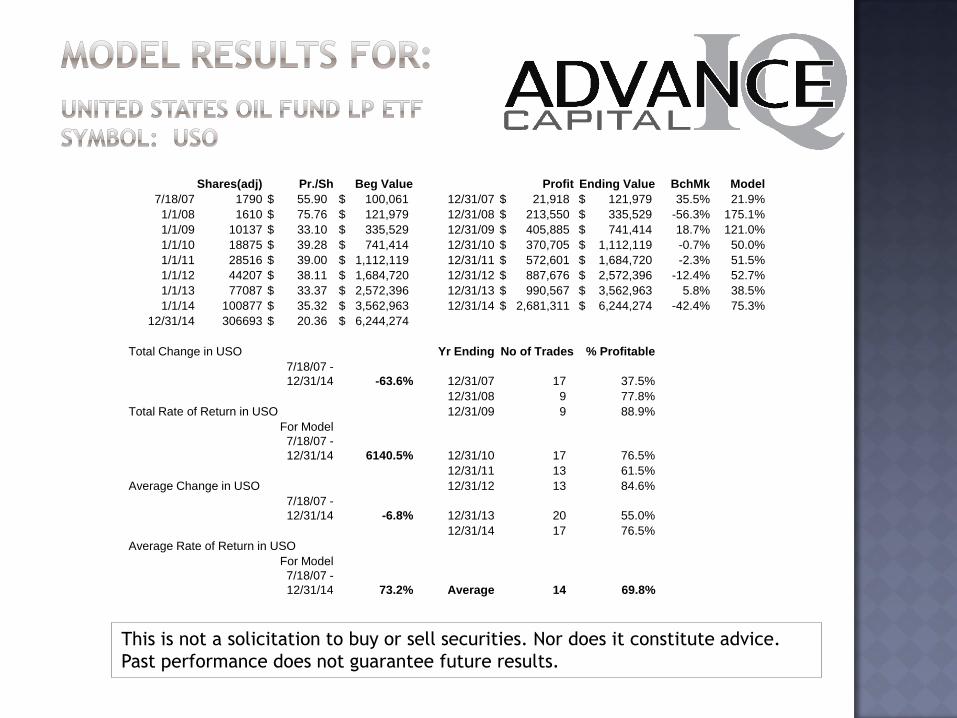
Shares(adj) Pr./Sh Beg Value Profit Ending Value BchMk Model
7/18/07 1790 $ 55.90 $ 100,061 12/31/07 $ 21,918 $ 121,979 35.5% 21.9%
1/1/08 1610 $ 75.76 $ 121,979 12/31/08 $ 213,550 $ 335,529 -56.3% 175.1%
1/1/09 10137 $ 33.10 $ 335,529 12/31/09 $ 405,885 $ 741,414 18.7% 121.0%
1/1/10 18875 $ 39.28 $ 741,414 12/31/10 $ 370,705 $ 1,112,119 -0.7% 50.0%
1/1/11 28516 $ 39.00 $ 1,112,119 12/31/11 $ 572,601 $ 1,684,720 -2.3% 51.5%
1/1/12 44207 $ 38.11 $ 1,684,720 12/31/12 $ 887,676 $ 2,572,396 -12.4% 52.7%
1/1/13 77087 $ 33.37 $ 2,572,396 12/31/13 $ 990,567 $ 3,562,963 5.8% 38.5%
1/1/14 100877 $ 35.32 $ 3,562,963 12/31/14 $ 2,681,311 $ 6,244,274 -42.4% 75.3%
12/31/14 306693 $ 20.36 $ 6,244,274
Total Change in USO Yr Ending No of Trades % Profitable
7/18/07 -
12/31/14 -63.6% 12/31/07 17 37.5%
12/31/08 9 77.8%
Total Rate of Return in USO 12/31/09 9 88.9%
For Model
7/18/07 -
12/31/14 6140.5% 12/31/10 17 76.5%
12/31/11 13 61.5%
Average Change in USO 12/31/12 13 84.6%
7/18/07 -
12/31/14 -6.8% 12/31/13 20 55.0%
12/31/14 17 76.5%
Average Rate of Return in USO
For Model
7/18/07 -
12/31/14 73.2% Average 14 69.8%
This is not a solicitation to buy or sell securities. Nor does it constitute advice.
Past performance does not guarantee future results.
This is not a solicitation to buy or sell securities. Nor does it constitute advice.
Past performance does not guarantee future results.
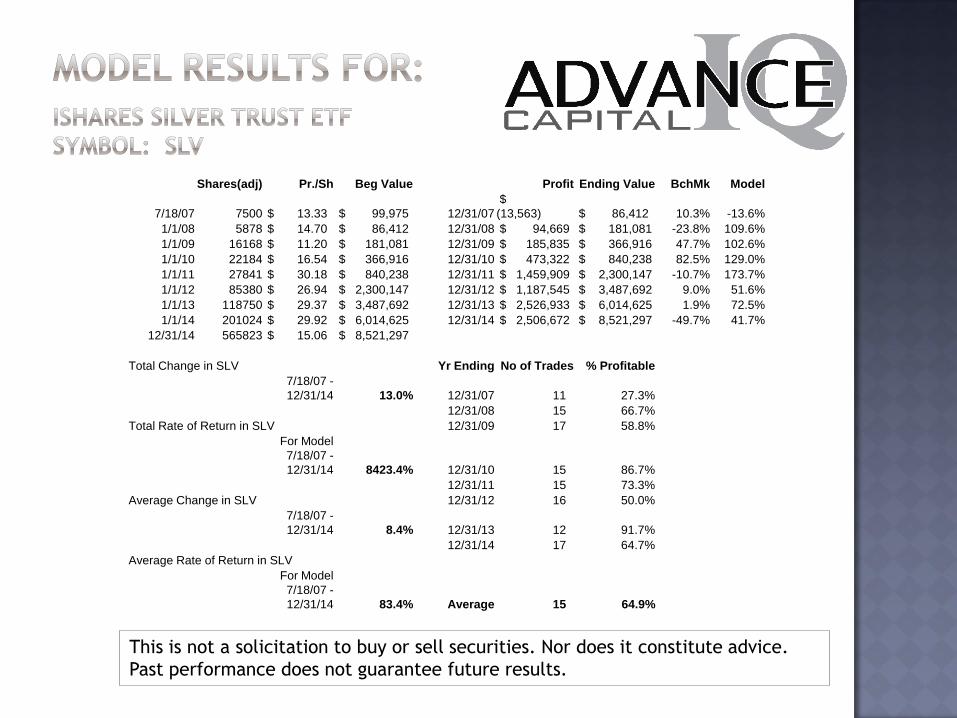
Shares(adj) Pr./Sh Beg Value Profit Ending Value BchMk Model
7/18/07 7500 $ 13.33 $ 99,975 12/31/07
$
(13,563) $ 86,412 10.3% -13.6%
1/1/08 5878 $ 14.70 $ 86,412 12/31/08 $ 94,669 $ 181,081 -23.8% 109.6%
1/1/09 16168 $ 11.20 $ 181,081 12/31/09 $ 185,835 $ 366,916 47.7% 102.6%
1/1/10 22184 $ 16.54 $ 366,916 12/31/10 $ 473,322 $ 840,238 82.5% 129.0%
1/1/11 27841 $ 30.18 $ 840,238 12/31/11 $ 1,459,909 $ 2,300,147 -10.7% 173.7%
1/1/12 85380 $ 26.94 $ 2,300,147 12/31/12 $ 1,187,545 $ 3,487,692 9.0% 51.6%
1/1/13 118750 $ 29.37 $ 3,487,692 12/31/13 $ 2,526,933 $ 6,014,625 1.9% 72.5%
1/1/14 201024 $ 29.92 $ 6,014,625 12/31/14 $ 2,506,672 $ 8,521,297 -49.7% 41.7%
12/31/14 565823 $ 15.06 $ 8,521,297
Total Change in SLV Yr Ending No of Trades % Profitable
7/18/07 -
12/31/14 13.0% 12/31/07 11 27.3%
12/31/08 15 66.7%
Total Rate of Return in SLV 12/31/09 17 58.8%
For Model
7/18/07 -
12/31/14 8423.4% 12/31/10 15 86.7%
12/31/11 15 73.3%
Average Change in SLV 12/31/12 16 50.0%
7/18/07 -
12/31/14 8.4% 12/31/13 12 91.7%
12/31/14 17 64.7%
Average Rate of Return in SLV
For Model
7/18/07 -
12/31/14 83.4% Average 15 64.9%
This is not a solicitation to buy or sell securities. Nor does it constitute advice.
Past performance does not guarantee future results.
This is not a solicitation to buy or sell securities. Nor does it constitute advice.
Past performance does not guarantee future results.
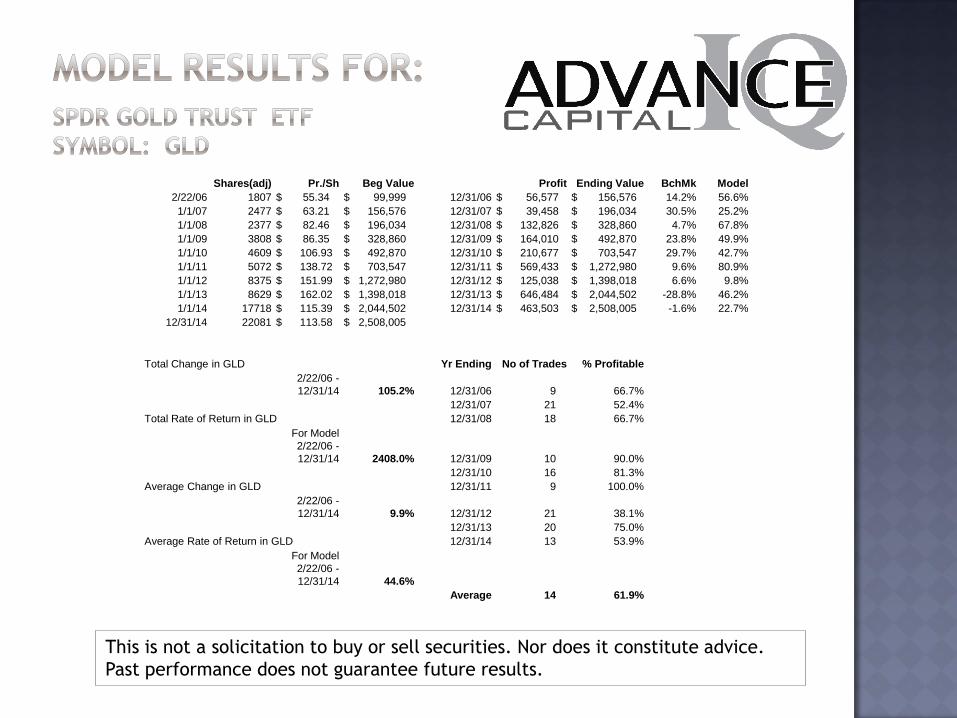
Shares(adj) Pr./Sh Beg Value Profit Ending Value BchMk Model
2/22/06 1807 $ 55.34 $ 99,999 12/31/06 $ 56,577 $ 156,576 14.2% 56.6%
1/1/07 2477 $ 63.21 $ 156,576 12/31/07 $ 39,458 $ 196,034 30.5% 25.2%
1/1/08 2377 $ 82.46 $ 196,034 12/31/08 $ 132,826 $ 328,860 4.7% 67.8%
1/1/09 3808 $ 86.35 $ 328,860 12/31/09 $ 164,010 $ 492,870 23.8% 49.9%
1/1/10 4609 $ 106.93 $ 492,870 12/31/10 $ 210,677 $ 703,547 29.7% 42.7%
1/1/11 5072 $ 138.72 $ 703,547 12/31/11 $ 569,433 $ 1,272,980 9.6% 80.9%
1/1/12 8375 $ 151.99 $ 1,272,980 12/31/12 $ 125,038 $ 1,398,018 6.6% 9.8%
1/1/13 8629 $ 162.02 $ 1,398,018 12/31/13 $ 646,484 $ 2,044,502 -28.8% 46.2%
1/1/14 17718 $ 115.39 $ 2,044,502 12/31/14 $ 463,503 $ 2,508,005 -1.6% 22.7%
12/31/14 22081 $ 113.58 $ 2,508,005
Total Change in GLD Yr Ending No of Trades % Profitable
2/22/06 -
12/31/14 105.2% 12/31/06 9 66.7%
12/31/07 21 52.4%
Total Rate of Return in GLD 12/31/08 18 66.7%
For Model
2/22/06 -
12/31/14 2408.0% 12/31/09 10 90.0%
12/31/10 16 81.3%
Average Change in GLD 12/31/11 9 100.0%
2/22/06 -
12/31/14 9.9% 12/31/12 21 38.1%
12/31/13 20 75.0%
Average Rate of Return in GLD 12/31/14 13 53.9%
For Model
2/22/06 -
12/31/14 44.6%
Average 14 61.9%
This is not a solicitation to buy or sell securities. Nor does it constitute advice.
Past performance does not guarantee future results.
This is not a solicitation to buy or sell securities. Nor does it constitute advice.
Past performance does not guarantee future results.
Signals register at end of the daily session and holding periods range from days to months, giving us ample time to:
Analyze each signal against prior successful signals of its type to check for anomalies before making a transaction; and
Enter into and exit positions gradually – allowing for larger position sizes.
Model exhibits strong consistency across a range of selected asset classes and market cycles.
Low leverage allows for larger position sizing than would otherwise be possible. As presently envisioned, given the variety of Futures markets and ETFs, liquidity is sufficient to accommodate eventual capacity of between $500 MM to $1B in net capital without unduly disturbing the market.
Model has been developed for a primary partnership with a select
Long/Short, Macro or Multi-Strategy Hedge Fund.
Its primary purpose is capital management – not subscriptions or
advise columns.
Advance IQ Capital is actively searching for the right relationship
partner.
Such a partner would prefer to establish an equity position in an
already developed model rather than invest millions of dollars and
years in time to reverse engineer or to develop something similar.

Andrew Leon Palashewsky, CMT
856-266-1590
Cherry Hill, NJ
USA