Embed Size (px)
Citation preview
5 – 1Copyright © 2010 Pearson Education, Inc. Publishing as Prentice Hall.
Quality And PerformanceQuality And Performance5
5 – 2
Meaning of Quality
A term used by customers to describe A term used by customers to describe their general satisfaction with a their general satisfaction with a service or product.service or product.
Webster’s Dictionary degree of excellence of a thing
American Society for Quality totality of features and characteristics that
satisfy needs
Consumer’s and producer’s perspective
5 – 3
Meaning of Quality: Consumer’s Perspective
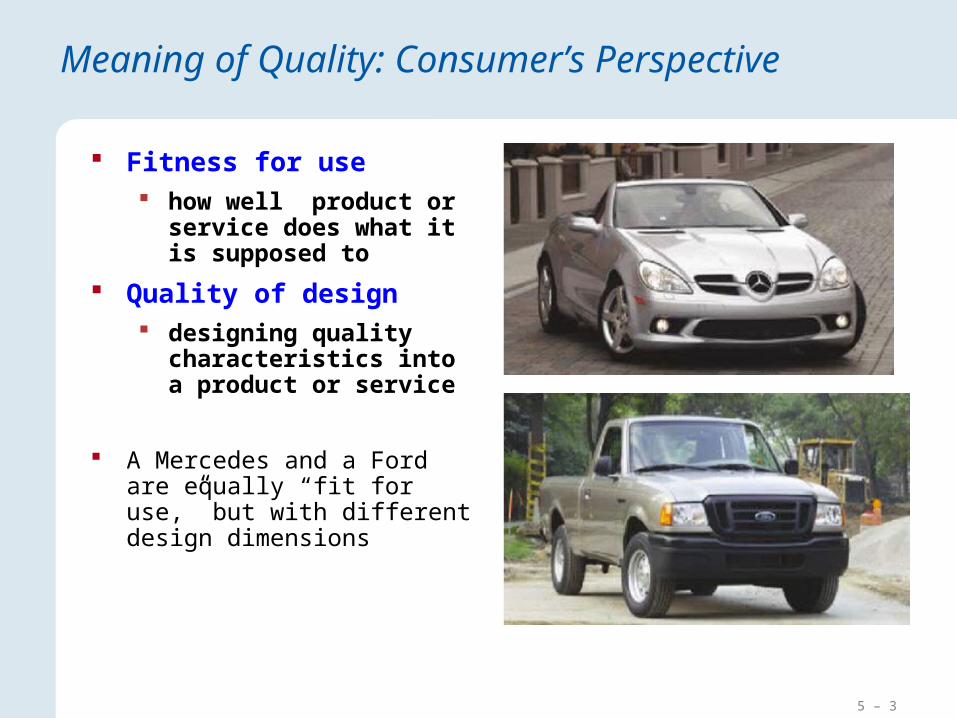
Fitness for use how well product or
service does what it is supposed to
Quality of design designing quality
characteristics into a product or service
A Mercedes and a Ford are equally “fit for use,” but with different design dimensions
5 – 4
Dimensions of Quality: Manufactured Products
Performance basic operating characteristics of a product; how
well a car is handled or its gas mileage.
Features “extra” items added to basic features, such as a
stereo CD or a leather interior in a car.
Reliability probability that a product will operate properly
within an expected time frame; that is, a TV will work without repair for about seven years.
Conformance degree to which a product meets pre–established
standards
5 – 5
Dimensions of Quality: Manufactured Products
• Durability– how long product lasts before replacement?
• Serviceability– ease of getting repairs, speed of repairs, courtesy
and competence of repair person• Aesthetics
– how a product looks, feels, sounds, smells, or tastes?• Safety
– assurance that customer will not suffer injury or harm from a product; an especially important consideration for automobiles
• Perceptions– subjective perceptions based on brand name,
advertising, and like
5 – 6
Dimensions of Quality: Service
Time and timeliness how long must a customer wait for service, and is
it completed on time? is an overnight package delivered overnight?
Completeness: is everything customer asked for provided? is a mail order from a catalogue company
complete when delivered? Courtesy:
how are customers treated by employees? are catalogue phone operators nice and are their
voices pleasant? Consistency
is same level of service provided to each customer each time?
is your newspaper delivered on time every morning?
5 – 7
Dimensions of Quality: Service
• Accessibility and convenience– how easy is it to obtain service?– does service representative answer you calls
quickly?
• Accuracy– is service performed right every time?– is your bank or credit card statement correct
every month?
• Responsiveness– how well does company react to unusual
situations?– how well is a telephone operator at able to
respond to a customer’s questions?
5 – 8
Meaning of Quality: Producer’s Perspective
Quality of conformance Making sure product or service is produced
according to design if new tires do not conform to specifications, y
wobble if a hotel room is not clean when a guest checks
in, hotel is not functioning according to specifications of its design
5 – 9
Meaning of Quality: A Final Perspective
Consumer’s and producer’s perspectives depend on each other
Consumer’s perspective: PRICE Producer’s perspective: COST Consumer’s view must dominate
5 – 10
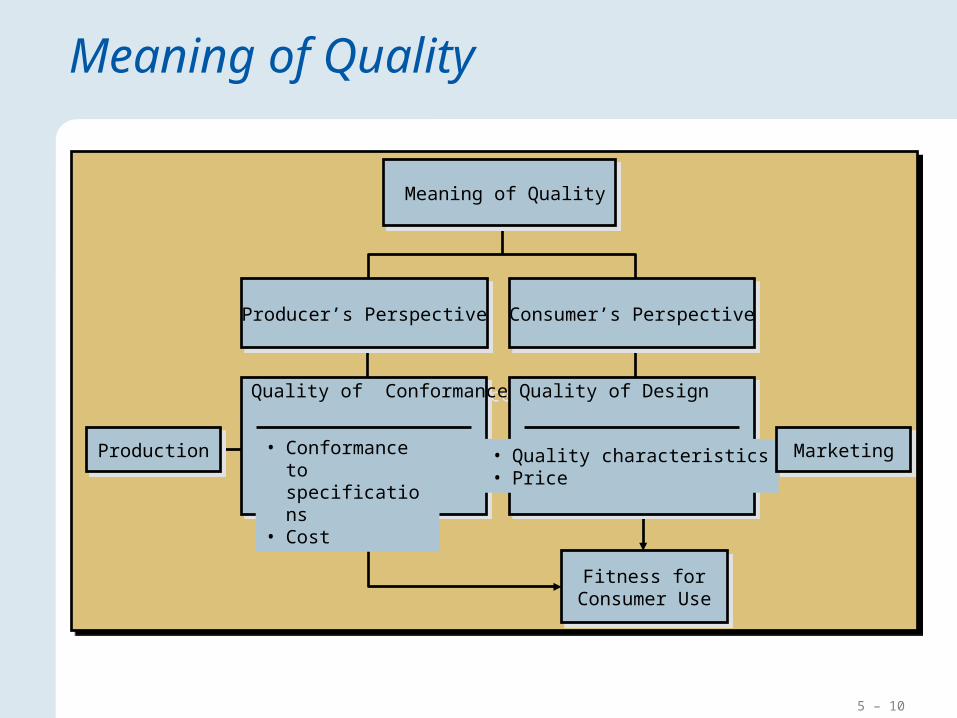
Fitness forConsumer Use
Fitness forConsumer Use
Producer’s PerspectiveProducer’s Perspective Consumer’s PerspectiveConsumer’s Perspective
Quality of ConformanceQuality of Conformance
• Conformance to specifications
• Cost
Quality of DesignQuality of Design
• Quality characteristics• Price
MarketingMarketingProductionProduction
Meaning of Quality Meaning of Quality
Meaning of Quality
5 – 11
Cost of Quality
Defects: Any instance when a process fails to satisfy its customer.
Types of Cost related with Quality Prevention costs are associated with
preventing defects before they happen. Appraisal costs are incurred when the firm
assesses the performance level of its processes.
Internal failure costs result from defects that are discovered during production of services or products.
External failure costs arise when a defect is discovered after the customer receives the service or product.
5 – 12
Cost of Quality
Cost of Achieving Good QualityPrevention costs
costs incurred during product designAppraisal costs
costs of measuring, testing, and analyzing
Cost of Poor QualityInternal failure costs
include scrap, rework, process failure, downtime, and price reductions
External failure costs include complaints, returns, warranty
claims, liability, and lost sales

5 – 13
1.Prevention Costs
Quality planning costs costs of developing and
implementing quality management program
Product-design costs costs of designing products
with quality characteristics
Process costs costs expended to make
sure productive process conforms to quality specifications
Training costs costs of developing and
putting on quality training programs for employees and management
Information costs costs of acquiring and
maintaining data related to quality, and development of reports on quality performance
5 – 14
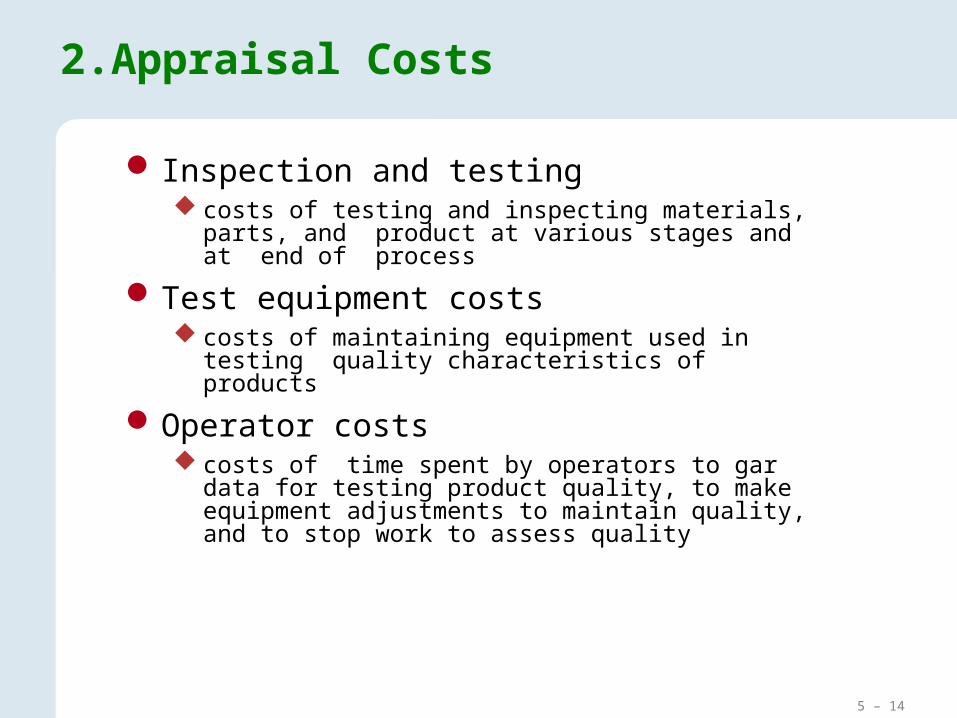
2.Appraisal Costs
Inspection and testing costs of testing and inspecting materials, parts, and
product at various stages and at end of process
Test equipment costs costs of maintaining equipment used in testing quality
characteristics of products
Operator costs costs of time spent by operators to gar data for testing
product quality, to make equipment adjustments to maintain quality, and to stop work to assess quality
5 – 15
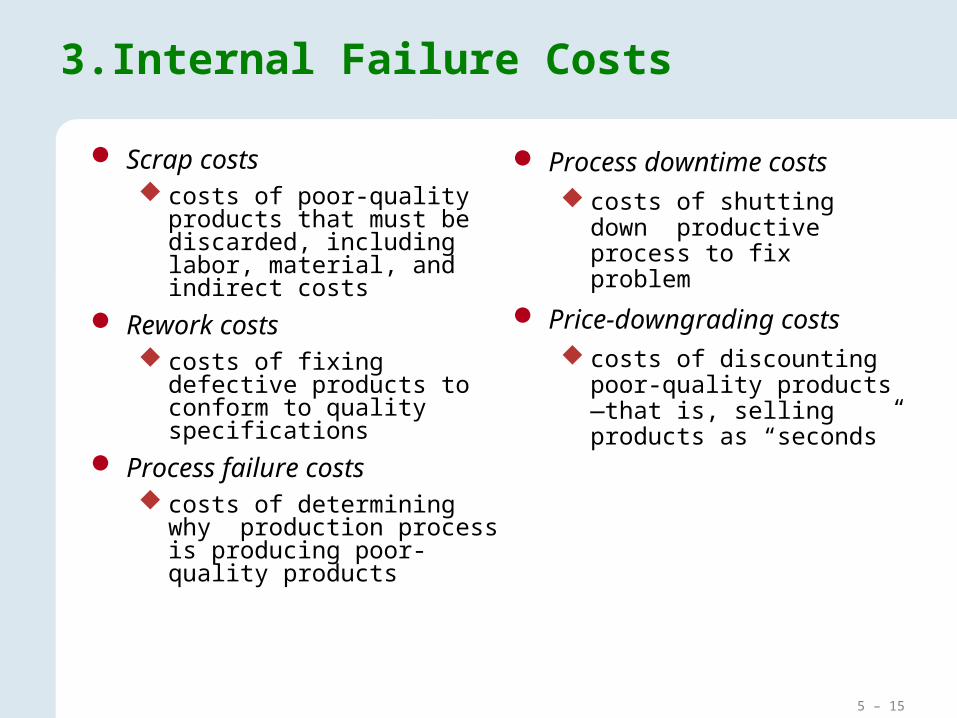
3.Internal Failure Costs
Scrap costs costs of poor-quality products
that must be discarded, including labor, material, and indirect costs
Rework costs costs of fixing defective
products to conform to quality specifications
Process failure costs costs of determining why
production process is producing poor-quality products
Process downtime costs costs of shutting down
productive process to fix problem
Price-downgrading costs costs of discounting poor-
quality products—that is, selling products as “seconds”
5 – 16
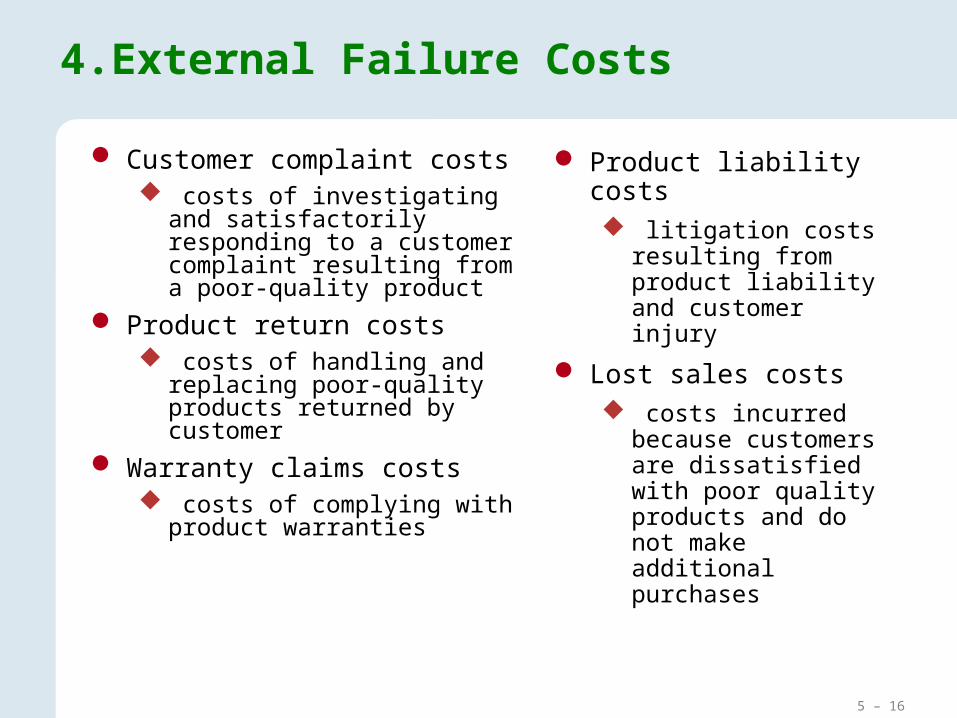
4.External Failure Costs
Customer complaint costs costs of investigating and
satisfactorily responding to a customer complaint resulting from a poor-quality product
Product return costs costs of handling and replacing
poor-quality products returned by customer
Warranty claims costs costs of complying with product
warranties
Product liability costs litigation costs resulting
from product liability and customer injury
Lost sales costs costs incurred because
customers are dissatisfied with poor quality products and do not make additional purchases
5 – 17
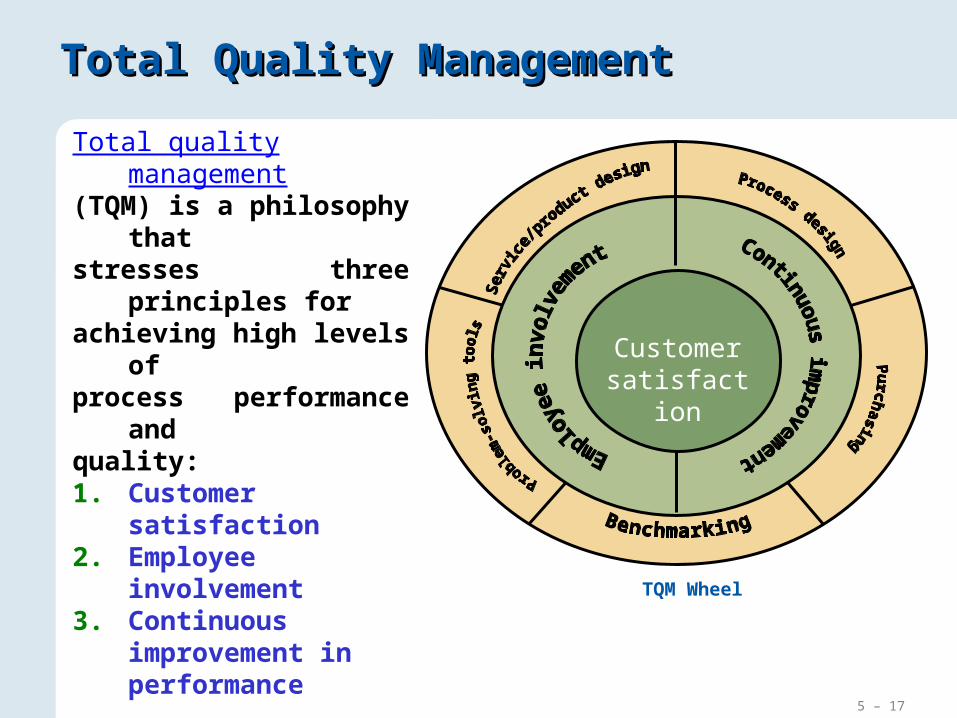
Total Quality ManagementTotal Quality Management
TQM Wheel
Customer satisfaction
Total quality management (TQM) is a philosophy
that stresses three
principles forachieving high levels
ofprocess performance
andquality:1. Customer
satisfaction2. Employee
involvement3. Continuous
improvement in performance
5 – 18
1.Customer Satisfaction1.Customer Satisfaction
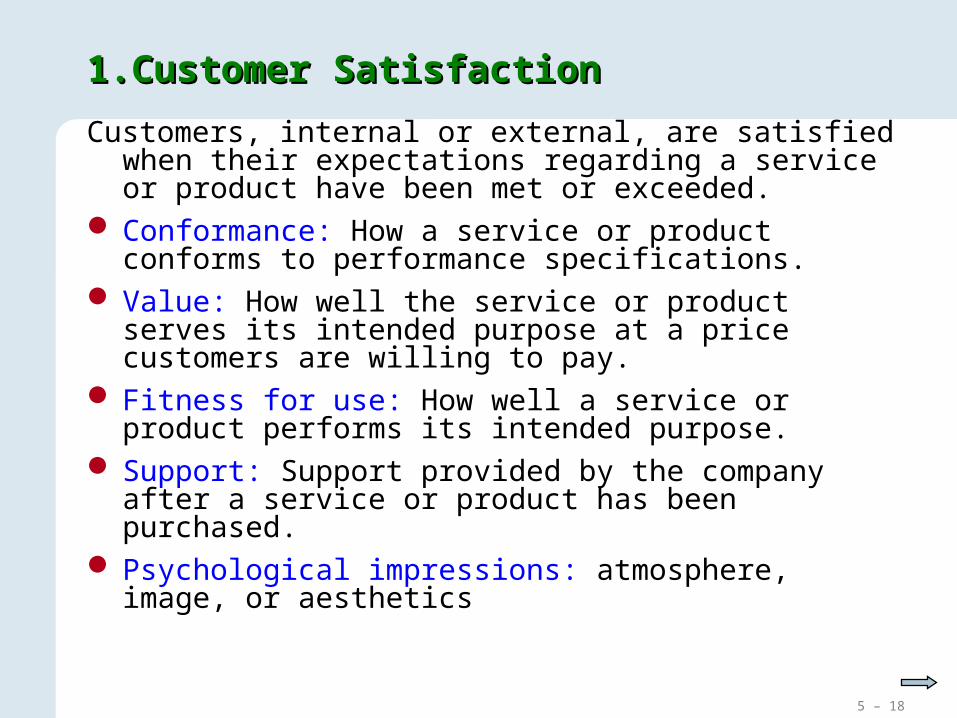
Customers, internal or external, are satisfied when their expectations regarding a service or product have been met or exceeded.
Conformance: How a service or product conforms to performance specifications.
Value: How well the service or product serves its intended purpose at a price customers are willing to pay.
Fitness for use: How well a service or product performs its intended purpose.
Support: Support provided by the company after a service or product has been purchased.
Psychological impressions: atmosphere, image, or aesthetics

5 – 19
2. Employee Involvement2. Employee Involvement
Cultural ChangeDefining customer for each employeesPhilosophy of “quality at source”
Teams- Small groups of people who have a common purpose, set their own performance goals and approaches, and hold themselves accountable for success.
a) Problem-solving teams b) Special purpose team c) Self managing teams
Individual DevelopmentTraining
New work methods to experienced workersCurrent practices to new workers
Awards and Incentives
5 – 20
3. Continuous Improvement3. Continuous Improvement
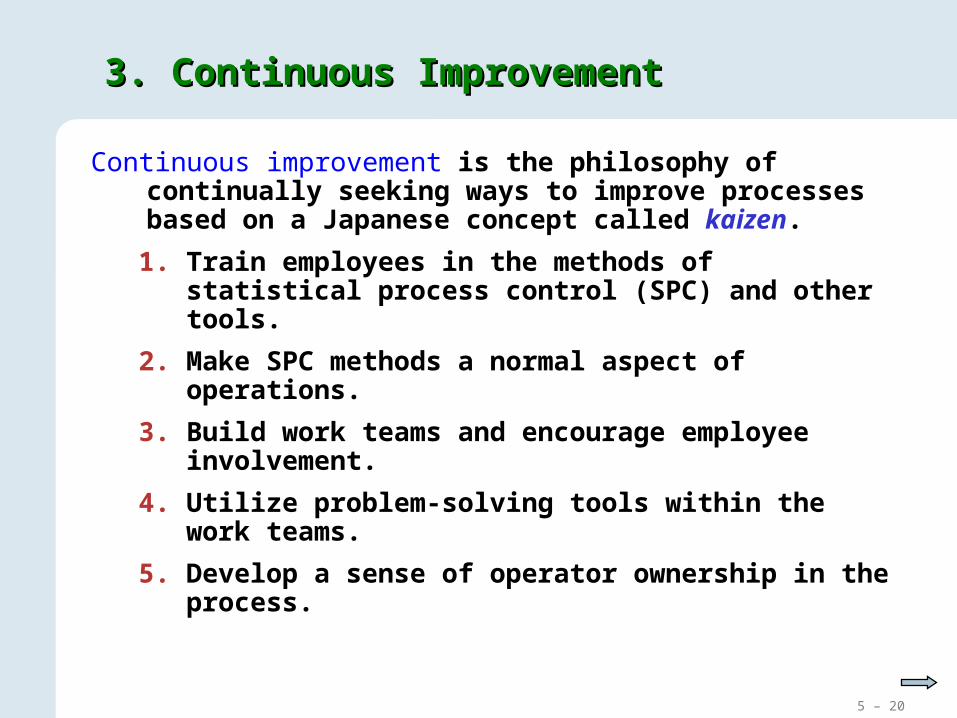
Continuous improvement is the philosophy of continually seeking ways to improve processes based on a Japanese concept called kaizen.
1. Train employees in the methods of statistical process control (SPC) and other tools.
2. Make SPC methods a normal aspect of operations.
3. Build work teams and encourage employee involvement.
4. Utilize problem-solving tools within the work teams.
5. Develop a sense of operator ownership in the process.

5 – 21
The Deming WheelThe Deming Wheel
Figure 5.2 – Plan-Do-Study-Act Cycle
1. PlanIdentify problem and develop plan for improvement.
2. DoImplement plan on a test basis.
3. Study/CheckAssess plan; is it working?
4. ActInstitutionalize improvement; continue cycle.
5 – 22
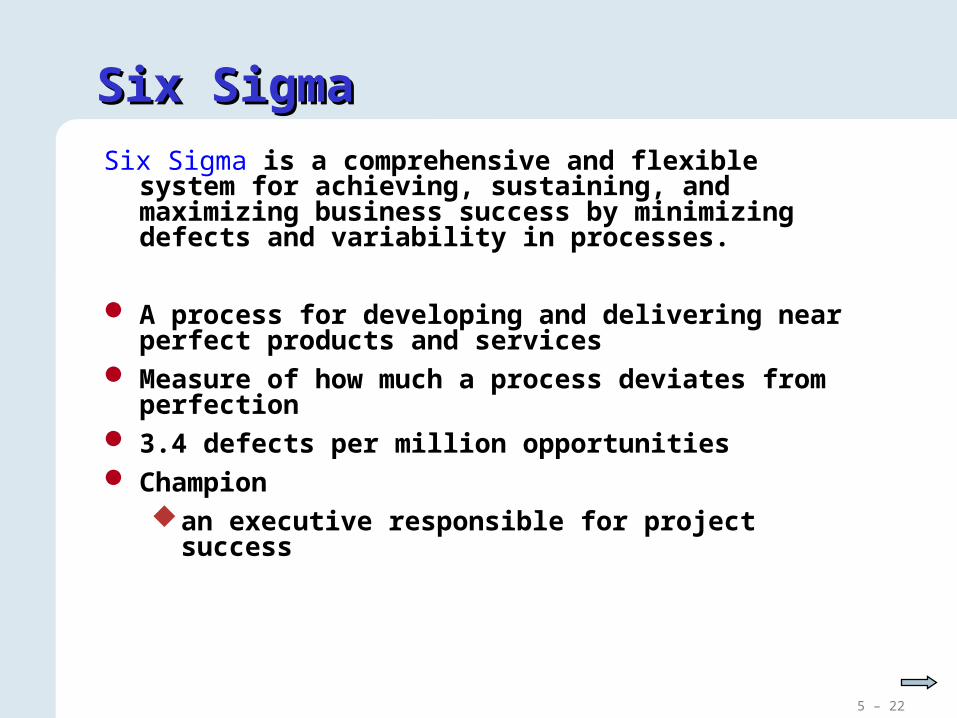
Six SigmaSix SigmaSix Sigma is a comprehensive and flexible system
for achieving, sustaining, and maximizing business success by minimizing defects and variability in processes.
A process for developing and delivering near perfect products and services
Measure of how much a process deviates from perfection
3.4 defects per million opportunities Champion
an executive responsible for project success
5 – 23
Six SigmaSix Sigma
X X
X X
XX
XX X
XXXXX XXX
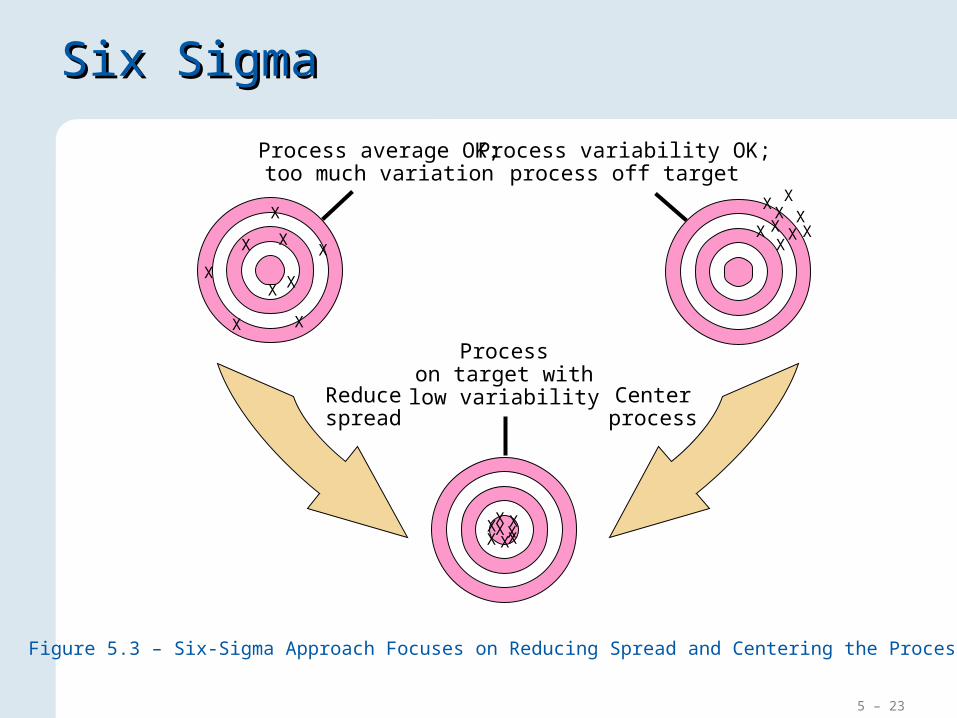
Process average OK;too much variation
Process variability OK;process off target
Processon target withlow variabilityReduce
spreadCenterprocess
X
X
X
X
X
X X
X
X
Figure 5.3 – Six-Sigma Approach Focuses on Reducing Spread and Centering the Process
5 – 24
Six Sigma Improvement ModelSix Sigma Improvement Model
Control
Improve
Analyze
Measure
Define
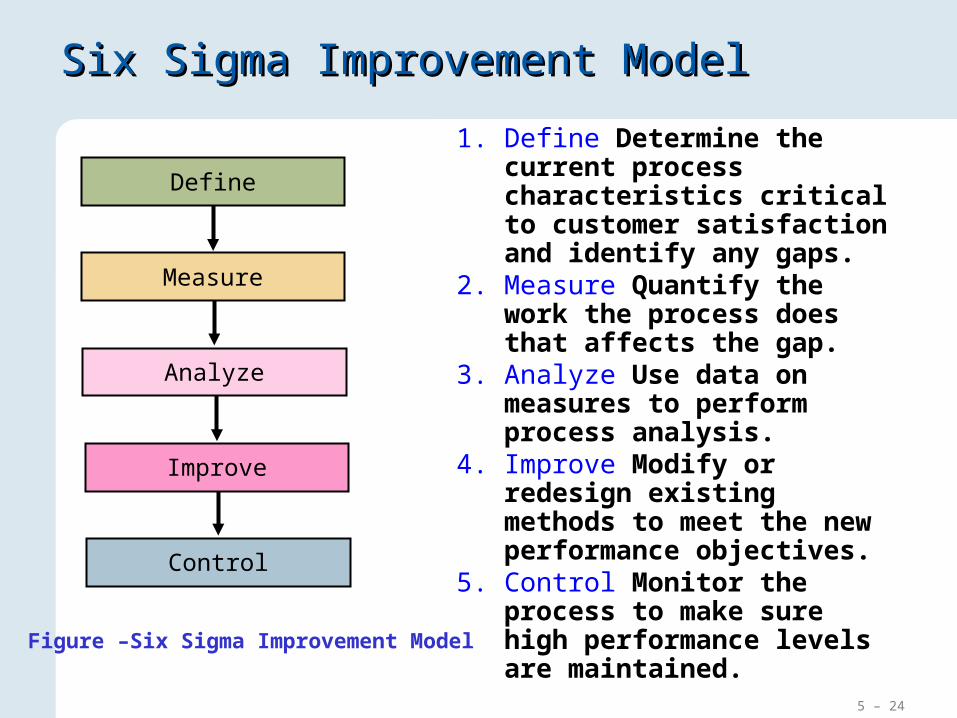
Figure –Six Sigma Improvement Model
1. Define Determine the current process characteristics critical to customer satisfaction and identify any gaps.
2. Measure Quantify the work the process does that affects the gap.
3. Analyze Use data on measures to perform process analysis.
4. Improve Modify or redesign existing methods to meet the new performance objectives.
5. Control Monitor the process to make sure high performance levels are maintained.

5 – 25
3.4 DPMO3.4 DPMO
67,000 DPMOcost = 25% of
sales
67,000 DPMOcost = 25% of
sales
DEFINEDEFINE CONTROLCONTROLIMPROVEIMPROVEANALYZEANALYZEMEASUREMEASURE
Six Sigma: DMAIC
5 – 26
Six Sigma EducationSix Sigma Education
Green Belt: An employee who achieved the first level of training in a Six Sigma program and spends part of his or her time teaching and helping teams with their projects.
Black Belt: An employee who reached the highest level of training in a Six Sigma program and spends all of his or her time teaching and leading teams involved in Six Sigma projects.
Master Black Belt: Full-time teachers and mentors to several black belts.
5 – 27
Six Sigma EducationSix Sigma Education
Black Belt project leader
Master Black Belta teacher and mentor for
Black Belts
Green Beltsproject team members
5 – 28
International Quality Documentation International Quality Documentation StandardsStandards
ISOISO90009000
ISO 9000:2000 addresses quality management by specifying what the firm does to fulfill the customer’s quality requirements and applicable regulatory requirements while enhancing customer satisfaction and achieving continual improvement of its performanceCompanies must be certified by an external examinerAssures customers that the organization is performing as they say they are
.
5 – 29
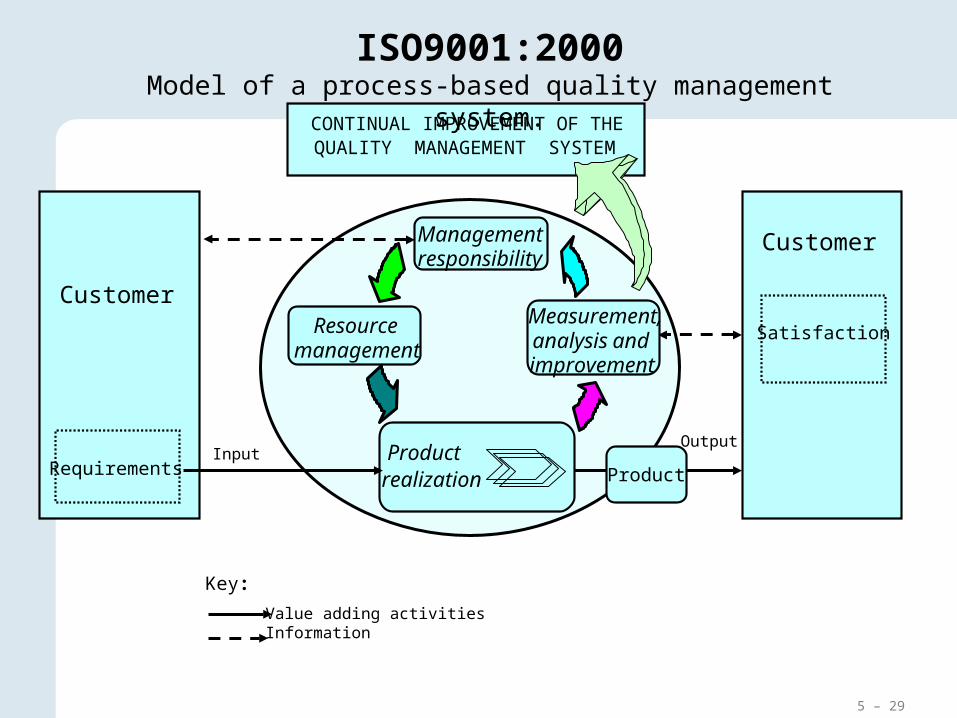
QUALITY MANAGEMENT SYSTEM CONTINUAL IMPROVEMENT OF THE
Managementresponsibility
Resourcemanagement
Value adding activitiesInformation
Key:
ISO9001:2000Model of a process-based quality management system.
Measurement,analysis andimprovement
Customer
Customer
Satisfaction
Productrealization
InputOutput
ProductRequirements
5 – 30
International Quality Documentation International Quality Documentation StandardsStandards
ISOISO1400014000
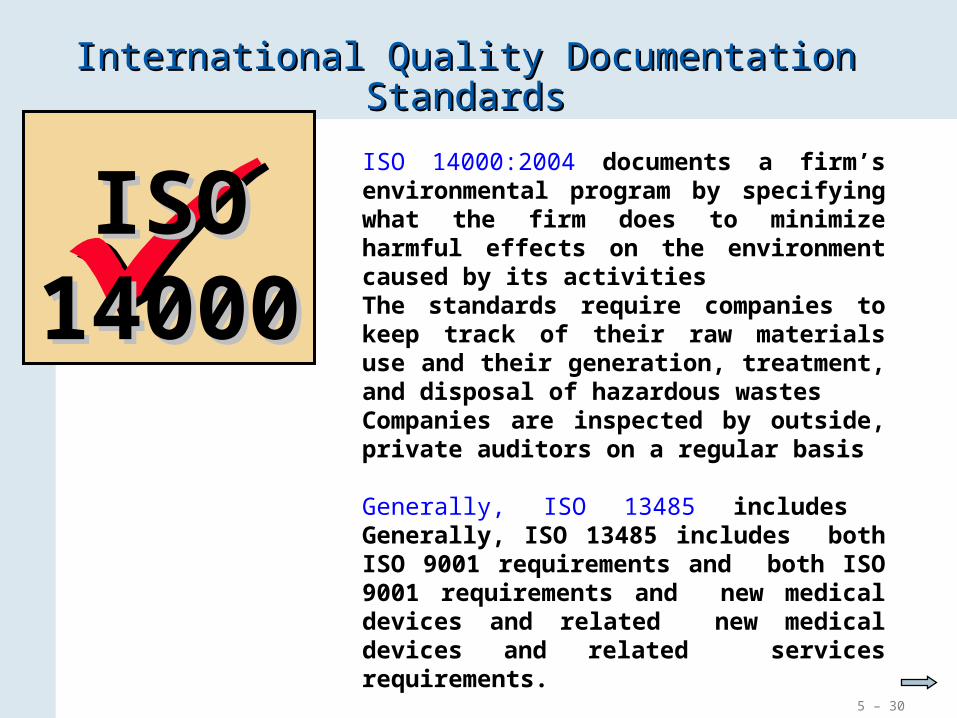
ISO 14000:2004 documents a firm’s environmental program by specifying what the firm does to minimize harmful effects on the environment caused by its activitiesThe standards require companies to keep track of their raw materials use and their generation, treatment, and disposal of hazardous wastesCompanies are inspected by outside, private auditors on a regular basis
Generally, ISO 13485 includes Generally, ISO 13485 includes both ISO 9001 requirements and both ISO 9001 requirements and new medical devices and related new medical devices and related services requirements.

5 – 31
International Quality Documentation StandardsInternational Quality Documentation Standards
TL 9000 Quality Management System :In 1998, QuEST Forum developed the TL 9000 Quality Management System to meet the supply chain quality requirements of the worldwide telecommunications industry. Through TL 9000, it set out to achieve the following goals:
Establish and maintain a common set of telecom QMS requirements, which reduces the number of standards for the industry
Foster a system that protects the integrity and use of telecom products hardware, software and services
Define effective cost and performance-based measurements to guide progress and evaluate the results of QMS implementation
Drive continual improvement and enhance customer relationships
Leverage the industry conformity assessment process
5 – 32
International Quality Documentation International Quality Documentation StandardsStandards
External benefits are primarily increased sales opportunities
ISO certification is preferred or required by many corporate buyers
Internal benefits include improved profitability, improved marketing, reduced costs, and improved documentation and improvement of processes
5 – 33Copyright © 2010 Pearson Education, Inc. Publishing as Prentice Hall.
Malcolm Baldrige National Malcolm Baldrige National Quality AwardQuality Award
The Malcolm Baldrige National Quality Award promotes, recognizes, and publicizes quality strategies and achievements by outstanding organizations
It is awarded annually after a rigorous application and review process
Award winners report increased productivity, more satisfied employees and customers, and improved profitability

5 – 34
1. Category 1 ─ Leadership
120 points2. Category 2 ─ Strategic Planning
85 points3. Category 3 ─ Customer and Market Focus
85 points4. Category 4 ─ Measurement, Analysis, and
Knowledge Management
90 points5. Category 5 ─ Human Resource Focus
85 points6. Category 6 ─ Process Management
85 points7. Category 7 ─ Business Results
450 points
Malcolm Baldrige National Quality Award
Named after the late secretary of commerce, a strong proponent of enhancing quality as a means of reducing the trade deficit. The award promotes, recognizes, and publicizes quality strategies and achievements.
5 – 35
Deming Prize
Dr. Deming was in Japan giving lectures on statistical process control and was recorded for distribution and profit.
Funds were donated to JUSE Kenichi Koyanagi, the managing director of the
Japanese Union of Scientists and Engineers (JUSE), used those funds to create the Deming
prize to individuals or organizations in 1951. The purpose of the Deming Prize was to recognize
those who excelled in quality control and as a way of driving quality control. It was also established to thank Dr. Deming for his accomplishments and impact in the Japanese industry.
Award available to individuals and organizations, whereas others do not (such as Baldrige only for organizations)
5 – 36
Deming Prize
Concentrates on :
Policy Organization and operations Collection and use of
information Analysis Planning for future Education and training Quality assurance Quality effects Standardization Control
5 – 37
Other Awards for Quality
National individual awards Armand V. Feigenbaum
Medal
Deming Medal
E. Jack Lancaster Medal
Edwards Medal
Shewart Medal
Ishikawa Medal
International awards European Quality Award
Canadian Quality Award
Australian Business Excellence Award
Deming Prize from Japans
5 – 38
Statistical Process ControlStatistical Process Control
Statistical process control is the application of statistical techniques to determine whether a process is delivering what the customer wants.
Acceptance sampling is the application of statistical techniques to determine whether a quantity of material should be accepted or rejected based on the inspection or test of a sample.
Variables: Service or product characteristics that can be measured, such as weight, length, volume, or time.
Attributes: Service or product characteristics that can be quickly counted for acceptable performance.
5 – 39
SamplingSampling
Sampling plan: A plan that specifies a sample size, the time between successive samples, and decision rules that determine when action should be taken.
Sample size: A quantity of randomly selected observations of process outputs.
5 – 40
Sample Means and the Process DistributionSample Means and the Process Distribution
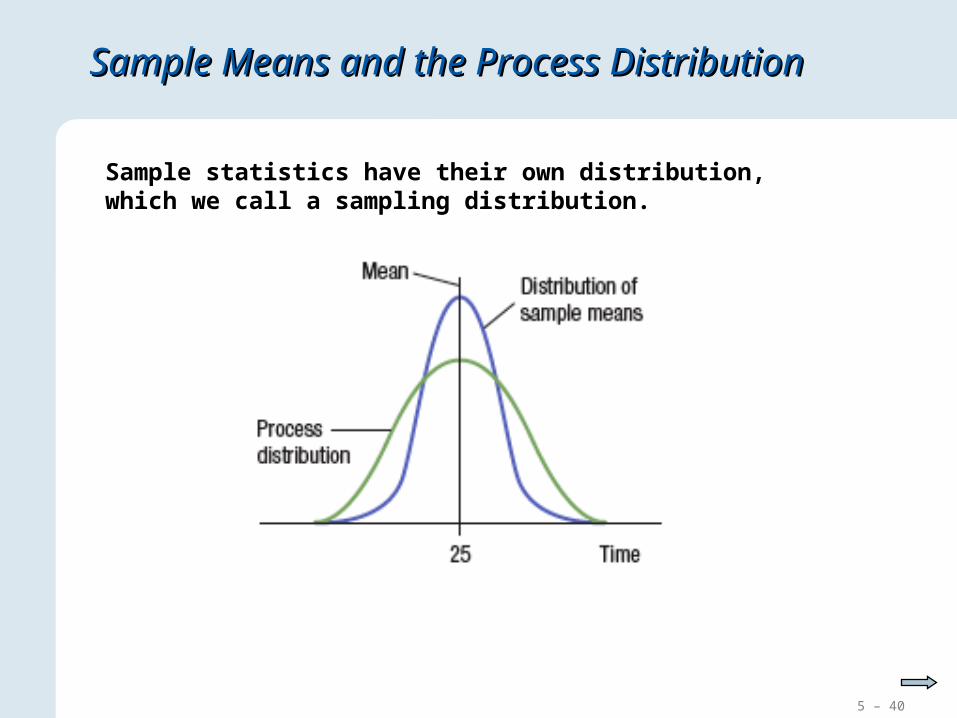
Sample statistics have their own distribution, which we call a sampling distribution.

5 – 41
Sampling DistributionsSampling Distributions
x xi
i1
n
n
Sample Mean
A sample mean is the sum of the observations divided by the total number of observations.
where
xi = observations of a quality characteristic such as time.
n = total number of observations
x = meanThe distribution of sample means can be approximated by the normal distribution.
5 – 42
Sample RangeSample Range
1
2
n
xxi
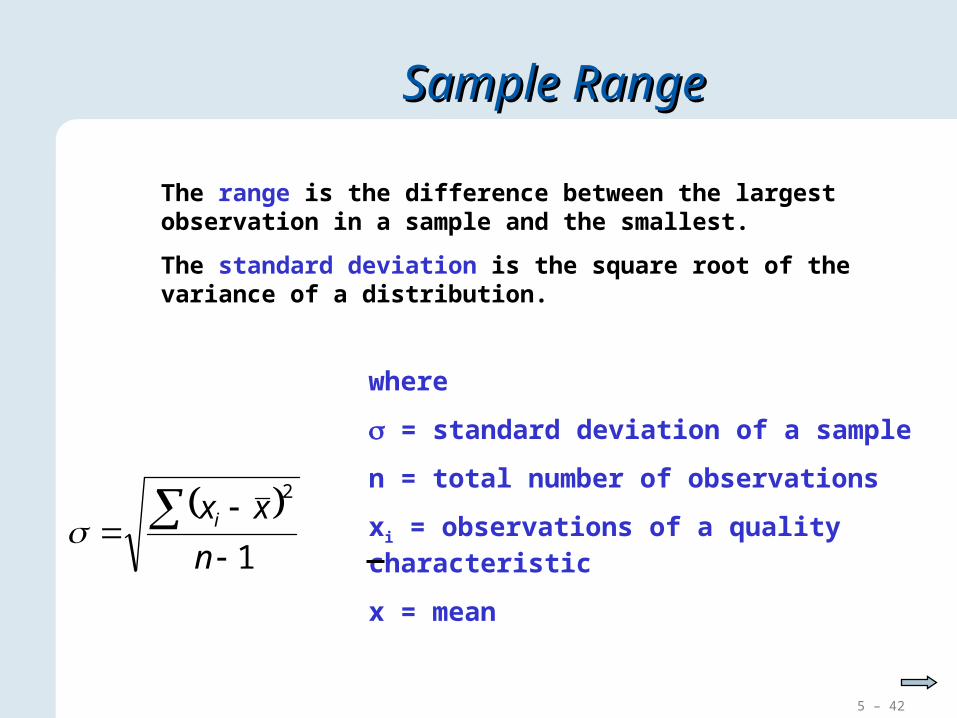
The range is the difference between the largest observation in a sample and the smallest.
The standard deviation is the square root of the variance of a distribution.
where
= standard deviation of a sample
n = total number of observations
xi = observations of a quality characteristic
x = mean
5 – 43
Process DistributionsProcess Distributions
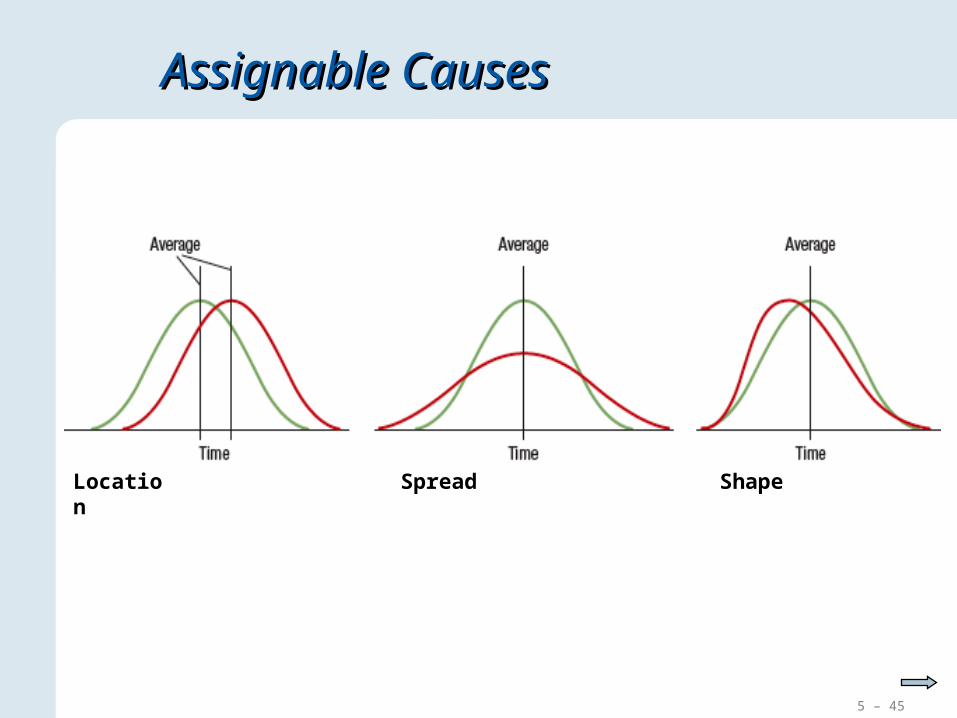
A process distribution can be characterized by its location, spread, and shape.
Location is measured by the mean of the distribution and spread is measured by the range or standard deviation.
The shape of process distributions can be characterized as either symmetric or skewed.
A symmetric distribution has the same number of observations above and below the mean.
A skewed distribution has a greater number of observations either above or below the mean.
5 – 44
Causes of VariationCauses of Variation
Two basic categories of variation in output include common causes and assignable causes.
Common causes are the purely random, unidentifiable sources of variation that are unavoidable with the current process.
If process variability results solely from common causes of variation, a typical assumption is that the distribution is symmetric, with most observations near the center.
Assignable causes of variation are any variation-causing factors that can be identified and eliminated, such as a machine needing repair.
5 – 45
Assignable CausesAssignable Causes
Location Spread Shape
5 – 46
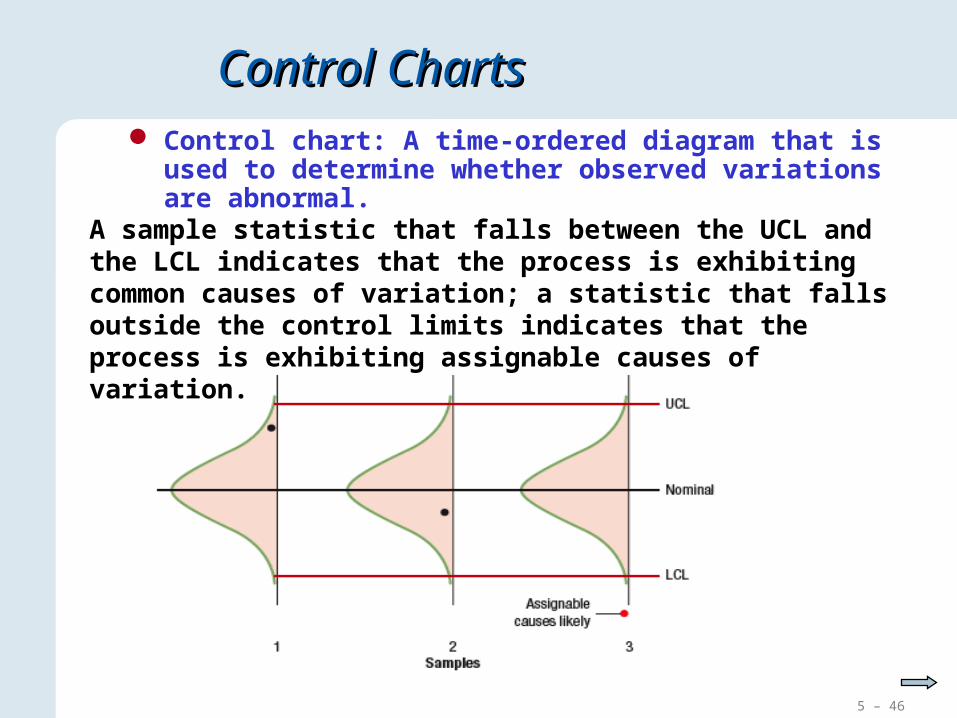
Control ChartsControl Charts Control chart: A time-ordered diagram that is
used to determine whether observed variations are abnormal.
A sample statistic that falls between the UCL and the LCL indicates that the process is exhibiting common causes of variation; a statistic that falls outside the control limits indicates that the process is exhibiting assignable causes of variation.
5 – 47
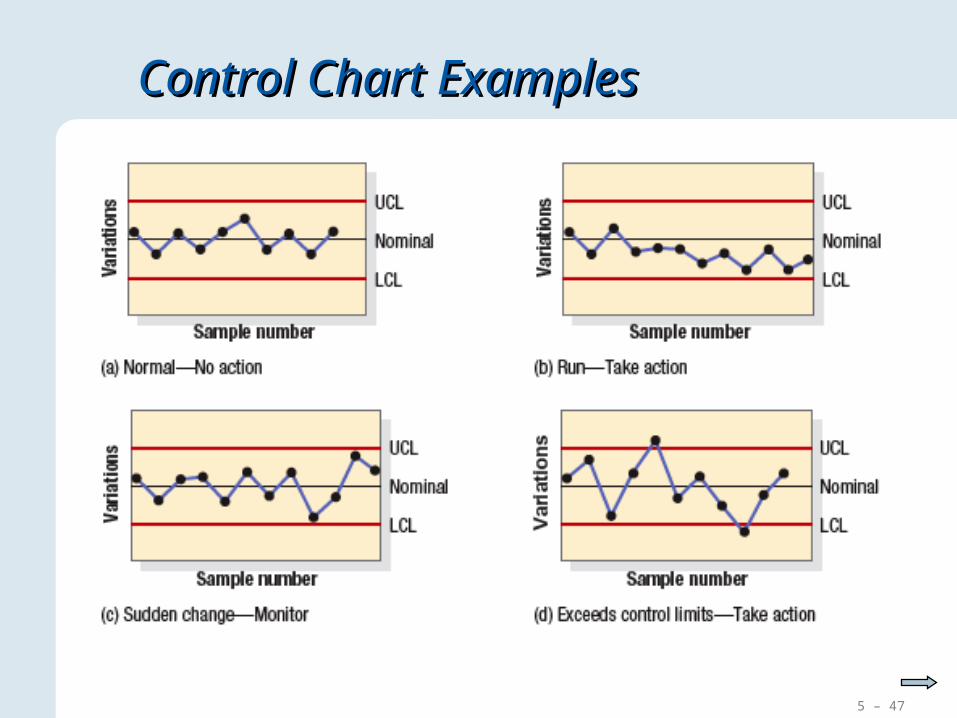
Control Chart ExamplesControl Chart Examples
5 – 48
Type I and II ErrorsType I and II Errors
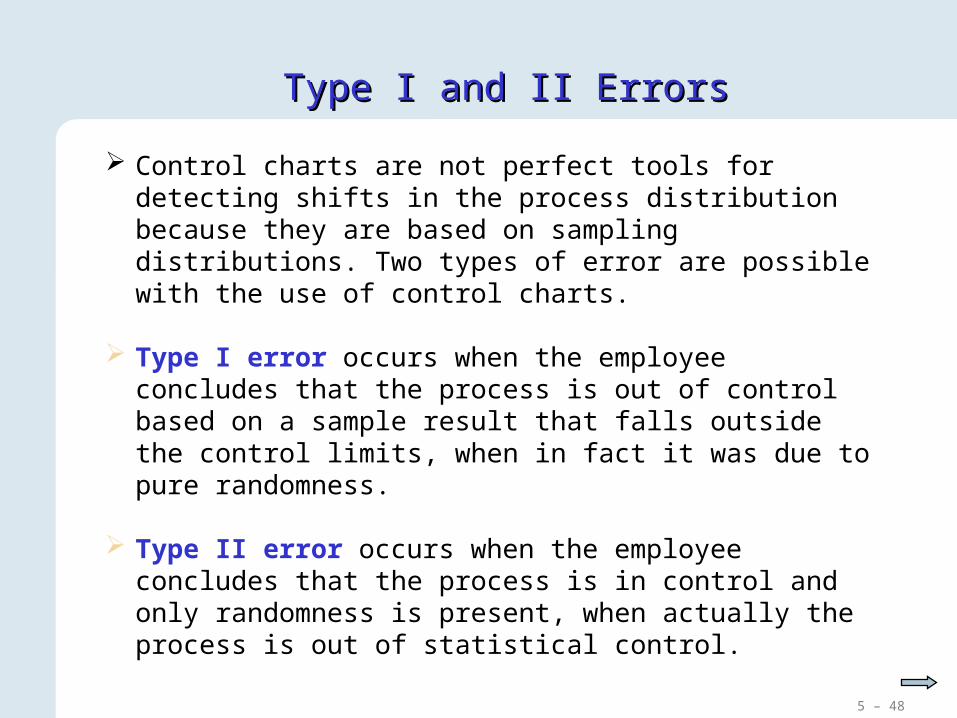
Control charts are not perfect tools for detecting shifts in the process distribution because they are based on sampling distributions. Two types of error are possible with the use of control charts.
Type I error occurs when the employee concludes that the process is out of control based on a sample result that falls outside the control limits, when in fact it was due to pure randomness.
Type II error occurs when the employee concludes that the process is in control and only randomness is present, when actually the process is out of statistical control.

5 – 49
Statistical Process Control MethodsStatistical Process Control Methods
Control Charts for variables are used to monitor the mean and variability of the process distribution.
R-chart (Range Chart) is used to monitor process variability.
x-chart is used to see whether the process is generating output, on average, consistent with a target value set by management for the process or whether its current performance, with respect to the average of the performance measure, is consistent with past performance.
If the standard deviation of the process is known, we can place UCL and LCL at “z” standard deviations from the mean at the desired confidence level.
5 – 50
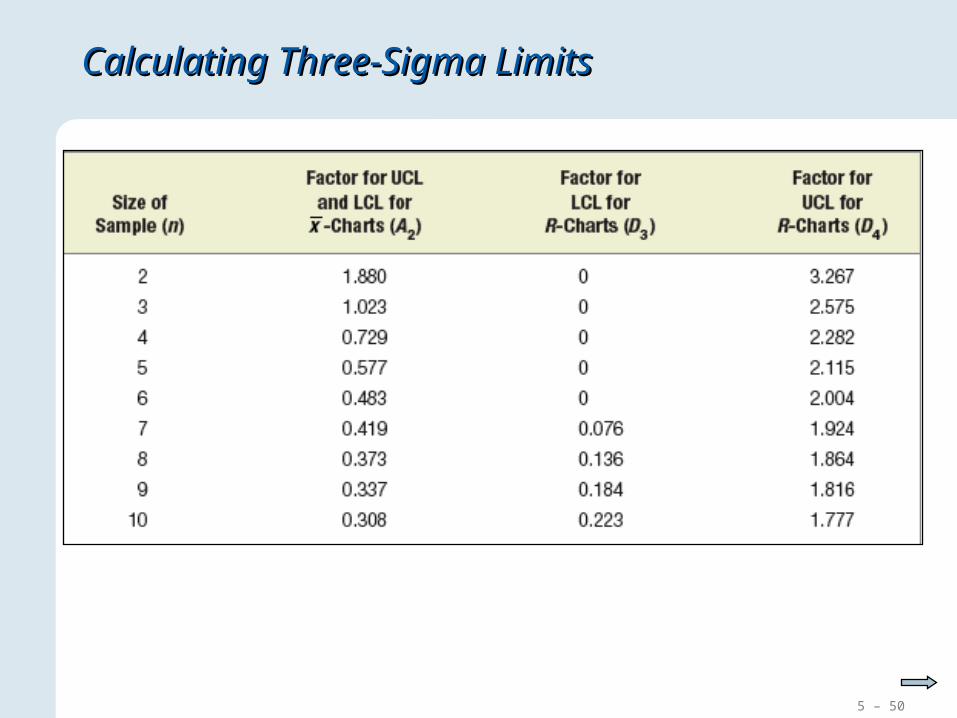
Calculating Three-Sigma LimitsCalculating Three-Sigma Limits
5 – 51
West Allis IndustriesWest Allis IndustriesExample 6.1Example 6.1
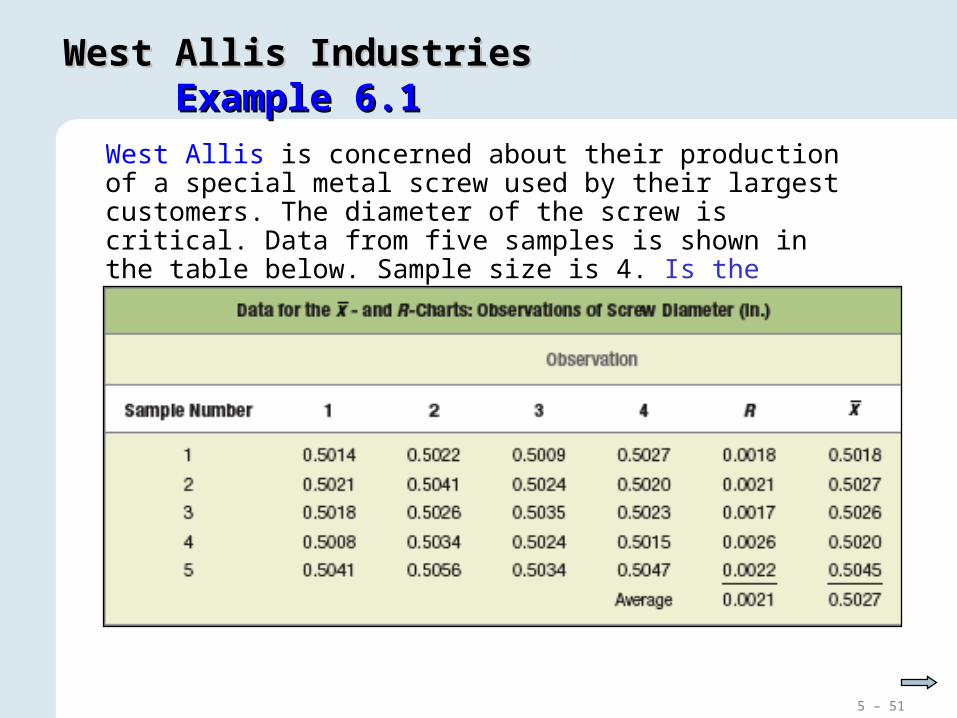
West Allis is concerned about their production of a special metal screw used by their largest customers. The diameter of the screw is critical. Data from five samples is shown in the table below. Sample size is 4. Is the process in statistical control?

5 – 52
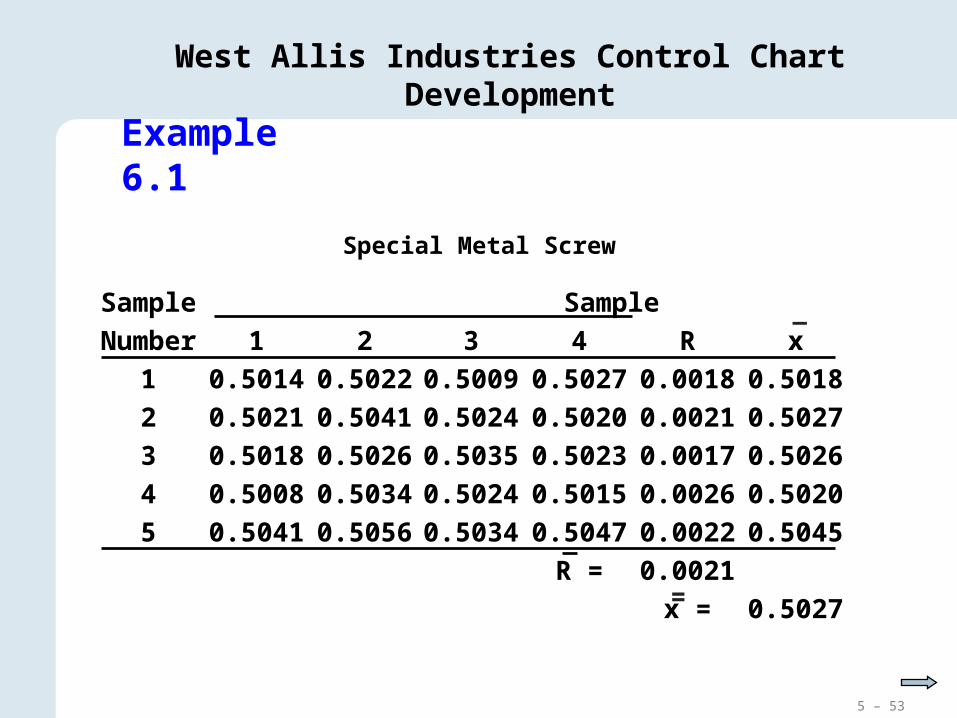
West Allis Industries Control Chart Development
Sample Sample
Number 1 2 3 4 R x
1 0.5014 0.5022 0.5009 0.5027 0.0018 0.5018
2 0.5021 0.5041 0.5024 0.5020
3 0.5018 0.5026 0.5035 0.5023
4 0.5008 0.5034 0.5024 0.5015
5 0.5041 0.5056 0.5034 0.5039
Special Metal Screw
_
0.5027 – 0.5009 = 0.0018
(0.5014 + 0.5022 + 0.5009 + 0.5027)/4 = 0.5018
Example 6.1
5 – 53
Sample Sample
Number 1 2 3 4 R x
1 0.5014 0.5022 0.5009 0.5027 0.0018 0.5018
2 0.5021 0.5041 0.5024 0.5020 0.0021 0.5027
3 0.5018 0.5026 0.5035 0.5023 0.0017 0.5026
4 0.5008 0.5034 0.5024 0.5015 0.0026 0.5020
5 0.5041 0.5056 0.5034 0.5047 0.0022 0.5045
R = 0.0021
x = 0.5027
Special Metal Screw
=
_
Example 6.1
West Allis Industries Control Chart Development
5 – 54
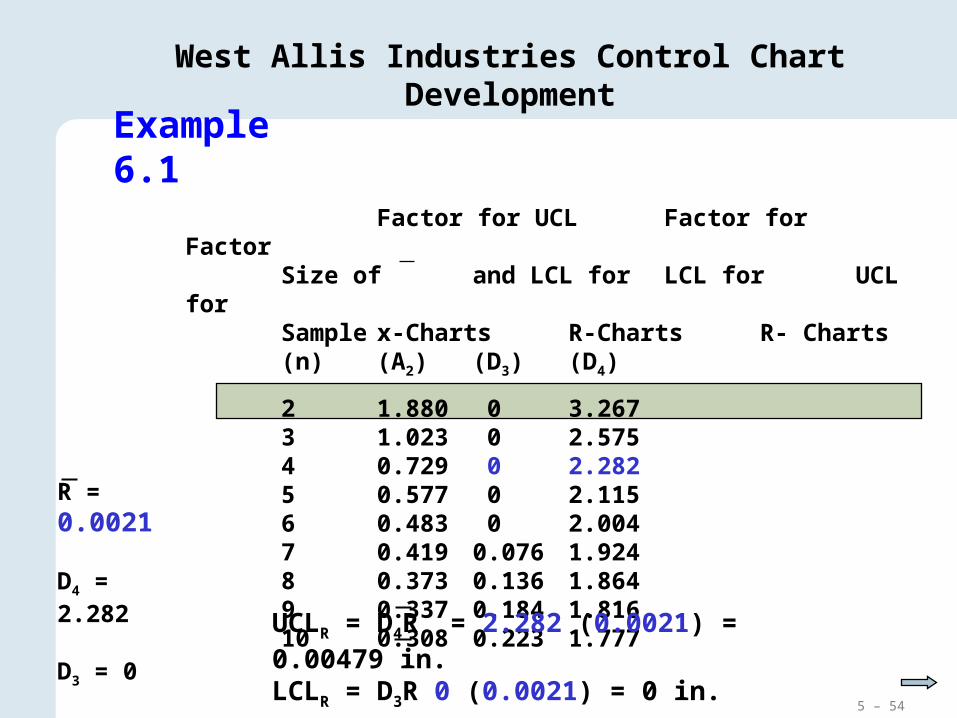
Factor for UCL Factor for FactorSize of and LCL for LCL for UCL forSample x-Charts R-Charts R- Charts(n) (A2) (D3) (D4)
2 1.880 0 3.2673 1.023 0 2.5754 0.729 0 2.2825 0.577 0 2.1156 0.483 0 2.0047 0.419 0.076 1.9248 0.373 0.136 1.8649 0.337 0.184 1.81610 0.308 0.223 1.777
R = 0.0021
D4 = 2.282
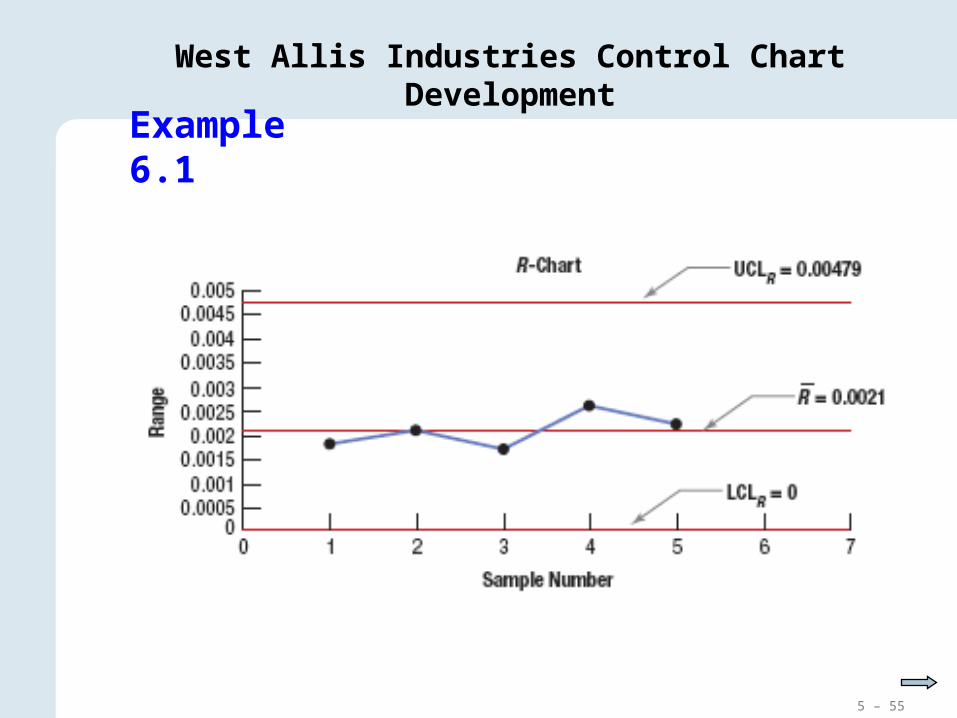
D3 = 0 UCLR = D4R = 2.282 (0.0021) = 0.00479 in.LCLR = D3R 0 (0.0021) = 0 in.
Example 6.1
West Allis Industries Control Chart Development
5 – 55
Example 6.1
West Allis Industries Control Chart Development
5 – 56
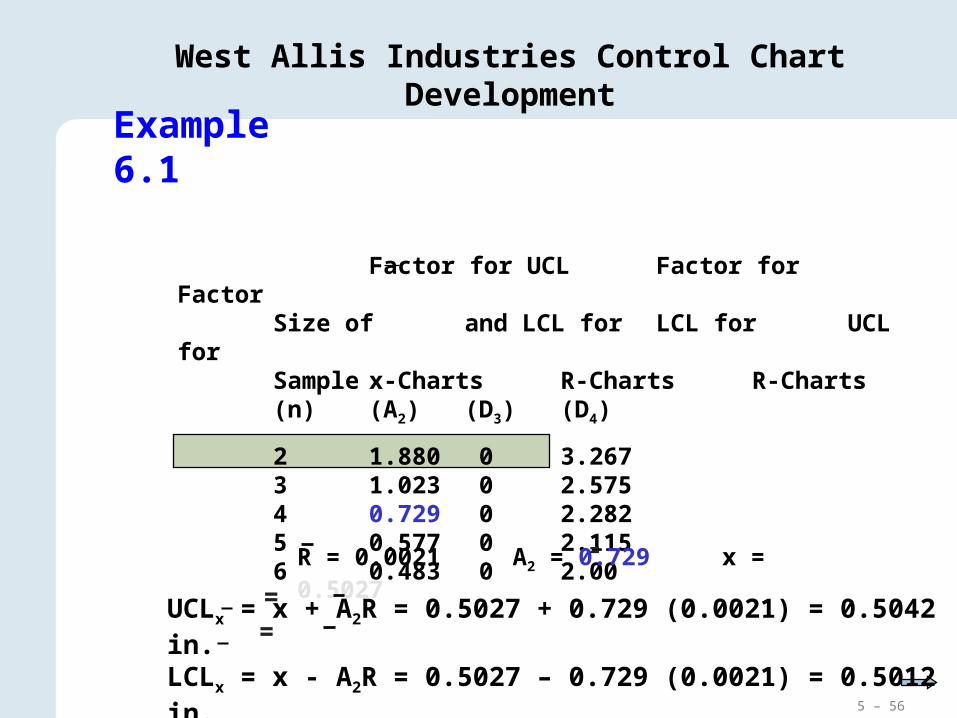
Factor for UCL Factor for FactorSize of and LCL for LCL for UCL forSample x-Charts R-Charts R-Charts(n) (A2) (D3) (D4)
2 1.880 0 3.2673 1.023 0 2.5754 0.729 0 2.2825 0.577 0 2.1156 0.483 0 2.00
R = 0.0021 A2 = 0.729 x = 0.5027=
UCLx = x + A2R = 0.5027 + 0.729 (0.0021) = 0.5042 in.LCLx = x - A2R = 0.5027 – 0.729 (0.0021) = 0.5012 in.
==
Example 6.1
West Allis Industries Control Chart Development
5 – 57
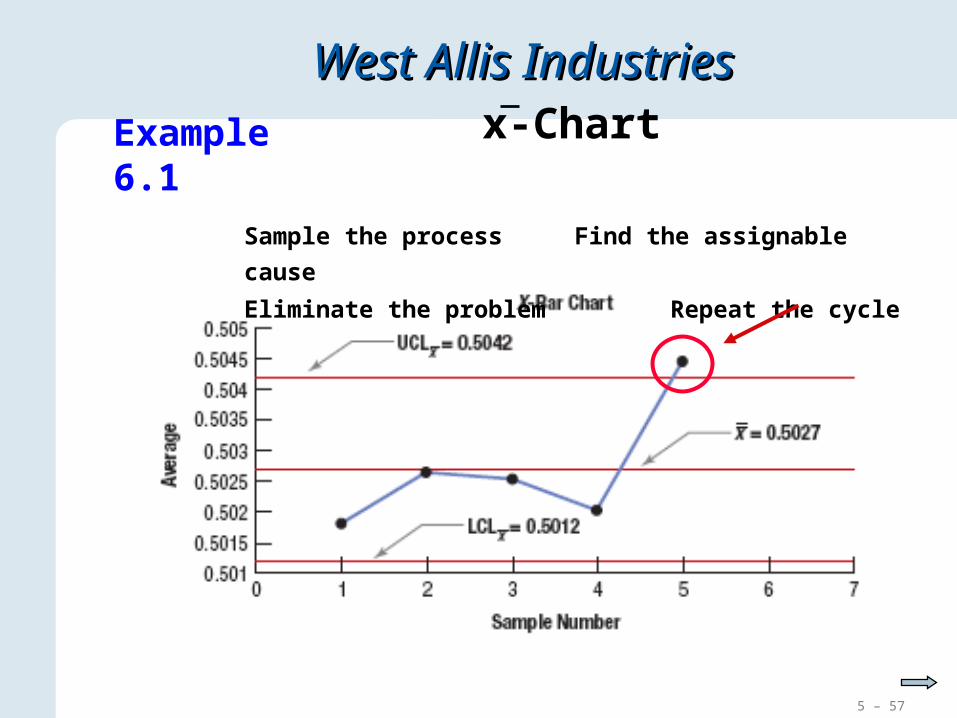
West Allis IndustriesWest Allis Industries x-Chart
Sample the process Find the assignable cause
Eliminate the problem Repeat the cycle
Example 6.1

5 – 58
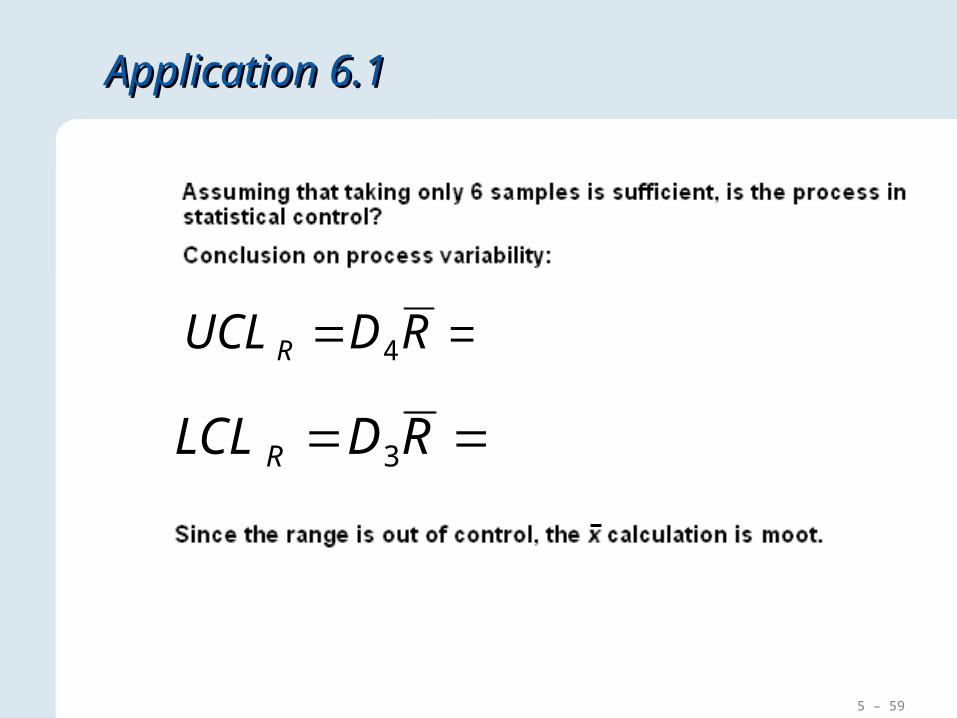
Application 6.1Application 6.1
5 – 59
Application 6.1Application 6.1
708.0)38.0(864.14 RDUCLR
052.0)38.0(136.03 RDLCLR
5 – 60
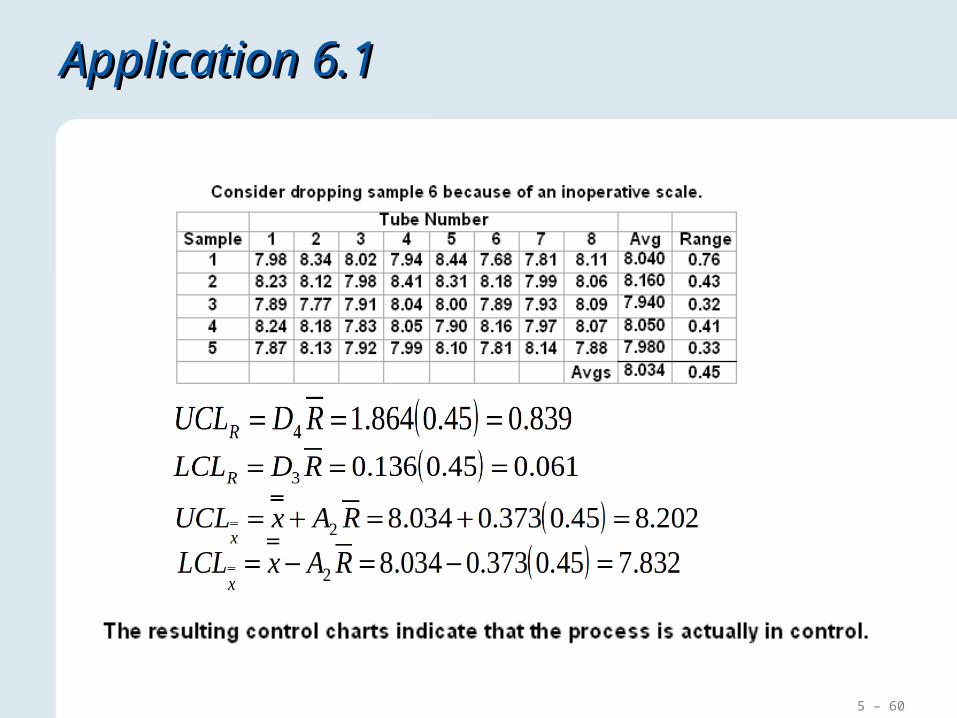
Application 6.1Application 6.1
5 – 61
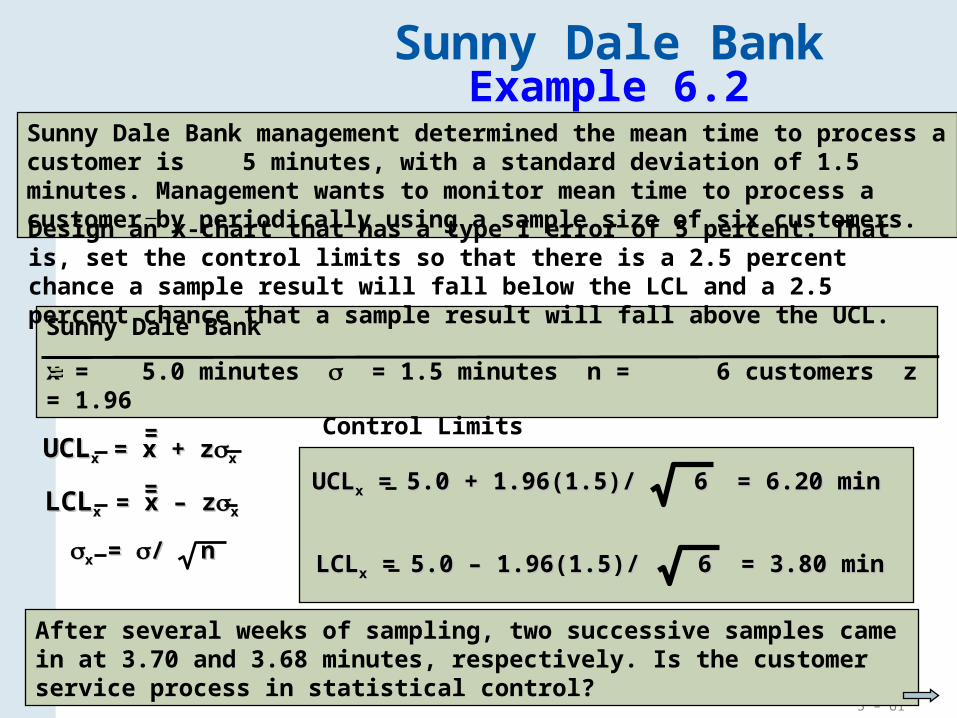
Sunny Dale Bank Example 6.2
==UCLUCLxx = x + z = x + zxx
xx = = //nn
LCLLCLxx = x – z = x – zxx==
Sunny Dale Bank
x = 5.0 minutes = 1.5 minutes n = 6 customers z = 1.96==
Sunny Dale Bank management determined the mean time to process a customer is 5 minutes, with a standard deviation of 1.5 minutes. Management wants to monitor mean time to process a customer by periodically using a sample size of six customers.Design an x-chart that has a type I error of 5 percent. That is, set the control limits so that there is a 2.5 percent chance a sample result will fall below the LCL and a 2.5 percent chance that a sample result will fall above the UCL.
After several weeks of sampling, two successive samples came in at 3.70 and 3.68 minutes, respectively. Is the customer service process in statistical control?
UCLUCLxx = 5.0 + 1.96(1.5)/ 6 = 6.20 min = 5.0 + 1.96(1.5)/ 6 = 6.20 min
LCLLCLxx = 5.0 – 1.96(1.5)/ 6 = 3.80 min = 5.0 – 1.96(1.5)/ 6 = 3.80 min
Control Limits
5 – 62
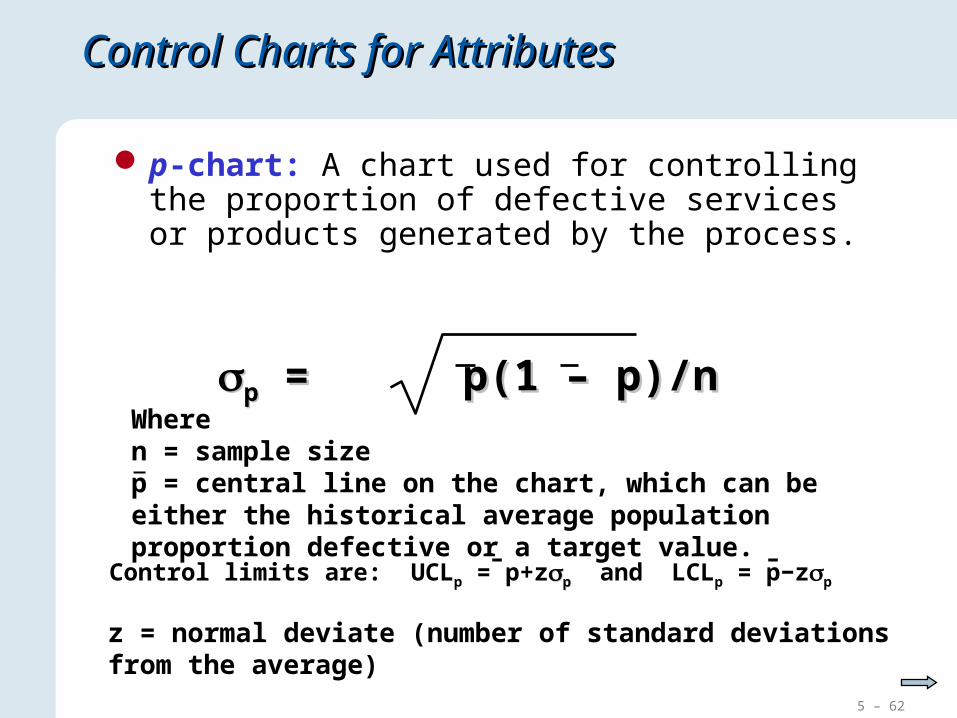
Control Charts for AttributesControl Charts for Attributes
p-chart: A chart used for controlling the proportion of defective services or products generated by the process.
pp = = pp(1 – (1 – pp)/)/nnWheren = sample sizep = central line on the chart, which can be either the historical average population proportion defective or a target value.
z = normal deviate (number of standard deviations from the average)
Control limits are: UCLp = p+zpp and LCLp = p−zp
– –
5 – 63
Hometown BankHometown BankExample 6.3Example 6.3
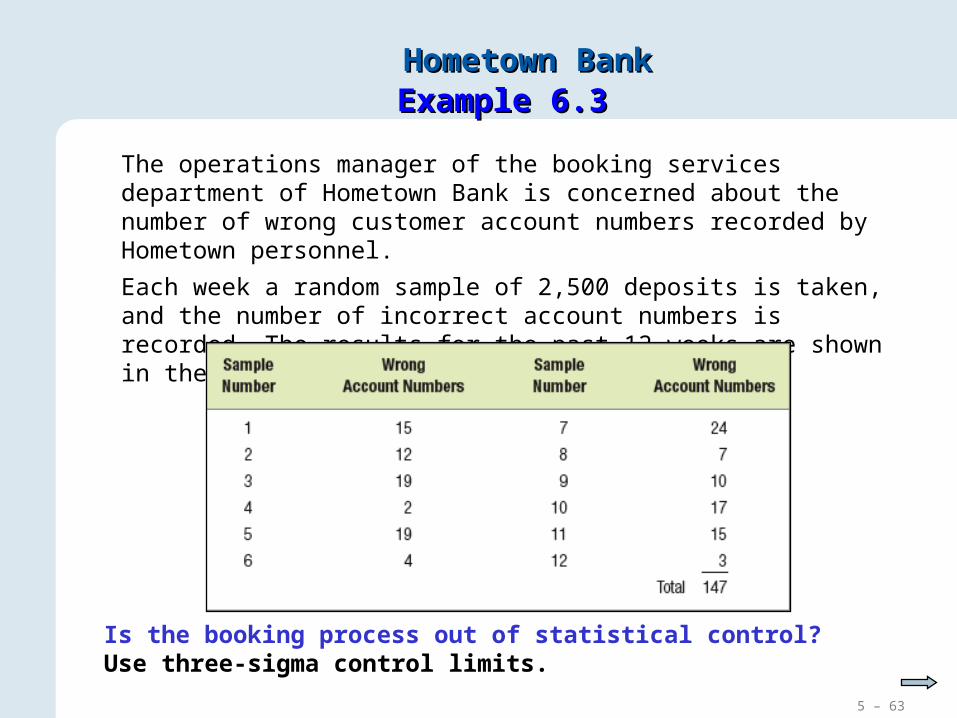
The operations manager of the booking services department of Hometown Bank is concerned about the number of wrong customer account numbers recorded by Hometown personnel.
Each week a random sample of 2,500 deposits is taken, and the number of incorrect account numbers is recorded. The results for the past 12 weeks are shown in the following table.
Is the booking process out of statistical control? Use three-sigma control limits.

5 – 64
Sample Wrong ProportionNumber Account # Defective
1 15 0.006 2 12 0.0048 3 19 0.0076 4 2 0.0008 5 19 0.0076 6 4 0.0016 7 24 0.0096 8 7 0.0028 9 10 0.00410 17 0.006811 15 0.00612 3 0.0012
Total 147
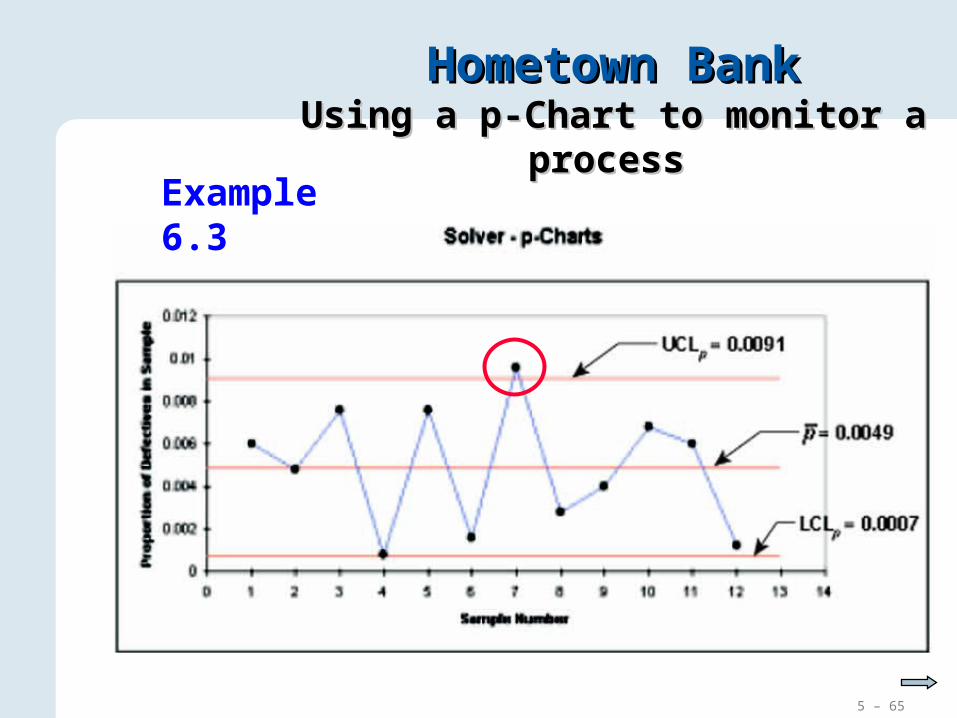
Hometown BankHometown BankUsing a p-Chart to monitor a processUsing a p-Chart to monitor a process
n = 2500
p =147
12(2500)= 0.0049
pp = = pp(1 – (1 – pp)/)/nn
pp = = 0.0049(1 – 0.00490.0049(1 – 0.0049)/)/25002500
pp = 0.0014 = 0.0014
UCLp = 0.0049 + 3(0.0014)
= 0.0091 LCLp = 0.0049 – 3(0.0014) = 0.0007
5 – 65
Hometown BankHometown BankUsing a p-Chart to monitor a processUsing a p-Chart to monitor a process
Example 6.3
5 – 66
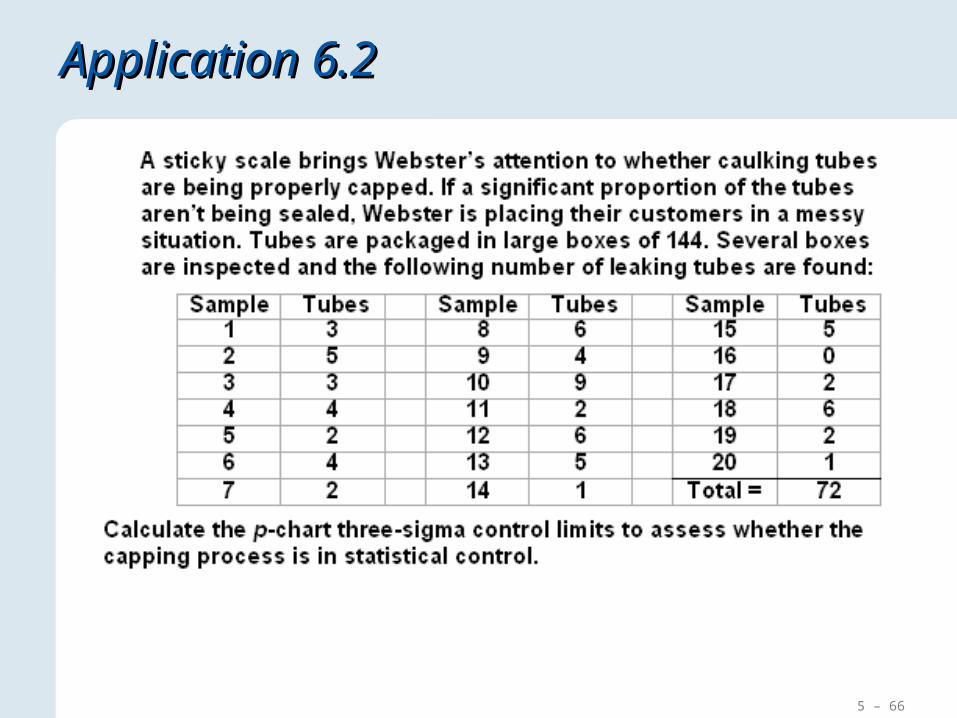
Application 6.2Application 6.2
5 – 67
Application 6.2Application 6.2
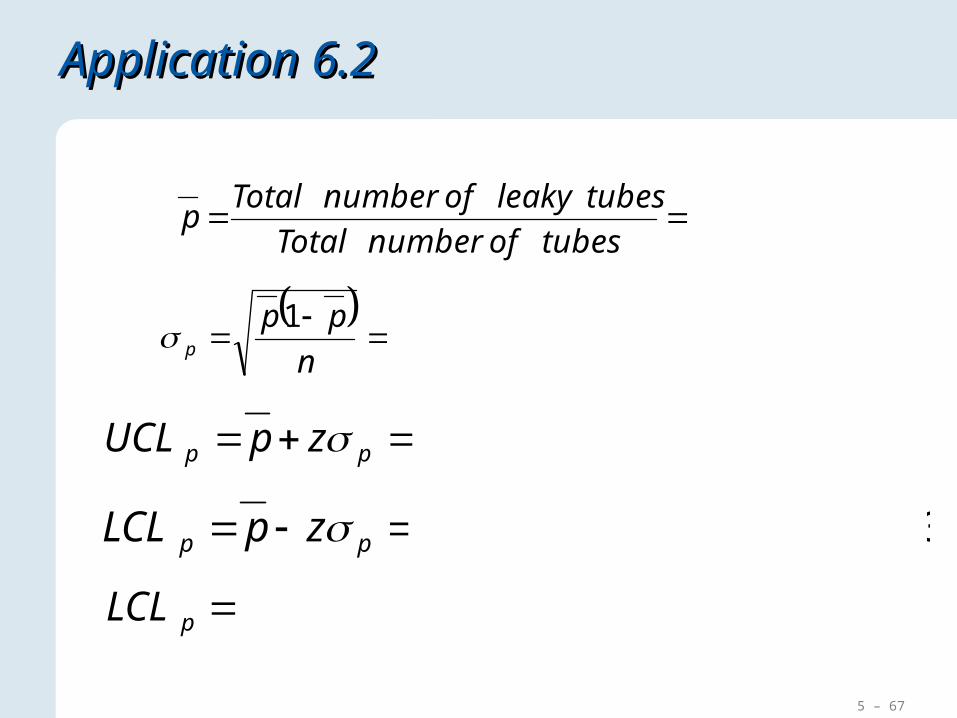
025.014420
72
tubesofnumberTotal
tubesleakyofnumberTotalp
01301.0
144
025.01025.01
n
ppp
06403.001301.03025.0 pp zpUCL
01403.001301.03025.0 pp zpLCL
0pLCL

5 – 68
c-chart: A chart used for controlling the number of defects when more than one defect can be present in a service or product.
The underlying sampling distribution for a c-chart is the Poisson distribution.
The mean of the distribution is cc
The standard deviation is cc
A useful tactic is to use the normal approximation to the Poisson so that the central line of the chart is cc and the control limits are
UCLc = c+z c and LCLc = c−z c
c-Charts c-Charts
5 – 69
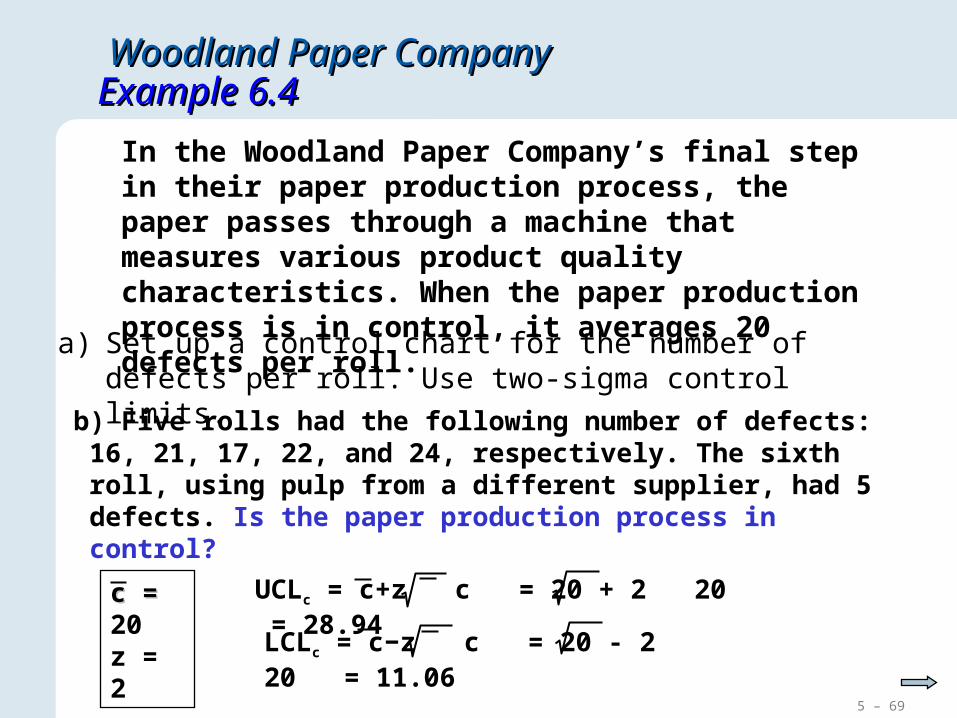
Woodland Paper CompanyWoodland Paper CompanyExample 6.4Example 6.4
In the Woodland Paper Company’s final step in their paper production process, the paper passes through a machine that measures various product quality characteristics. When the paper production process is in control, it averages 20 defects per roll.a) Set up a control chart for the number of defects per
roll. Use two-sigma control limits.
c = c = 20
z = 2
UCLc = c+z c = 20 + 2 20 = 28.94
LCLc = c−z c = 20 - 2 20 = 11.06
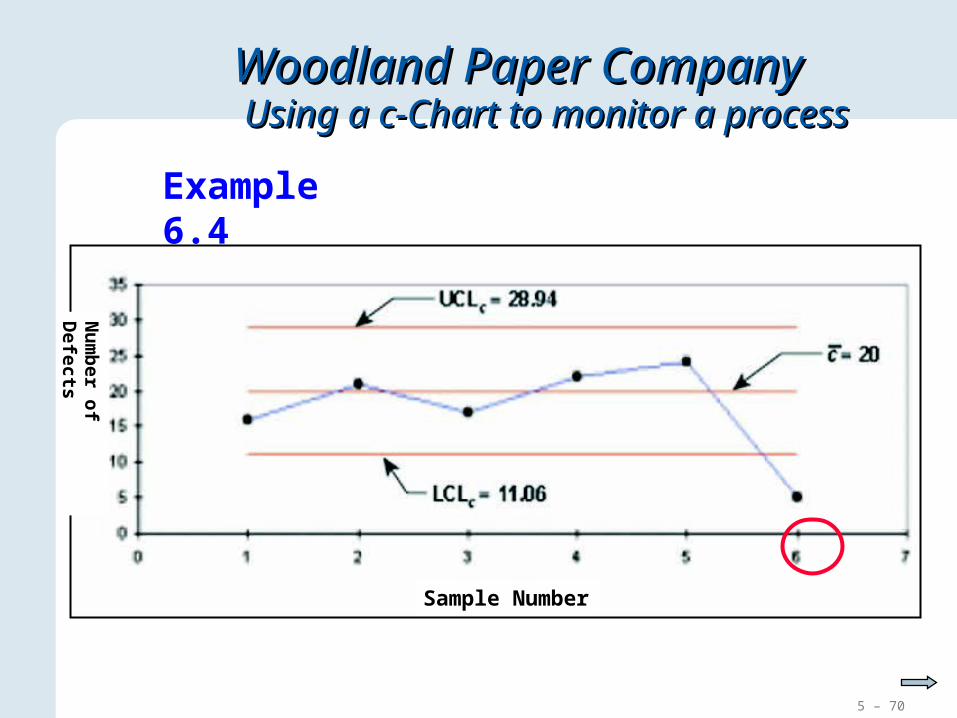
b) Five rolls had the following number of defects: 16, 21, 17, 22, and 24, respectively. The sixth roll, using pulp from a different supplier, had 5 defects. Is the paper production process in control?
5 – 70
Solver - c-Charts
Sample Number
Nu
mb
er of D
efects
Woodland Paper CompanyWoodland Paper Company Using a c-Chart to monitor a process Using a c-Chart to monitor a process
Example 6.4
5 – 71
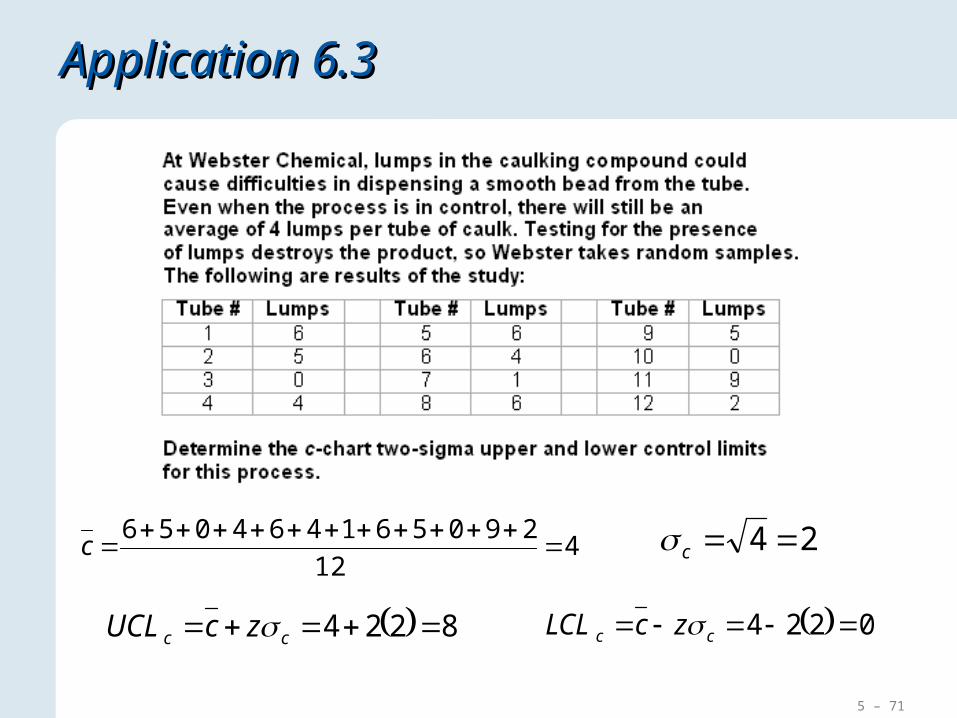
Application 6.3Application 6.3
412
290561464056
c 24 c
8224 cc zcUCL 0224 cc zcLCL
5 – 72
Process CapabilityProcess Capability
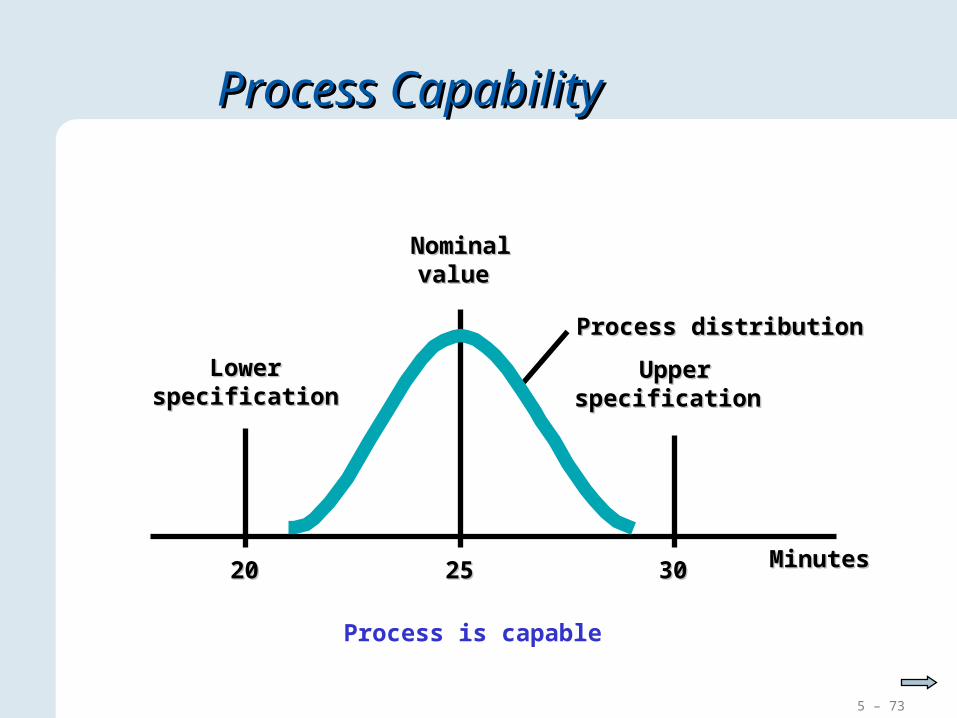
Process capability is the ability of the process to meet the design specifications for a service or product.
Nominal value is a target for design specifications.
Tolerance is an allowance above or below the nominal value.
5 – 73
2020 2525 3030 MinutesMinutes
UpperUpperspecification specification
LowerLowerspecificationspecification
NominalNominalvalue value
Process CapabilityProcess Capability
Process is capable
Process distributionProcess distribution

5 – 74
Process is not capableProcess is not capable
2020 2525 3030 MinutesMinutes
UpperUpperspecification specification
LowerLowerspecificationspecification
NominalNominalvalue value
Process distributionProcess distribution
Process CapabilityProcess Capability
5 – 75
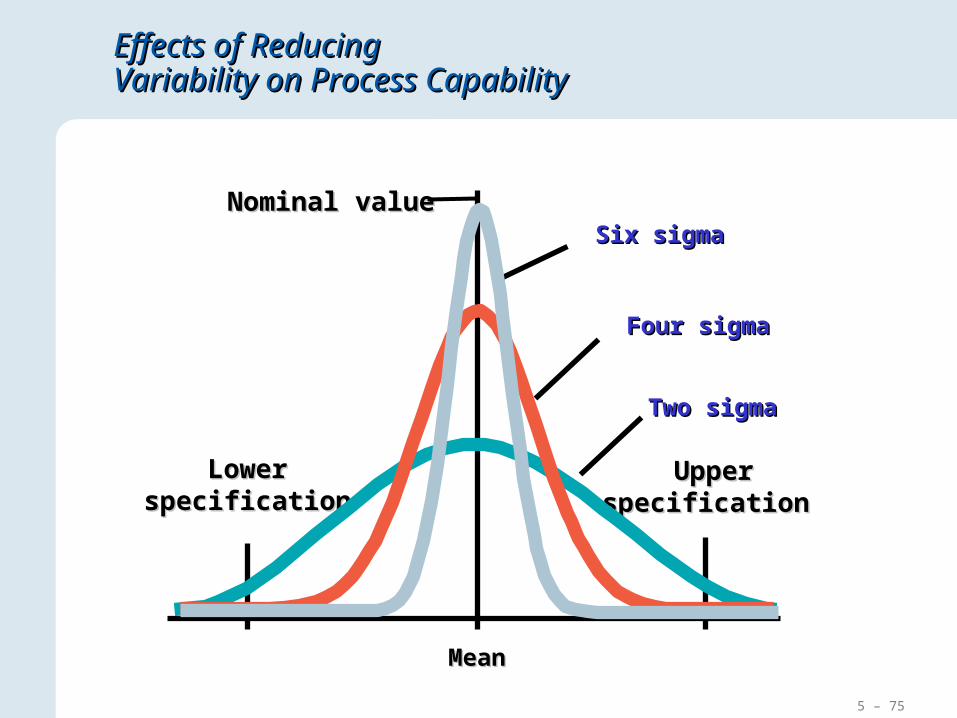
LowerLowerspecificationspecification
MeanMean
UpperUpperspecification specification
Nominal valueNominal valueSix sigmaSix sigma
Four sigmaFour sigma
Two sigmaTwo sigma
Effects of Reducing Effects of Reducing Variability on Process CapabilityVariability on Process Capability
5 – 76
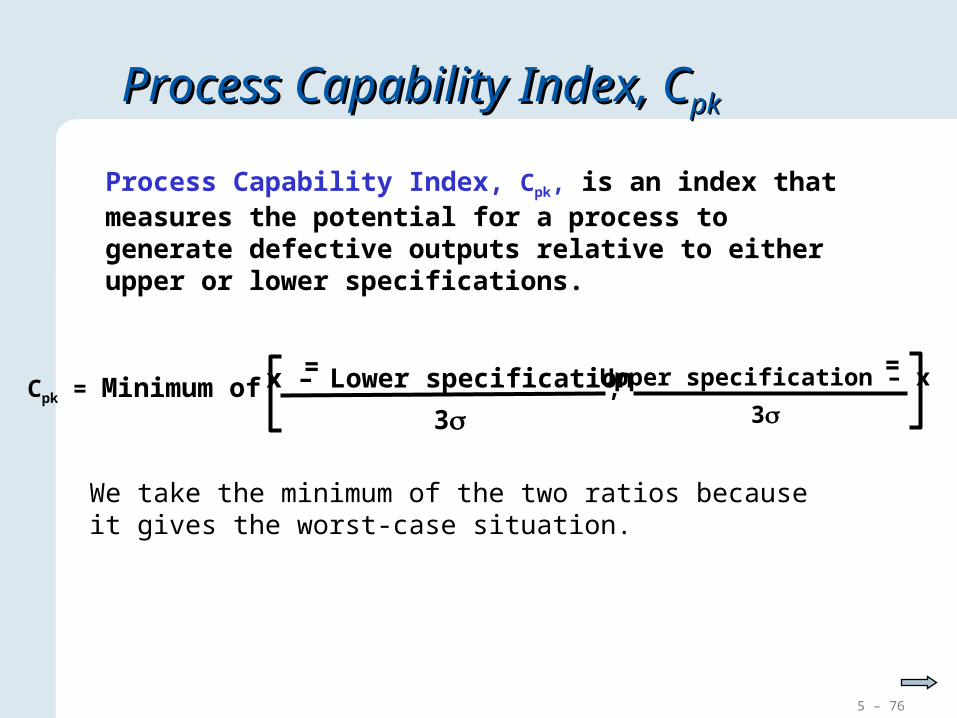
Cpk = Minimum of Upper specification – x
3x – Lower specification
3,
= =
Process Capability Index, Cpk, is an index that measures the potential for a process to generate defective outputs relative to either upper or lower specifications.
Process Capability Index, CProcess Capability Index, Cpkpk
We take the minimum of the two ratios because it gives the worst-case situation.
5 – 77
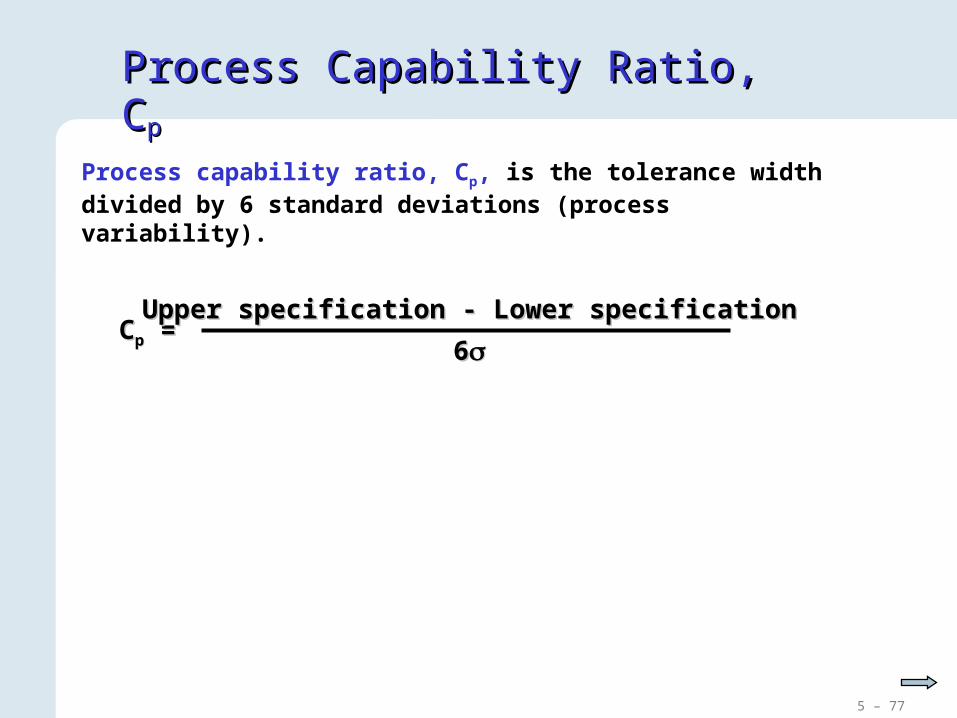
Process capability ratio, Cp, is the tolerance width divided by 6 standard deviations (process variability).
Process Capability Ratio, CProcess Capability Ratio, Cpp
CCpp = =Upper specification - Lower specificationUpper specification - Lower specification
66
5 – 78
Using Continuous Improvement to Determine Process Using Continuous Improvement to Determine Process CapabilityCapability
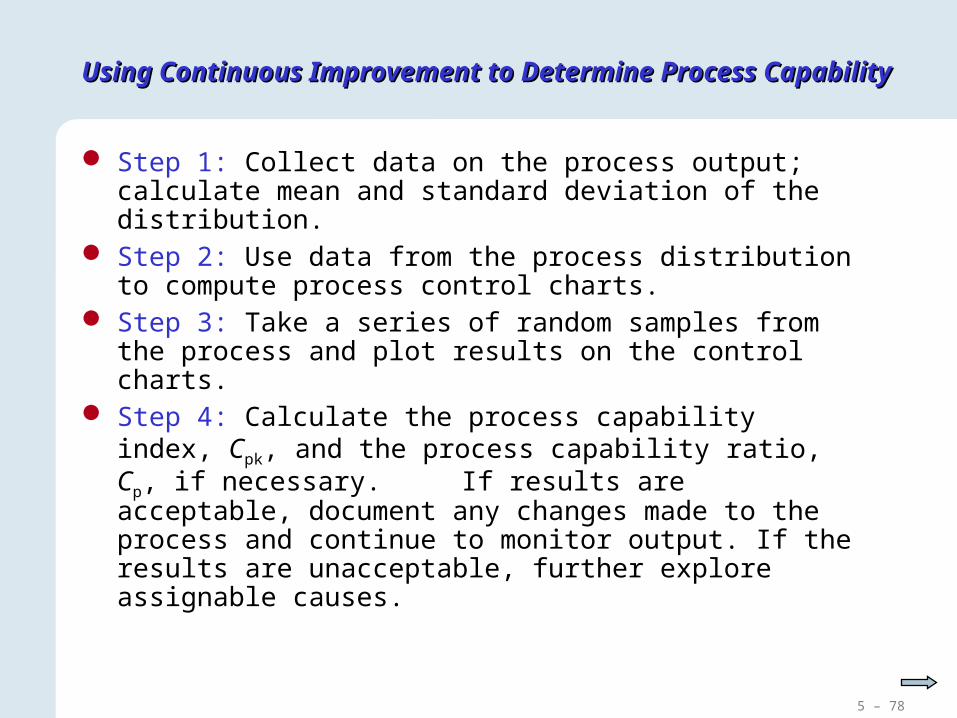
Step 1: Collect data on the process output; calculate mean and standard deviation of the distribution.
Step 2: Use data from the process distribution to compute process control charts.
Step 3: Take a series of random samples from the process and plot results on the control charts.
Step 4: Calculate the process capability index, Cpk, and the process capability ratio, Cp, if necessary. If results are acceptable, document any changes made to the process and continue to monitor output. If the results are unacceptable, further explore assignable causes.
5 – 79
Intensive Care Lab Intensive Care Lab Example 6.5Example 6.5
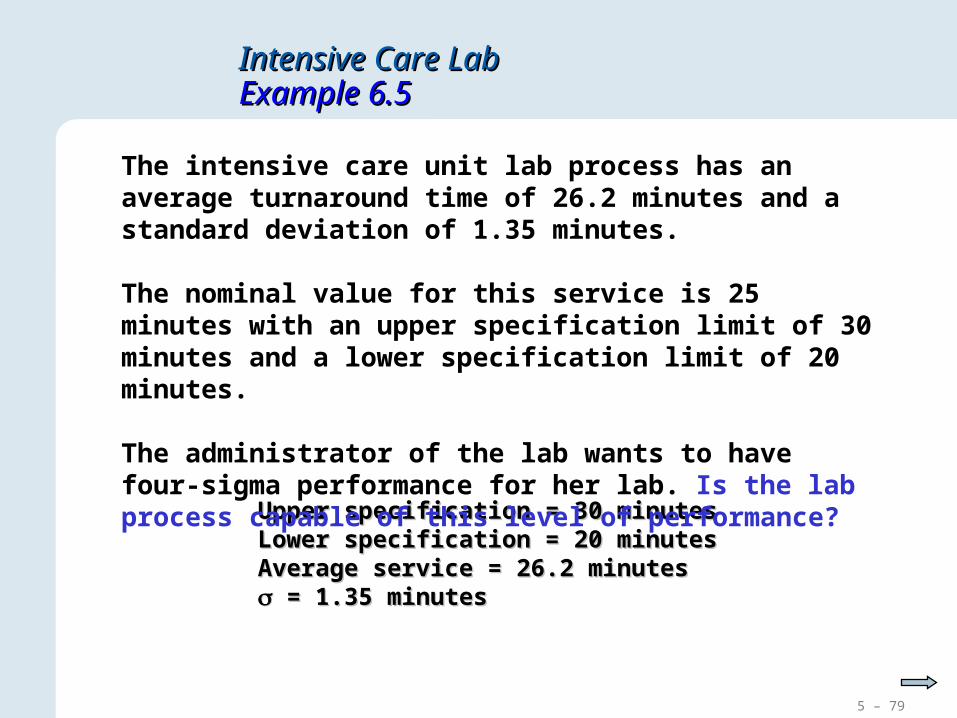
Upper specification = 30 minutesUpper specification = 30 minutesLower specification = 20 minutesLower specification = 20 minutesAverage service = 26.2 minutes Average service = 26.2 minutes = 1.35 minutes= 1.35 minutes
The intensive care unit lab process has an average turnaround time of 26.2 minutes and a standard deviation of 1.35 minutes.
The nominal value for this service is 25 minutes with an upper specification limit of 30 minutes and a lower specification limit of 20 minutes.
The administrator of the lab wants to have four-sigma performance for her lab. Is the lab process capable of this level of performance?
5 – 80
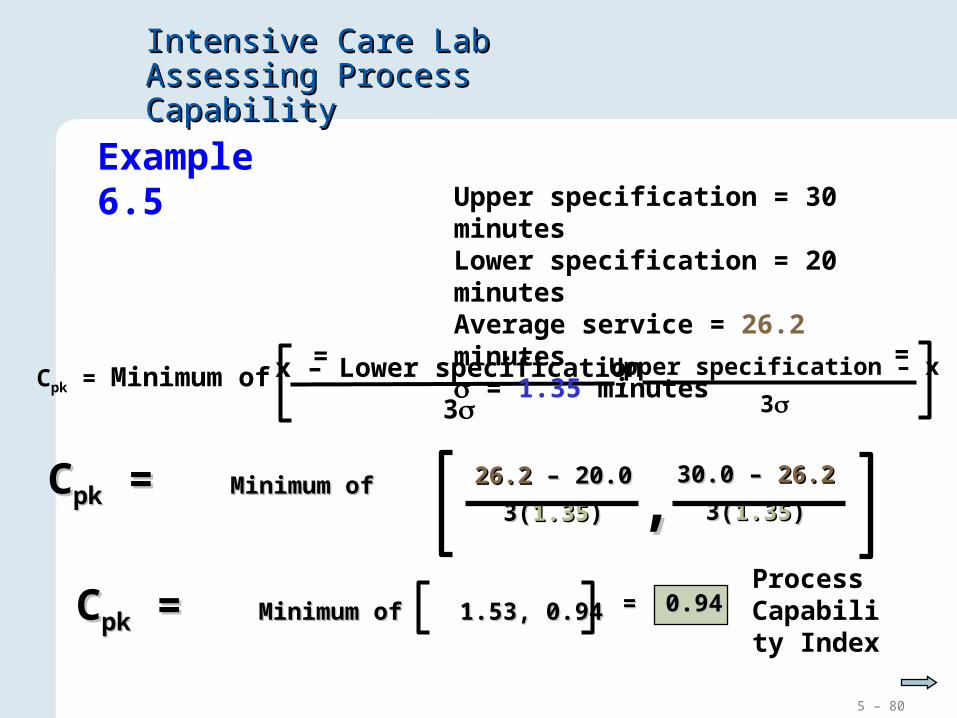
Cpk = Minimum of Upper specification – x
3x – Lower specification
3,
= =
Upper specification = 30 minutesLower specification = 20 minutesAverage service = 26.2 minutes = 1.35 minutes
Intensive Care Lab Intensive Care Lab Assessing Process CapabilityAssessing Process Capability
CCpkpk = = Minimum ofMinimum of 26.226.2 – 20.0 – 20.0
3(3(1.351.35)) ,,30.0 – 30.0 – 26.226.2
3(3(1.351.35))
CCpkpk = = Minimum of 1.53, 0.94Minimum of 1.53, 0.94 = 0.94= 0.94Process Capability Index
Example 6.5
5 – 81
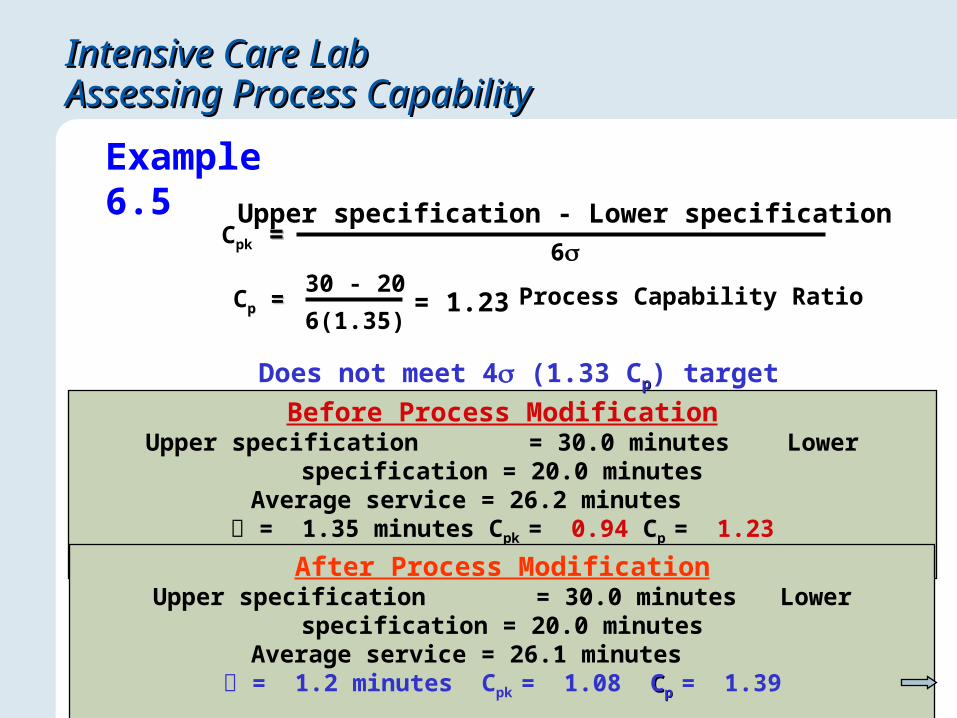
Cpk = =Upper specification - Lower specification
6
Cpp = =30 - 20
6(1.35)= 1.23 Process Capability Ratio
Before Process ModificationUpper specification = 30.0 minutes Lower specification =
20.0 minutesAverage service = 26.2 minutes
= 1.35 minutes Cpk = 0.94 CCp p = 1.23
After Process ModificationUpper specification = 30.0 minutes Lower specification =
20.0 minutesAverage service = 26.1 minutes
= 1.2 minutes Cpk = 1.08 C Cp p = 1.39
Intensive Care Lab Intensive Care Lab Assessing Process CapabilityAssessing Process Capability
Does not meet 4 (1.33 Cpp) target
Example 6.5
5 – 82
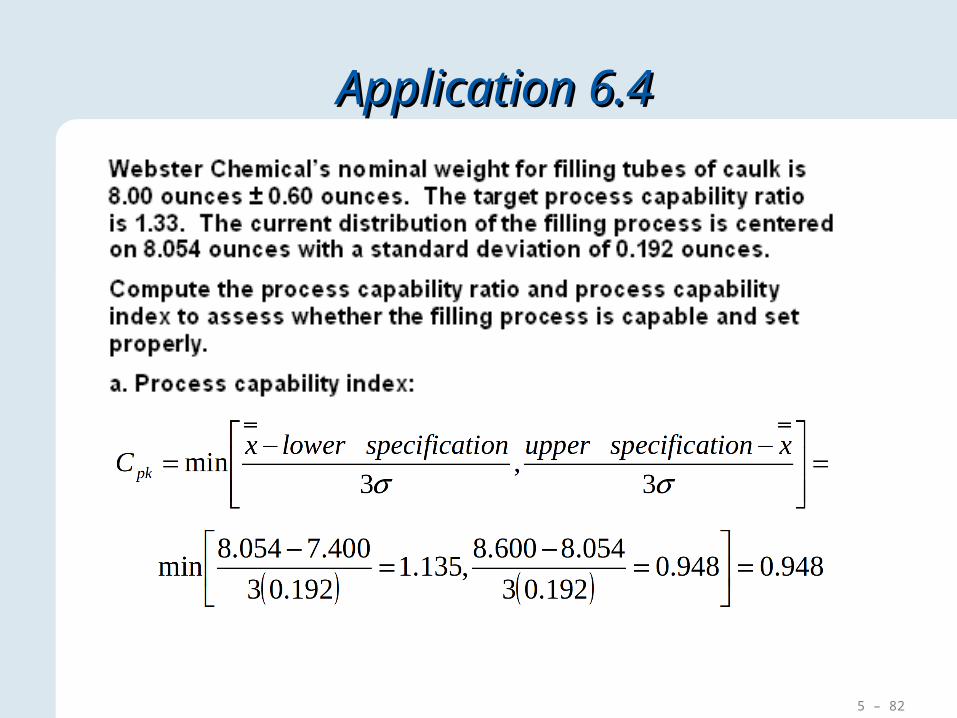
Application 6.4Application 6.4
5 – 83
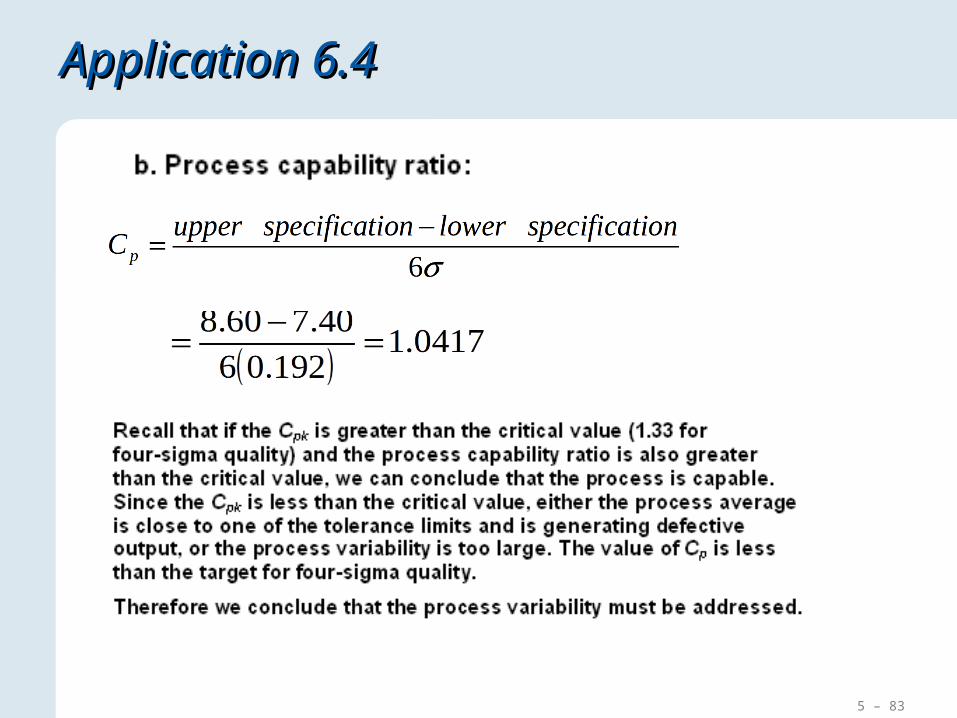
Application 6.4Application 6.4
5 – 84
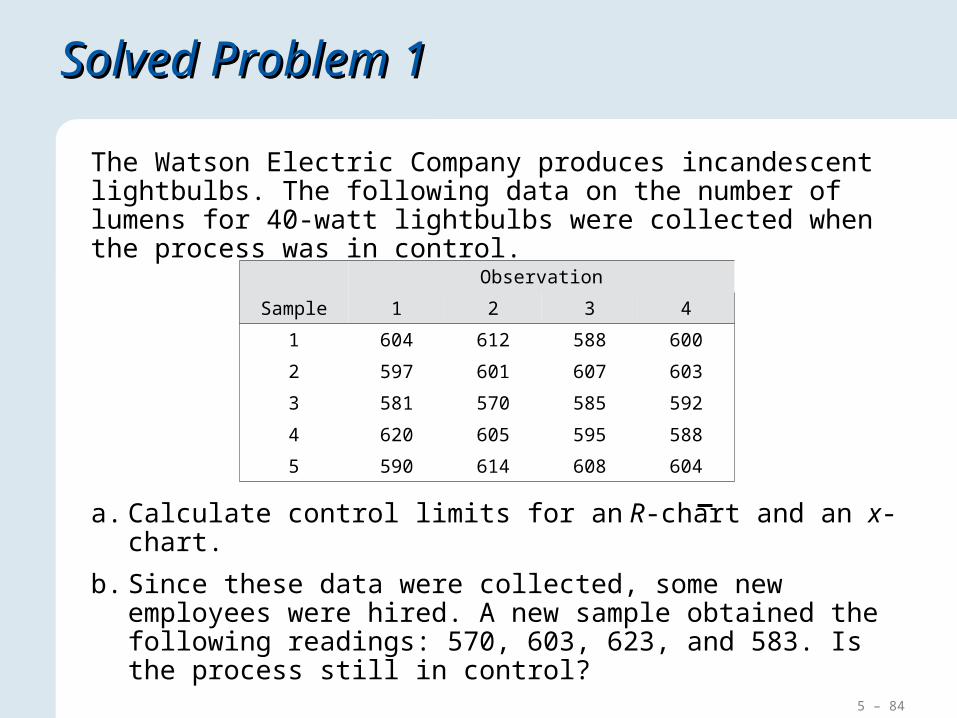
Solved Problem 1Solved Problem 1
The Watson Electric Company produces incandescent lightbulbs. The following data on the number of lumens for 40-watt lightbulbs were collected when the process was in control.
Observation
Sample 1 2 3 4
1 604 612 588 600
2 597 601 607 603
3 581 570 585 592
4 620 605 595 588
5 590 614 608 604
a. Calculate control limits for an R-chart and an x-chart.
b. Since these data were collected, some new employees were hired. A new sample obtained the following readings: 570, 603, 623, and 583. Is the process still in control?
5 – 85
Solved Problem 1Solved Problem 1
Sample R
1 601 24
2 602 10
3 582 22
4 602 32
5 604 24
Total 2,991 112
Averagex = 598.2 R = 22.4
x
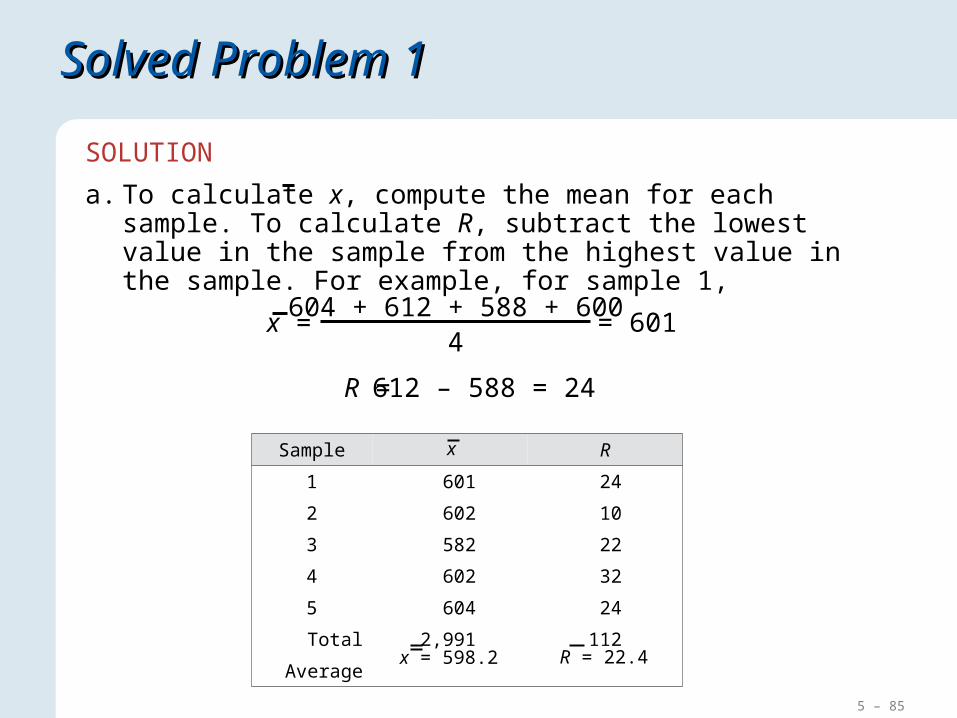
604 + 612 + 588 + 6004
= 601x =
R = 612 – 588 = 24
SOLUTION
a. To calculate x, compute the mean for each sample. To calculate R, subtract the lowest value in the sample from the highest value in the sample. For example, for sample 1,

5 – 86
Solved Problem 1Solved Problem 1
The R-chart control limits are
b. First check to see whether the variability is still in control based on the new data. The range is 53 (or 623 – 570), which is outside the UCL for the R-chart. Since the process variability is out of control, it is meaningless to test for the process average using the current estimate for R. A search for assignable causes inducing excessive variability must be conducted.
2.282(22.4) = 51.12
0(22.4) = 0
UCLR = D4R =
LCLR = D3R =
The x-chart control limits are
UCLx = x + A2R =
LCLx = x – A2R =
598.2 + 0.729(22.4) = 614.53
598.2 – 0.729(22.4) = 581.87
5 – 87
Solved Problem 2Solved Problem 2
The data processing department of the Arizona Bank has five data entry clerks. Each working day their supervisor verifies the accuracy of a random sample of 250 records. A record containing one or more errors is considered defective and must be redone. The results of the last 30 samples are shown in the table. All were checked to make sure that none was out of control.
5 – 88
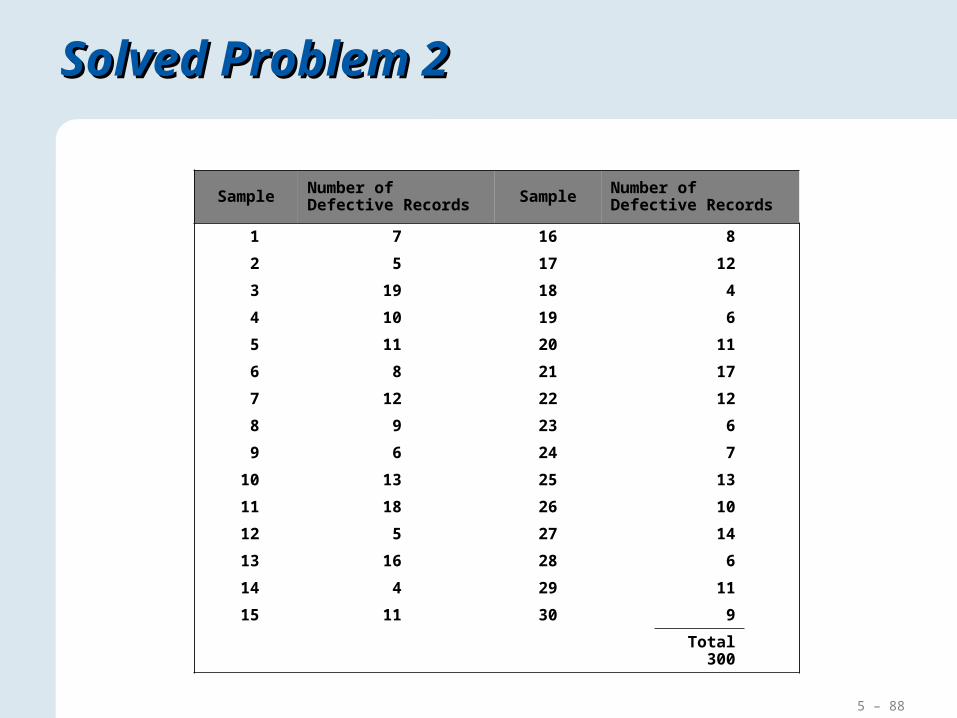
Solved Problem 2Solved Problem 2
Sample Number of Defective Records Sample Number of Defective
Records
1 7 16 8
2 5 17 12
3 19 18 4
4 10 19 6
5 11 20 11
6 8 21 17
7 12 22 12
8 9 23 6
9 6 24 7
10 13 25 13
11 18 26 10
12 5 27 14
13 16 28 6
14 4 29 11
15 11 30 9
Total 300
5 – 89
Solved Problem 2Solved Problem 2
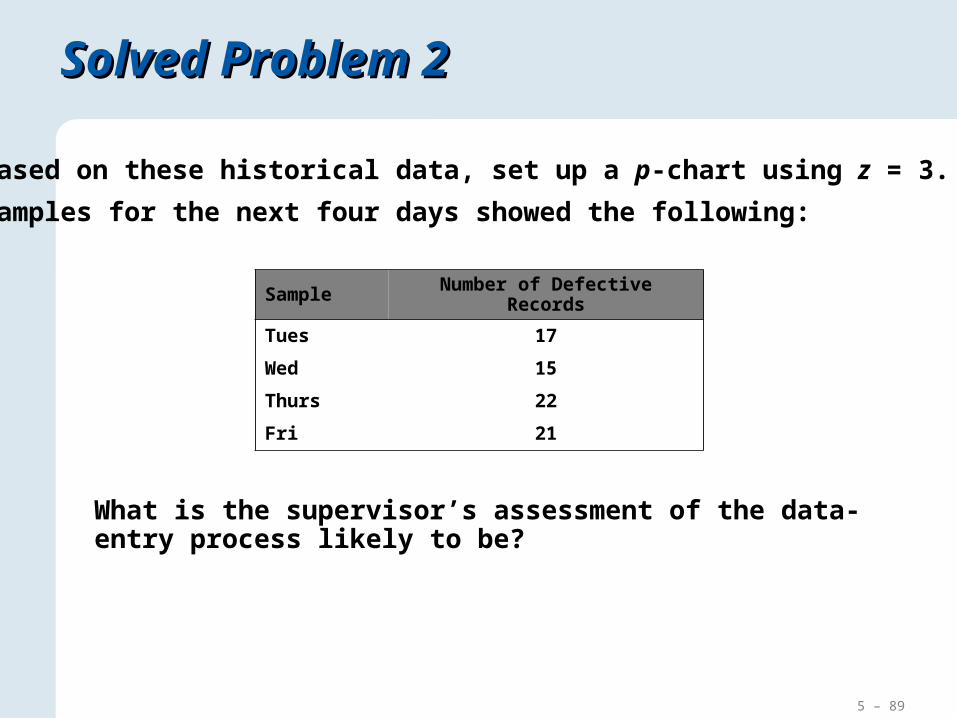
a. Based on these historical data, set up a p-chart using z = 3.
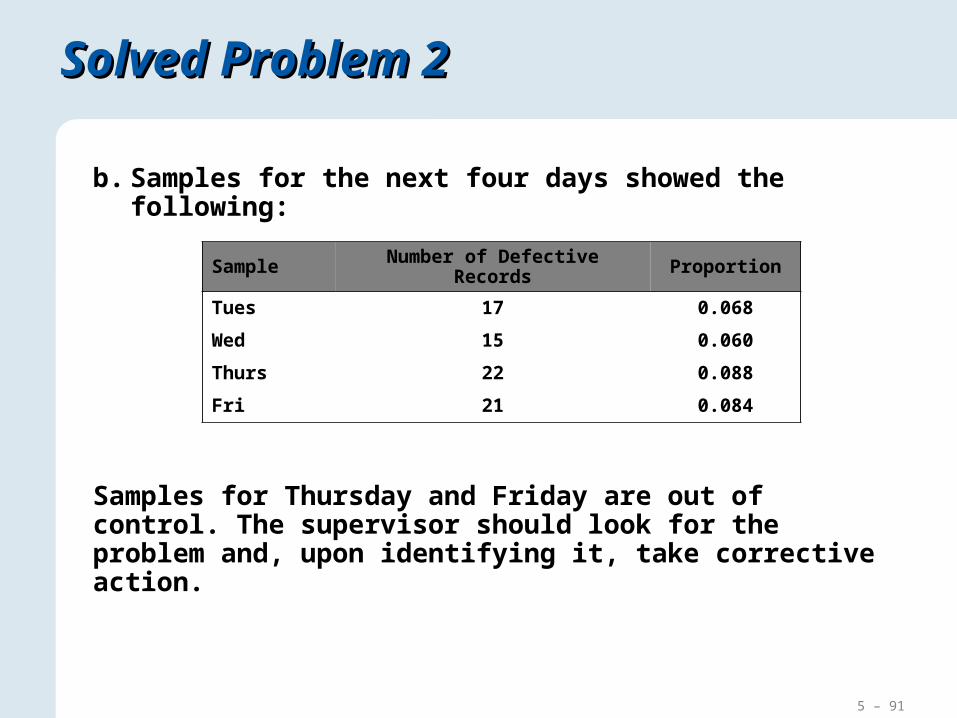
b. Samples for the next four days showed the following:
Sample Number of Defective Records
Tues 17
Wed 15
Thurs 22
Fri 21
What is the supervisor’s assessment of the data-entry process likely to be?
5 – 90
Solved Problem 2Solved Problem 2
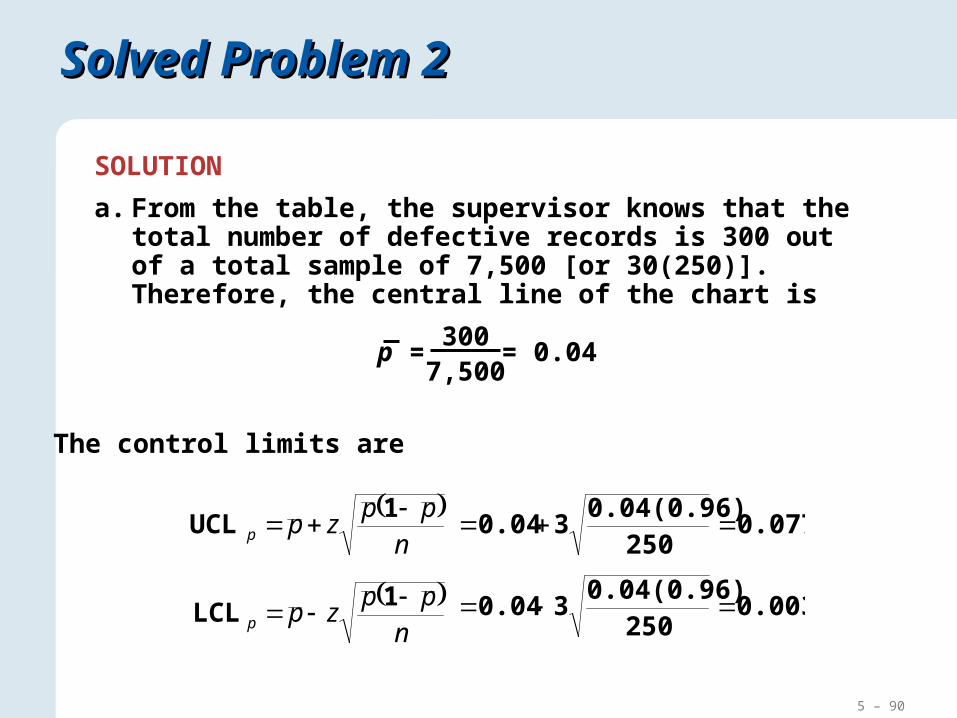
SOLUTION
a. From the table, the supervisor knows that the total number of defective records is 300 out of a total sample of 7,500 [or 30(250)]. Therefore, the central line of the chart is
= 0.04300
7,500p =
The control limits are
n
ppzpp
1UCL
n
ppzpp
1LCL
0.077250
0.04(0.96)30.04
0.003250
0.04(0.96)30.04
5 – 91
Solved Problem 2Solved Problem 2
Sample Number of Defective Records Proportion
Tues 17 0.068
Wed 15 0.060
Thurs 22 0.088
Fri 21 0.084
b. Samples for the next four days showed the following:
Samples for Thursday and Friday are out of control. The supervisor should look for the problem and, upon identifying it, take corrective action.
5 – 92
Solved Problem 3Solved Problem 3
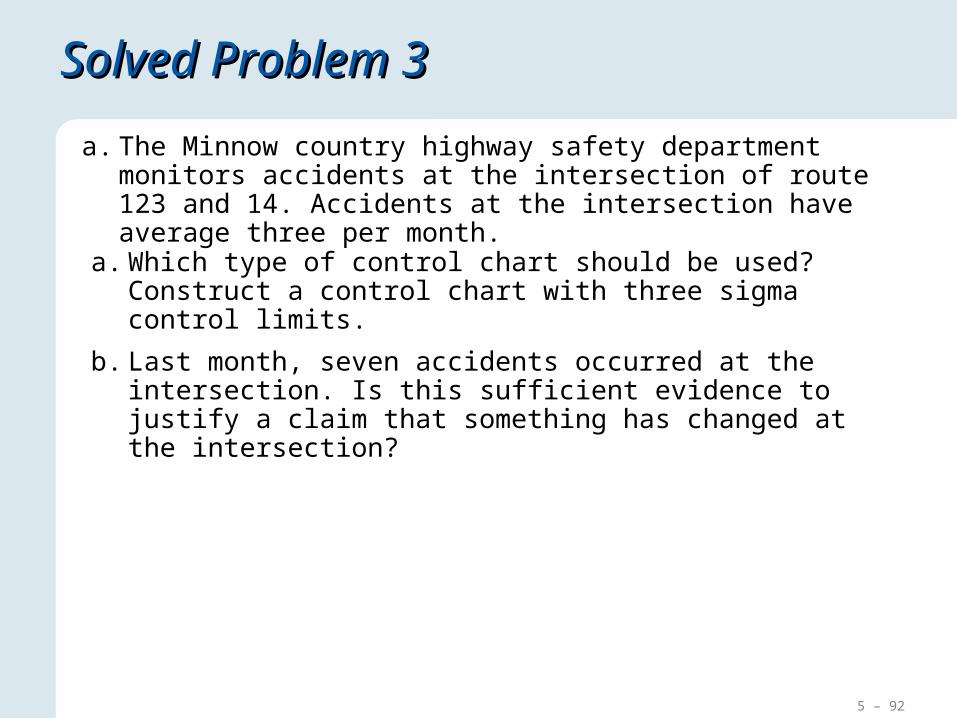
a. Which type of control chart should be used? Construct a control chart with three sigma control limits.
b. Last month, seven accidents occurred at the intersection. Is this sufficient evidence to justify a claim that something has changed at the intersection?
a. The Minnow country highway safety department monitors accidents at the intersection of route 123 and 14. Accidents at the intersection have average three per month.
5 – 93
Solved Problem 3Solved Problem 3
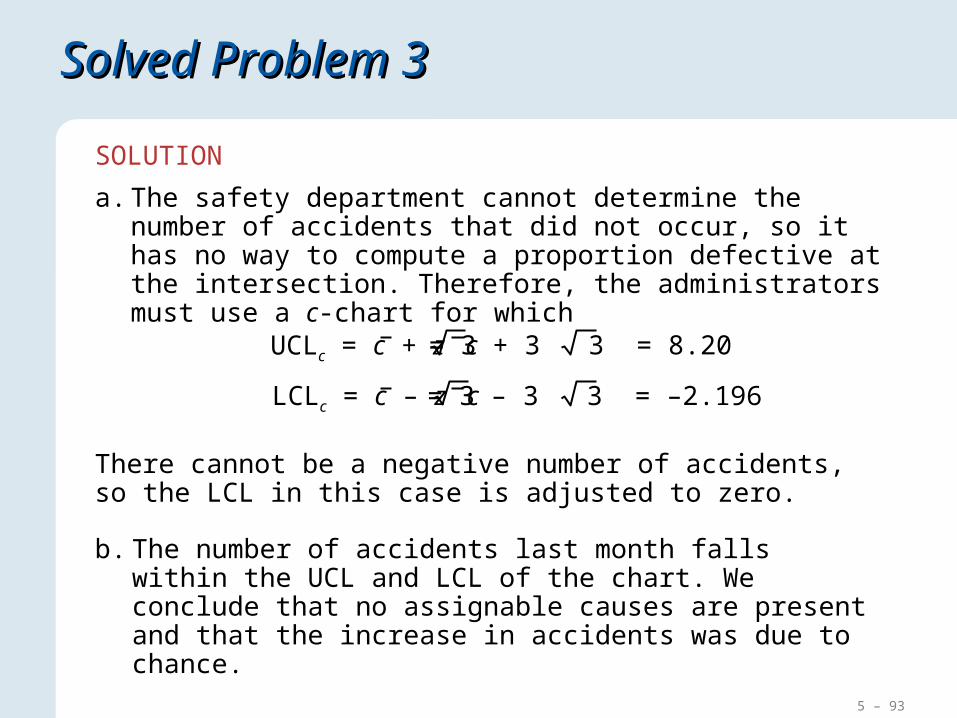
SOLUTION
a. The safety department cannot determine the number of accidents that did not occur, so it has no way to compute a proportion defective at the intersection. Therefore, the administrators must use a c-chart for which
There cannot be a negative number of accidents, so the LCL in this case is adjusted to zero.
b. The number of accidents last month falls within the UCL and LCL of the chart. We conclude that no assignable causes are present and that the increase in accidents was due to chance.
UCLc = c + z c
LCLc = c – z c
= 3 + 3 3 = 8.20
= 3 – 3 3 = –2.196
5 – 94
Solved Problem 4Solved Problem 4
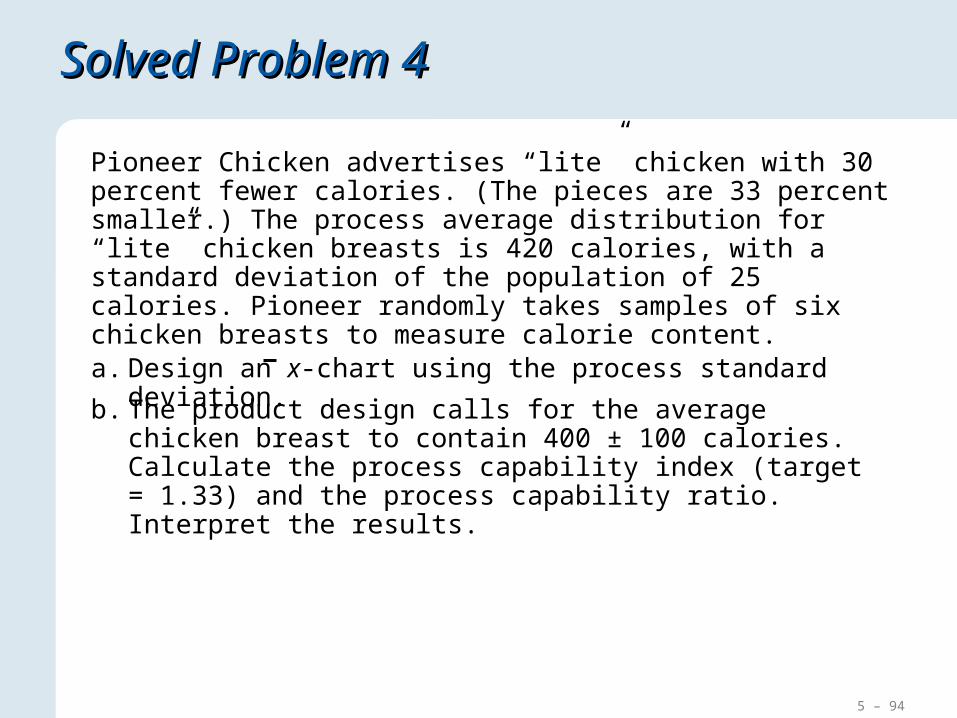
Pioneer Chicken advertises “lite” chicken with 30 percent fewer calories. (The pieces are 33 percent smaller.) The process average distribution for “lite” chicken breasts is 420 calories, with a standard deviation of the population of 25 calories. Pioneer randomly takes samples of six chicken breasts to measure calorie content.
a. Design an x-chart using the process standard deviation.
b. The product design calls for the average chicken breast to contain 400 ± 100 calories. Calculate the process capability index (target = 1.33) and the process capability ratio. Interpret the results.
5 – 95
Solved Problem 4Solved Problem 4
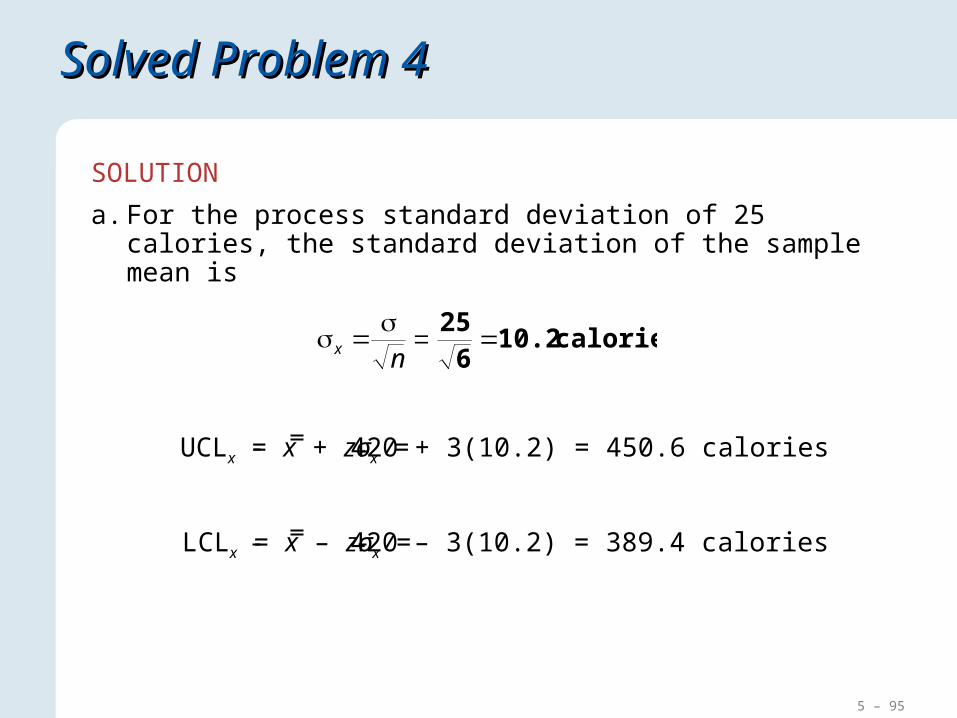
SOLUTION
a. For the process standard deviation of 25 calories, the standard deviation of the sample mean is
nx calories 10.2
625
UCLx = x + zσx =
LCLx = x – zσx =
420 + 3(10.2) = 450.6 calories
420 – 3(10.2) = 389.4 calories
5 – 96
Solved Problem 4Solved Problem 4
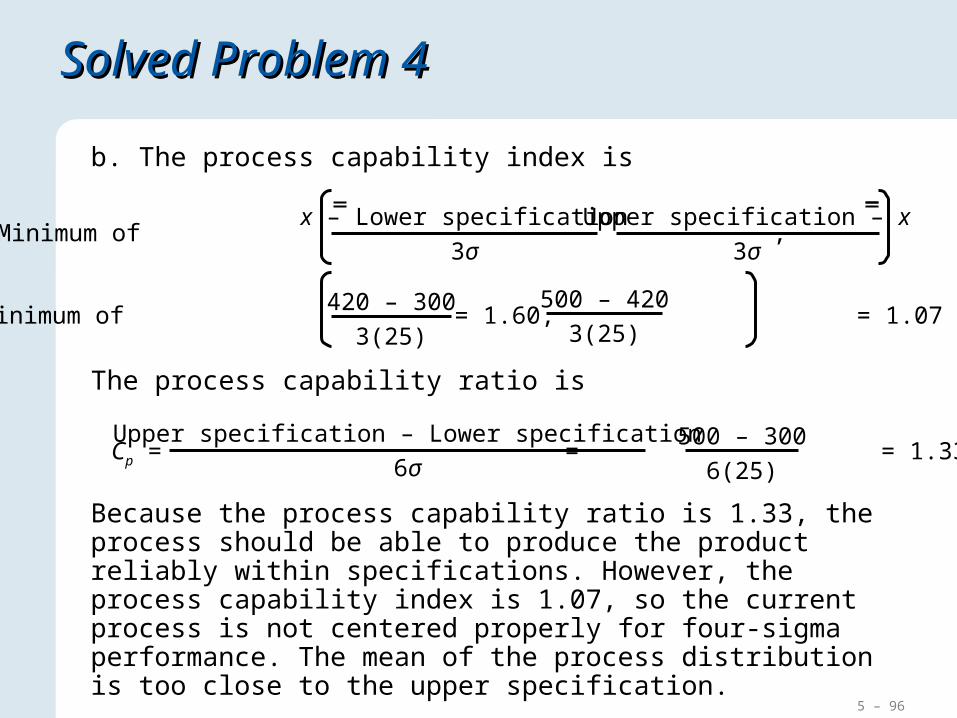
Because the process capability ratio is 1.33, the process should be able to produce the product reliably within specifications. However, the process capability index is 1.07, so the current process is not centered properly for four-sigma performance. The mean of the process distribution is too close to the upper specification.
The process capability ratio is
b. The process capability index is
Cpk = Minimum of ,x – Lower specification
3σ
Upper specification – x
3σ
= Minimum of = 1.60, = 1.07420 – 300
3(25)
500 – 420
3(25)
Cp =Upper specification – Lower specification
6σ= = 1.33
500 – 300
6(25)