Embed Size (px)
Citation preview

Beyond Heat Maps: Exploring Alternative Eye
Tracking Metrics and Analyses for UX Applications
Christian Gonzalez, M.A.
Fors Marsh GroupGeorge Mason University@UxtianG

Why Eye Tracking?

Why Eye Tracking?
• Where is attention being allocated?
• How much?
• Relative to what?
• Need a benchmark or baseline


Heat Maps
• Powerful qualitative tool
• Intuitive
• Descriptive
• Lacking inferential qualities
• Difficult to make quantitative comparisons


Comparing AOIs

Comparing AOIs
1. Without tasks or goals users still produce fixations
2. Larger AOIs will attract more fixations by chance
3. More central AOIs will attract more fixations by chance
Assumptions:

Assumptions:
Comparing AOIs
1. Without tasks or goals users still produce fixations
2. Larger AOIs will attract more fixations by chance
3. More central AOIs will attract more fixations by chance

Area Weighting

Area Weighting

Area Weighting
• Assume each pixel has a 1/N pixels chance of fixation when no task is present
• How many fixations would we expect in any particular AOI by chance?
• Expected fixation count = (%of total pixels)*(N total fixations)
• Observed fixation count = N fixations in AOI


Unweighted Comparison

Area Weighted Comparison
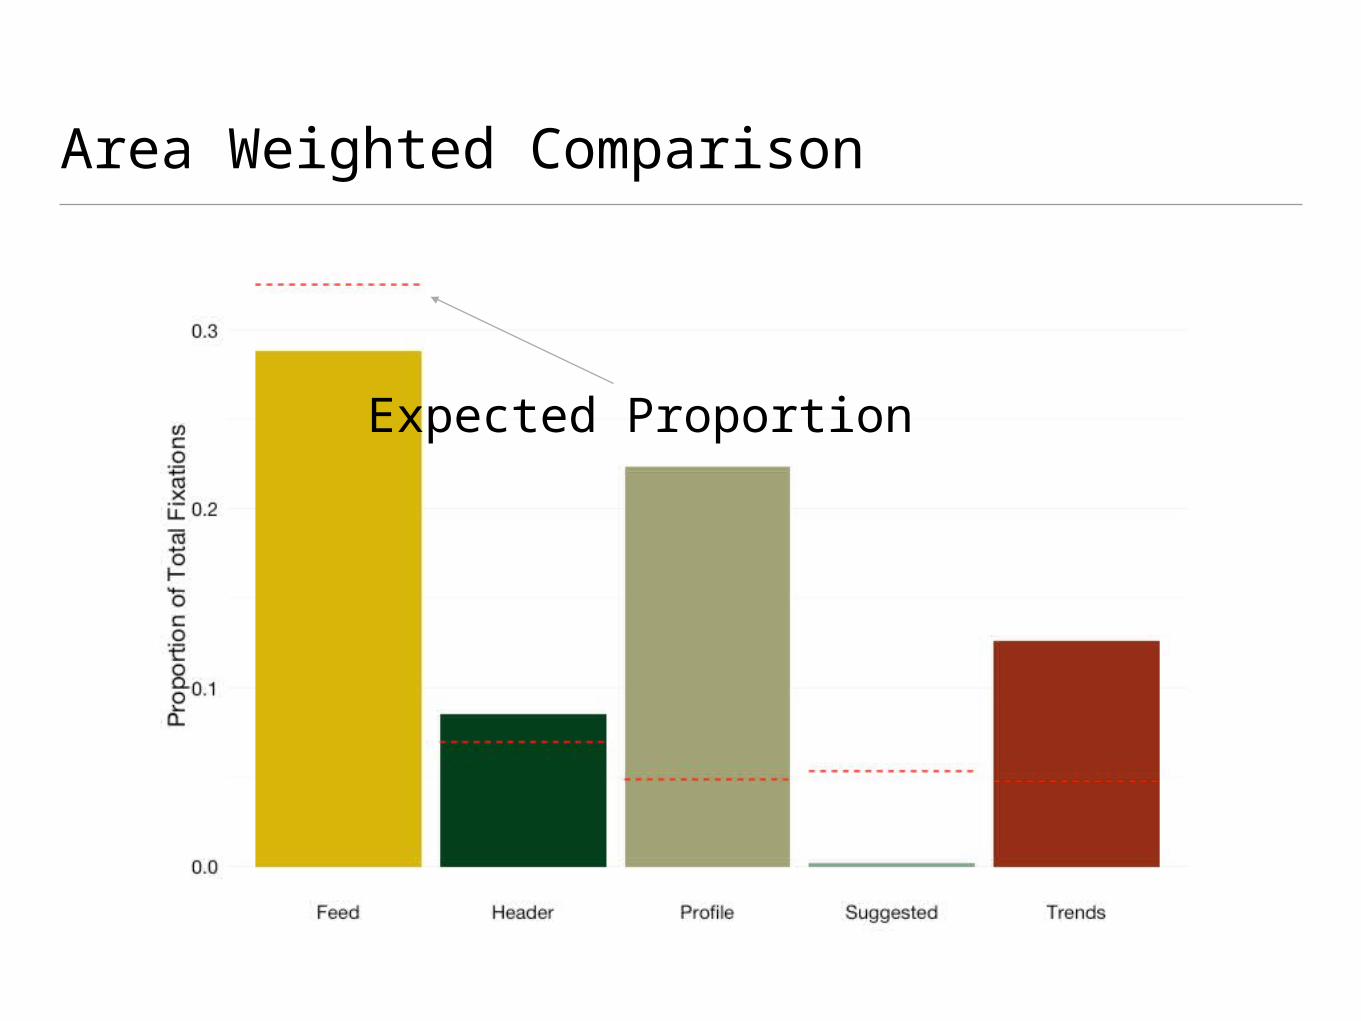
Area Weighted Comparison
Expected Proportion

Area Weighted Comparison
Observed Proportion

Area Weighted Comparison
Average Upper/Lo
wer CI

Area Weighting
• Bigger AOIs can get a disproportionate amount of attention just because they’re bigger
• Computing expected fixation proportions allows for:
• Inferences within a single AOI
• Between AOIs

Assumptions:
Comparing AOIs
1. Without tasks or goals users still produce fixations
2. Larger AOIs will attract more fixations by chance
3. More central AOIs will attract more fixations by chance

Centrality Weighting

Centrality Weighting
• “Observers show a marked tendency to fixate the center of the screen when viewing scenes on computer monitors” (Tatler, 2007)
• AOIs that are more centrally located therefore have a higher likelihood of being fixated on by chance
• How can we correct for this?
Tatler, B. W. (2007) The central fixation bias in scene viewing: Selecting an optimal viewing position independently of motor biases and image feature distributions. Journal of Vision, 7(14), 4.


Centrality Weighting
Euclidean Distance
0,0

Centrality Weighting
• Compute sum total Euclidean distance of each pixel to the origin within a given AOI
• Compute centrality weight by dividing that by sum total Euclidean distance of every pixel in the image from the origin
• Divide proportion estimates by centrality

Area and Centrality Weighted Comparison

Centrality Weighting
• Bigger, centrally located AOIs need a lot more fixations to appear meaningful
• Increased differentiation between AOIs

Great for Static, but Not Dynamic Designs
• Does not apply to gaze patterns or temporal analysis
• Difficult to compute centrality and area with video data or scrolling websites
• Data must be post-processed
• Centrality weighting can be somewhat computationally intensive

Getting More from the Data
• We can make stronger inferences with the same data
• Controlling for area and centrality allows for accurate comparisons between and within AOIs
• Provides greater correspondence between heat maps and quantitative data

Future Directions
• Bayesian approaches
• Use centrality, salience as prior probabilities of fixation
• Non-linear centrality calculations
• Area and centrality weighted heat maps

Beyond Heat Maps: Exploring Alternative Eye
Tracking Metrics and Analyses for UX Applications
Christian Gonzalez, M.A.
Fors Marsh GroupGeorge Mason University@UxtianG


![Current Trends and Challenges in User Experience ... · methods [11]. It is imagined that classification of UX qualities that can assist for choosing UX me thods and metrics, will](https://img.pdfslide.net/doc/110x75/605af36c3f340c29a6713cf8/current-trends-and-challenges-in-user-experience-methods-11-it-is-imagined.jpg)


![[HCI] Week 11. UX Goals and Metrics I](https://img.pdfslide.net/doc/110x75/58f3795d1a28ab346c8b45db/hci-week-11-ux-goals-and-metrics-i-58f765651fd75.jpg)
![[HCI Lab] Week 5 UX Goals and Metrics](https://img.pdfslide.net/doc/110x75/55a781ab1a28ab333e8b46ec/hci-lab-week-5-ux-goals-and-metrics.jpg)


![[HCI] Week 12. UX Goals and Metrics Workshop](https://img.pdfslide.net/doc/110x75/588a344b1a28abc6168b54cb/hci-week-12-ux-goals-and-metrics-workshop.jpg)


![[HCI] Week 10 UX Goals and Metrics Workshop](https://img.pdfslide.net/doc/110x75/588a35cb1a28abc6168b5809/hci-week-10-ux-goals-and-metrics-workshop.jpg)

