Embed Size (px)
Citation preview
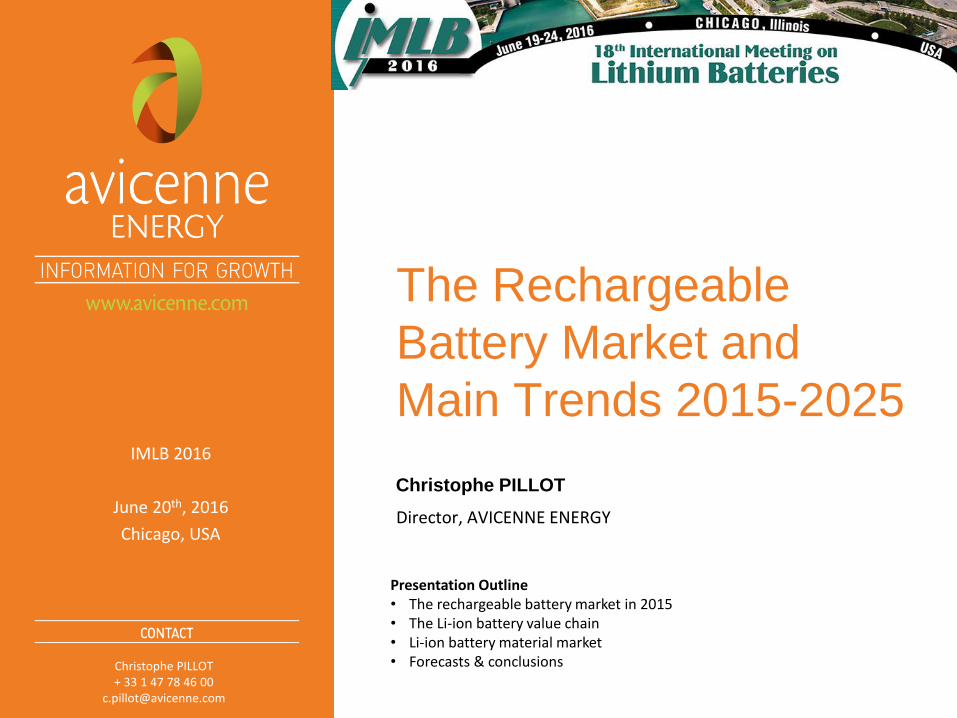
The Rechargeable
Battery Market and
Main Trends 2015-2025
Director, AVICENNE ENERGY
Christophe PILLOT
IMLB 2016
June 20th, 2016
Chicago, USA
Christophe PILLOT + 33 1 47 78 46 00
Presentation Outline • The rechargeable battery market in 2015 • The Li-ion battery value chain • Li-ion battery material market • Forecasts & conclusions
Christophe PILLOT + 33 1 47 78 46 00
June 20th, 2016 CHICAGO, USA
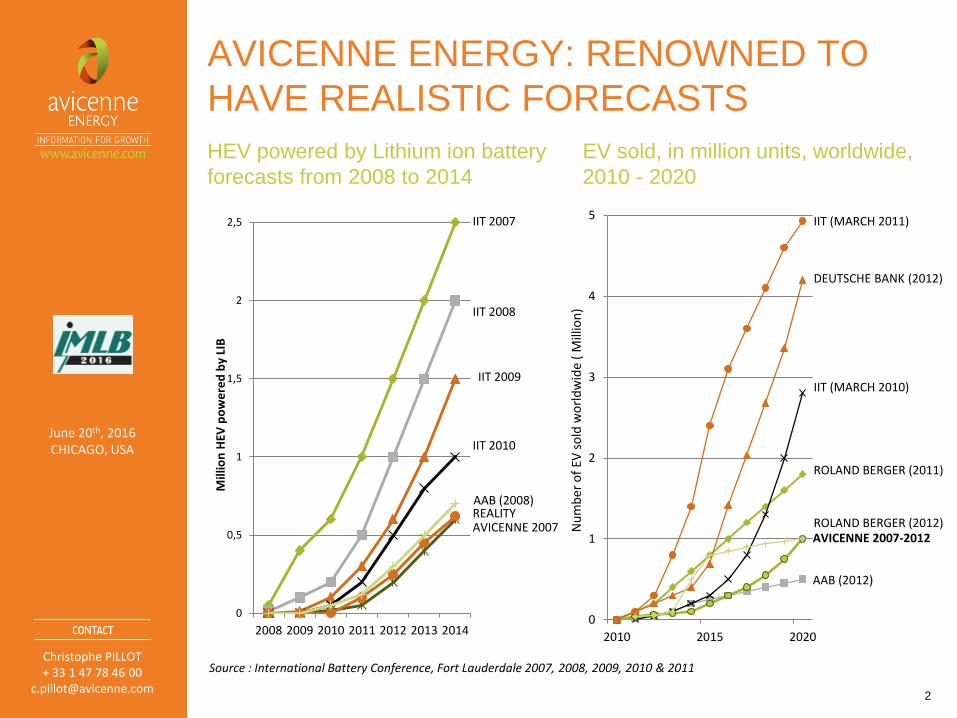
AVICENNE ENERGY: RENOWNED TO
HAVE REALISTIC FORECASTS
HEV powered by Lithium ion battery
forecasts from 2008 to 2014
EV sold, in million units, worldwide,
2010 - 2020
0
1
2
3
4
5
2010 2015 2020
Nu
mb
er o
f EV
so
ld w
orl
dw
ide
( M
illio
n)
Source : International Battery Conference, Fort Lauderdale 2007, 2008, 2009, 2010 & 2011
2
0
0,5
1
1,5
2
2,5
2008 2009 2010 2011 2012 2013 2014
Mill
ion
HEV
po
we
red
by
LIB
IIT 2007
IIT 2008
IIT 2009
IIT 2010
AVICENNE 2007 REALITY
AAB (2012)
AVICENNE 2007-2012
ROLAND BERGER (2011)
IIT (MARCH 2010)
ROLAND BERGER (2012)
DEUTSCHE BANK (2012)
IIT (MARCH 2011)
AAB (2008)
Christophe PILLOT + 33 1 47 78 46 00
June 20th, 2016 CHICAGO, USA
3
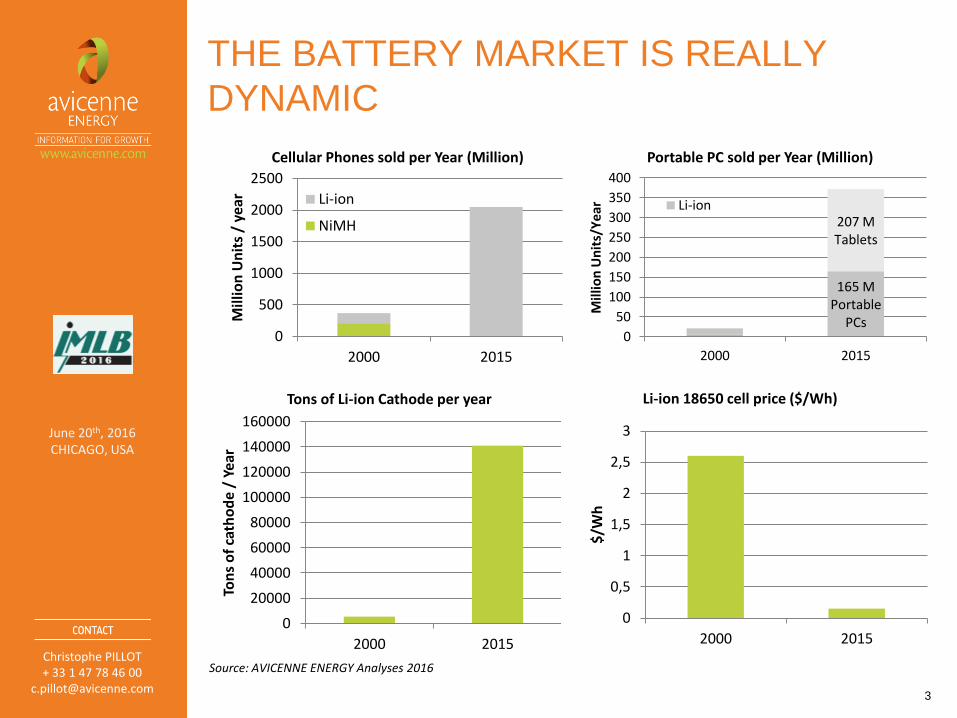
THE BATTERY MARKET IS REALLY
DYNAMIC
Source: AVICENNE ENERGY Analyses 2016
0
500
1000
1500
2000
2500
2000 2015
Mill
ion
Un
its
/ ye
ar
Cellular Phones sold per Year (Million)
Li-ion
NiMH
165 M Portable
PCs
207 M Tablets
0
50
100
150
200
250
300
350
400
2000 2015
Mill
ion
Un
its/
Ye
ar
Portable PC sold per Year (Million)
Li-ion
0
20000
40000
60000
80000
100000
120000
140000
160000
2000 2015
Ton
s o
f ca
tho
de
/ Ye
ar
Tons of Li-ion Cathode per year
0
0,5
1
1,5
2
2,5
3
2000 2015
$/W
h
Li-ion 18650 cell price ($/Wh)
Christophe PILLOT + 33 1 47 78 46 00
June 20th, 2016 CHICAGO, USA
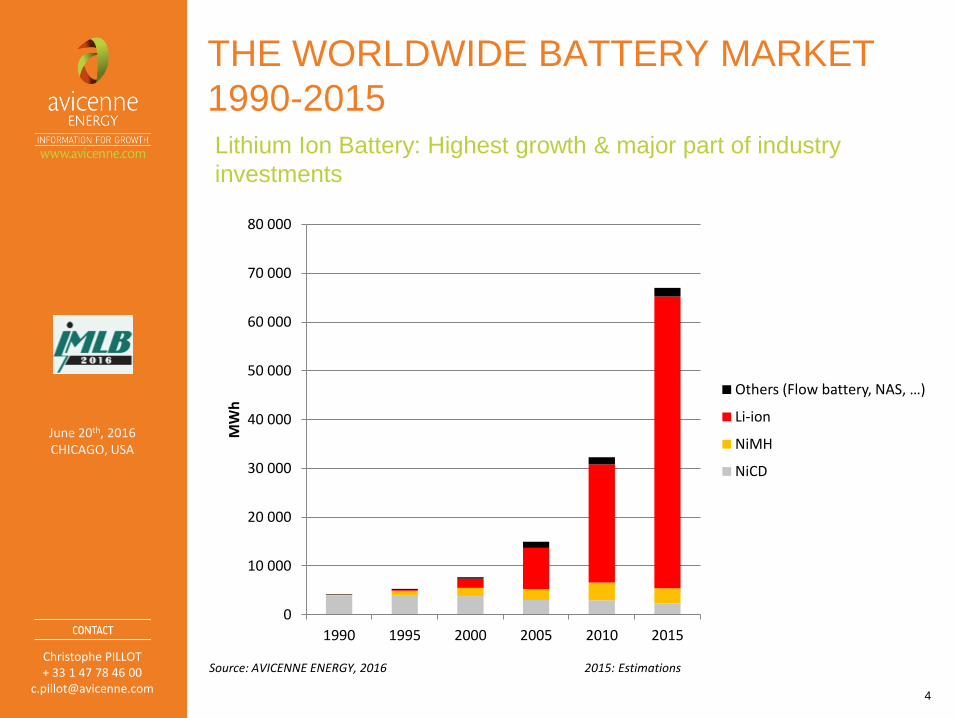
THE WORLDWIDE BATTERY MARKET
1990-2015
0
10 000
20 000
30 000
40 000
50 000
60 000
70 000
80 000
1990 1995 2000 2005 2010 2015
MW
h Others (Flow battery, NAS, …)
Li-ion
NiMH
NiCD
4
2015: Estimations Source: AVICENNE ENERGY, 2016
Lithium Ion Battery: Highest growth & major part of industry
investments
Christophe PILLOT + 33 1 47 78 46 00
June 20th, 2016 CHICAGO, USA
0
50 000
100 000
150 000
200 000
250 000
300 000
350 000
400 000
450 000
19
90
19
95
20
00
20
05
20
10
20
15
MW
h
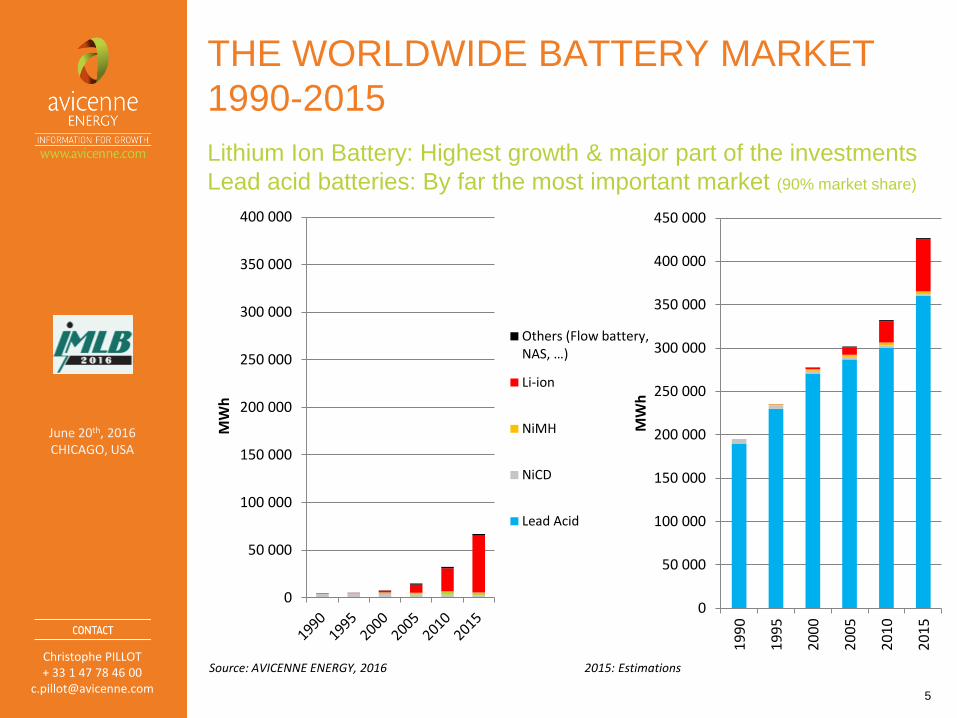
Others (Flow battery, NAS, …)
Li-ion
NiMH
NiCD
Lead Acid
0
50 000
100 000
150 000
200 000
250 000
300 000
350 000
400 000M
Wh
THE WORLDWIDE BATTERY MARKET
1990-2015
Lithium Ion Battery: Highest growth & major part of the investments
Lead acid batteries: By far the most important market (90% market share)
5
Source: AVICENNE ENERGY, 2016
2015: Estimations
Christophe PILLOT + 33 1 47 78 46 00
June 20th, 2016 CHICAGO, USA
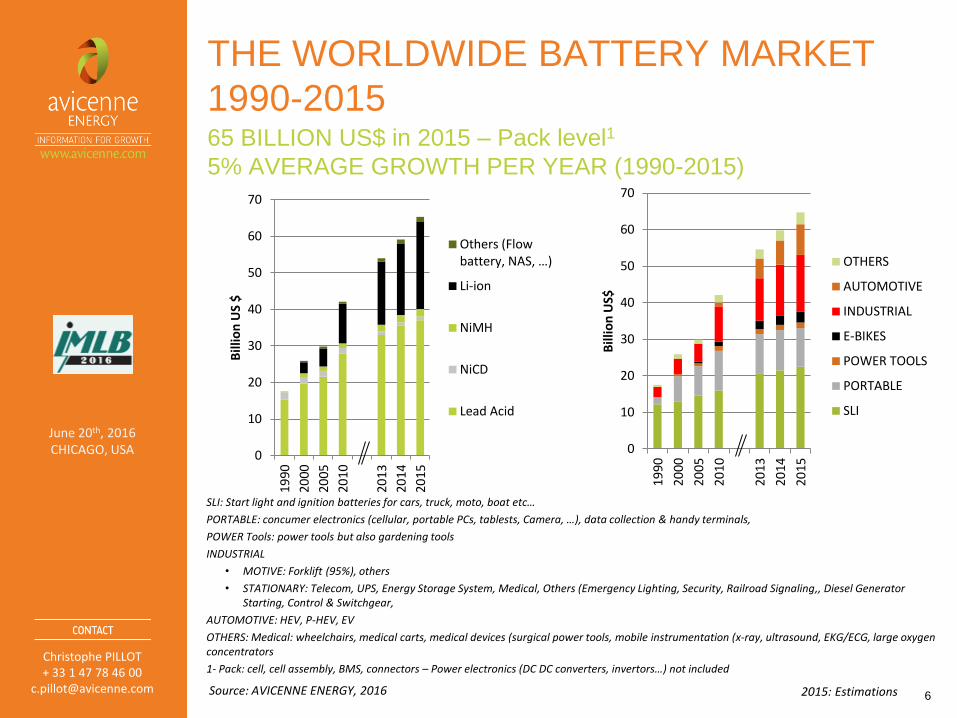
THE WORLDWIDE BATTERY MARKET
1990-2015
0
10
20
30
40
50
60
70
19
90
20
00
20
05
2010
20
13
20
14
20
15
Bill
ion
US
$
Others (Flow battery, NAS, …)
Li-ion
NiMH
NiCD
Lead Acid
65 BILLION US$ in 2015 – Pack level1
5% AVERAGE GROWTH PER YEAR (1990-2015)
6
0
10
20
30
40
50
60
70
19
90
20
00
20
05
20
10
2013
20
14
20
15
Bill
ion
US$
OTHERS
AUTOMOTIVE
INDUSTRIAL
E-BIKES
POWER TOOLS
PORTABLE
SLI
Source: AVICENNE ENERGY, 2016
SLI: Start light and ignition batteries for cars, truck, moto, boat etc…
PORTABLE: concumer electronics (cellular, portable PCs, tablests, Camera, …), data collection & handy terminals,
POWER Tools: power tools but also gardening tools
INDUSTRIAL
• MOTIVE: Forklift (95%), others
• STATIONARY: Telecom, UPS, Energy Storage System, Medical, Others (Emergency Lighting, Security, Railroad Signaling,, Diesel Generator Starting, Control & Switchgear,
AUTOMOTIVE: HEV, P-HEV, EV
OTHERS: Medical: wheelchairs, medical carts, medical devices (surgical power tools, mobile instrumentation (x-ray, ultrasound, EKG/ECG, large oxygen concentrators
1- Pack: cell, cell assembly, BMS, connectors – Power electronics (DC DC converters, invertors…) not included
2015: Estimations
Christophe PILLOT + 33 1 47 78 46 00
June 20th, 2016 CHICAGO, USA
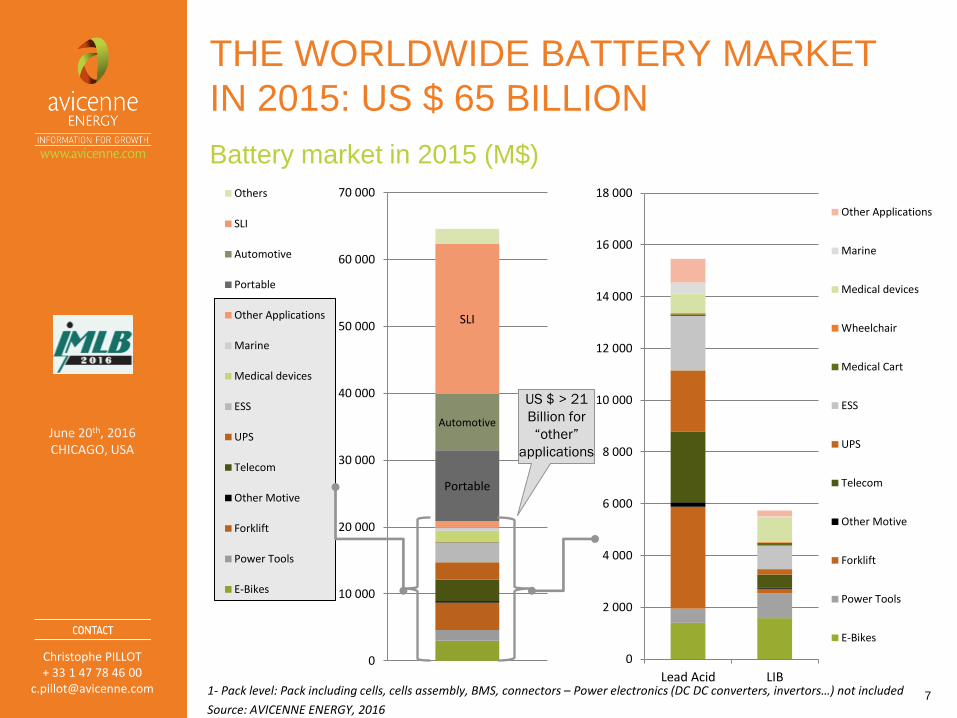
THE WORLDWIDE BATTERY MARKET
IN 2015: US $ 65 BILLION
Portable
Automotive
SLI
0
10 000
20 000
30 000
40 000
50 000
60 000
70 000Others
SLI
Automotive
Portable
Other Applications
Marine
Medical devices
ESS
UPS
Telecom
Other Motive
Forklift
Power Tools
E-Bikes
7
Battery market in 2015 (M$)
1- Pack level: Pack including cells, cells assembly, BMS, connectors – Power electronics (DC DC converters, invertors…) not included
Source: AVICENNE ENERGY, 2016
0
2 000
4 000
6 000
8 000
10 000
12 000
14 000
16 000
18 000
Lead Acid LIB
Other Applications
Marine
Medical devices
Wheelchair
Medical Cart
ESS
UPS
Telecom
Other Motive
Forklift
Power Tools
E-Bikes
US $ > 21
Billion for
“other”
applications
Christophe PILLOT + 33 1 47 78 46 00
June 20th, 2016 CHICAGO, USA
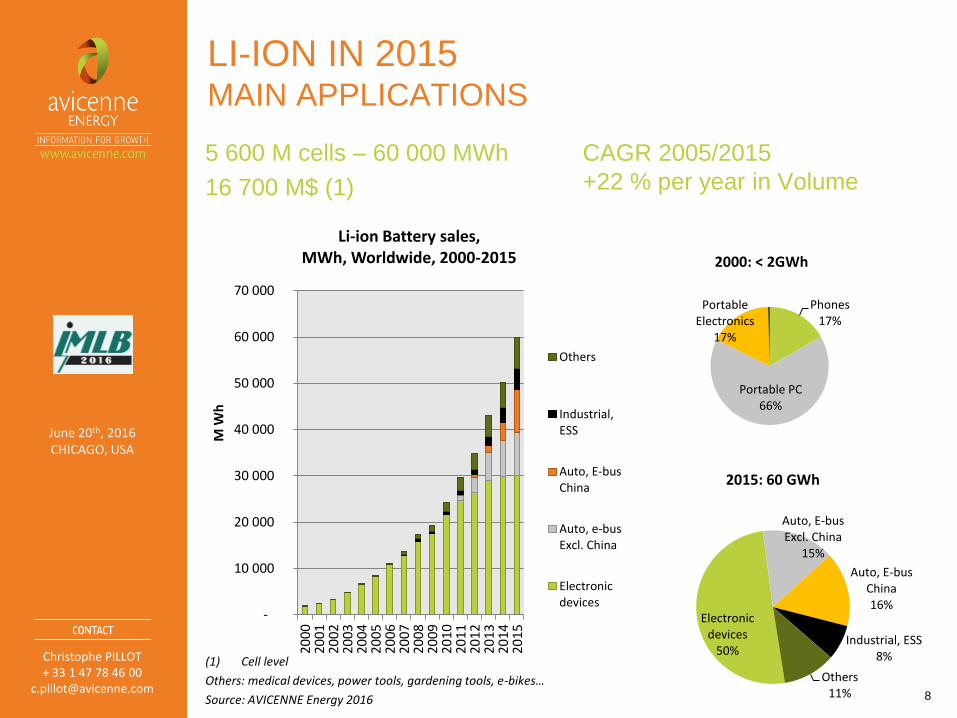
LI-ION IN 2015 MAIN APPLICATIONS
8
(1) Cell level
Others: medical devices, power tools, gardening tools, e-bikes…
Source: AVICENNE Energy 2016
5 600 M cells – 60 000 MWh
16 700 M$ (1)
CAGR 2005/2015
+22 % per year in Volume
-
10 000
20 000
30 000
40 000
50 000
60 000
70 00020
00
200
120
02
200
320
04
200
520
06
200
720
08
200
920
10
201
120
12
201
320
14
201
5
M W
h
Li-ion Battery sales, MWh, Worldwide, 2000-2015
Others
Industrial,ESS
Auto, E-busChina
Auto, e-busExcl. China
Electronicdevices
Phones 17%
Portable PC 66%
Portable Electronics
17%
2000: < 2GWh
2015: 60 GWh
Electronic devices
50%
Auto, E-bus Excl. China
15%
Auto, E-bus China 16%
Industrial, ESS 8%
Others 11%
Christophe PILLOT + 33 1 47 78 46 00
June 20th, 2016 CHICAGO, USA
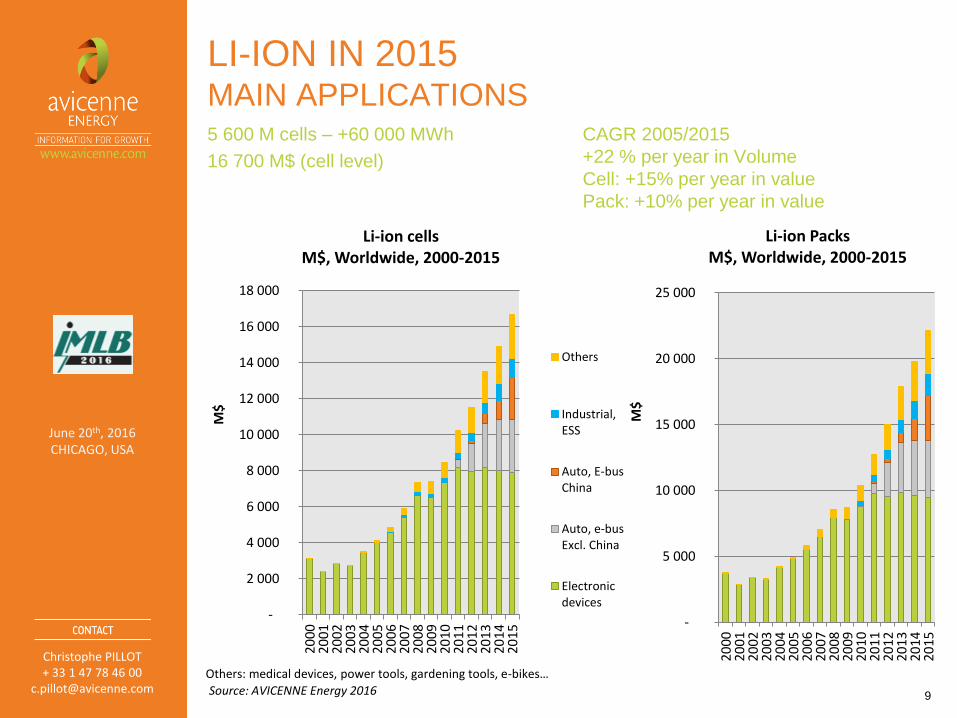
LI-ION IN 2015 MAIN APPLICATIONS
CAGR 2005/2015
+22 % per year in Volume
Cell: +15% per year in value
Pack: +10% per year in value
9
5 600 M cells – +60 000 MWh
16 700 M$ (cell level)
Source: AVICENNE Energy 2016
-
2 000
4 000
6 000
8 000
10 000
12 000
14 000
16 000
18 000
200
020
01
200
220
03
200
420
05
200
620
07
200
820
09
201
020
11
201
220
13
201
420
15
M$
Li-ion cells M$, Worldwide, 2000-2015
Others
Industrial,ESS
Auto, E-busChina
Auto, e-busExcl. China
Electronicdevices
-
5 000
10 000
15 000
20 000
25 000
200
020
01
200
220
03
200
420
05
200
620
07
200
820
09
201
020
11
201
220
13
201
420
15
M$
Li-ion Packs M$, Worldwide, 2000-2015
Others: medical devices, power tools, gardening tools, e-bikes…
Christophe PILLOT + 33 1 47 78 46 00
June 20th, 2016 CHICAGO, USA
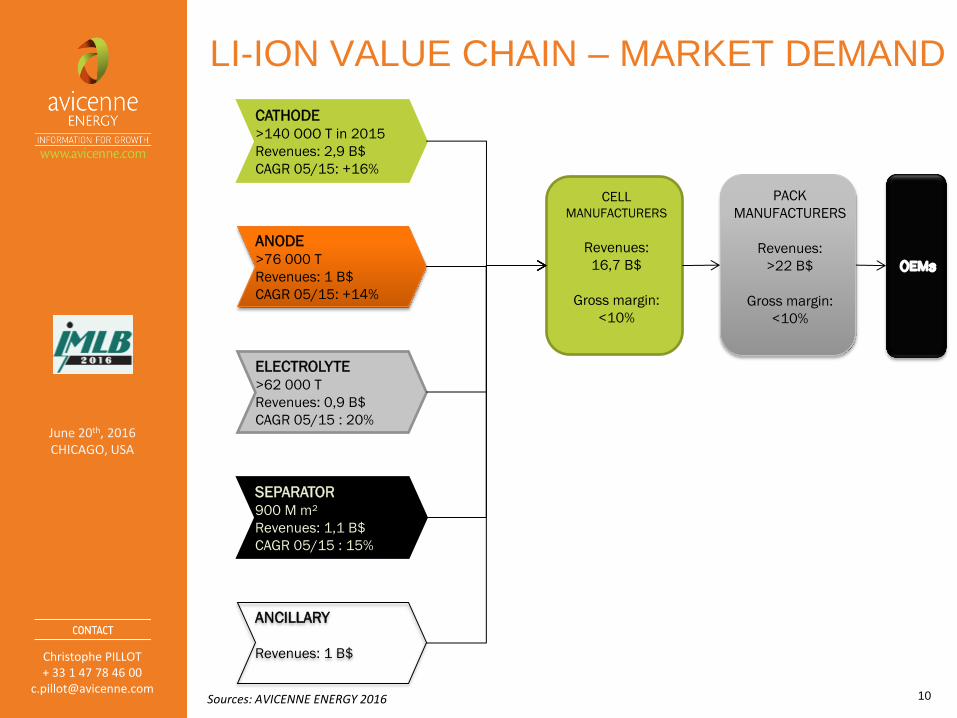
LI-ION VALUE CHAIN – MARKET DEMAND
10
CATHODE
>140 OOO T in 2015
Revenues: 2,9 B$
CAGR 05/15: +16%
ANODE
>76 000 T
Revenues: 1 B$
CAGR 05/15: +14%
ELECTROLYTE
>62 000 T
Revenues: 0,9 B$
CAGR 05/15 : 20%
SEPARATOR
900 M m²
Revenues: 1,1 B$
CAGR 05/15 : 15%
CELL
MANUFACTURERS
Revenues:
16,7 B$
Gross margin:
<10%
ANCILLARY
Revenues: 1 B$
PACK
MANUFACTURERS
Revenues:
>22 B$
Gross margin:
<10%
Sources: AVICENNE ENERGY 2016
Christophe PILLOT + 33 1 47 78 46 00
June 20th, 2016 CHICAGO, USA
NEW ENTRANTS ON THE FIELD:
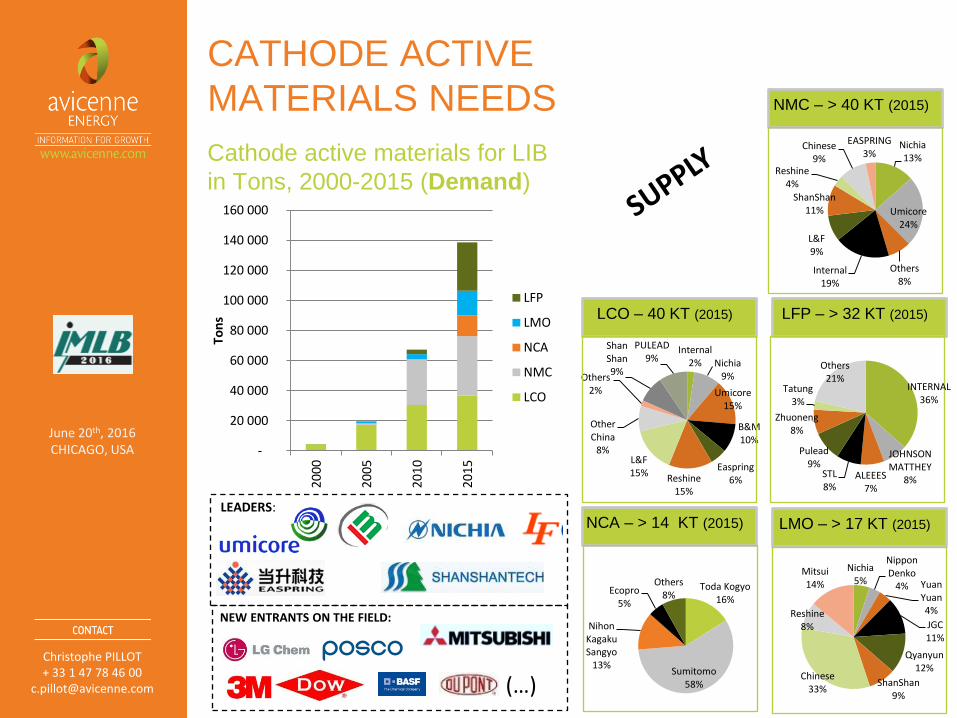
CATHODE ACTIVE
MATERIALS NEEDS
Cathode active materials for LIB
in Tons, 2000-2015 (Demand)
(…)
LEADERS:
Internal 2% Nichia
9%
Umicore 15%
B&M 10%
Easpring 6% Reshine
15%
L&F 15%
Other China
8%
Others 2%
Shan Shan 9%
PULEAD 9%
LCO – 40 KT (2015)
NMC – > 40 KT (2015)
Nichia 13%
Umicore 24%
Others 8%
Internal 19%
L&F 9%
ShanShan 11%
Reshine 4%
Chinese 9%
EASPRING 3%
LMO – > 17 KT (2015)
LFP – > 32 KT (2015)
Nichia 5%
Nippon Denko
4% Yuan Yuan 4%
JGC 11%
Qyanyun 12%
ShanShan 9%
Chinese 33%
Reshine 8%
Mitsui 14%
INTERNAL 36%
JOHNSON MATTHEY
8% ALEEES 7%
STL 8%
Pulead 9%
Zhuoneng 8%
Tatung 3%
Others 21%
-
20 000
40 000
60 000
80 000
100 000
120 000
140 000
160 000
20
00
2005
20
10
20
15
Ton
s
LFP
LMO
NCA
NMC
LCO
NCA – > 14 KT (2015)
Toda Kogyo 16%
Sumitomo 58%
Nihon Kagaku Sangyo
13%
Ecopro 5%
Others 8%
Christophe PILLOT + 33 1 47 78 46 00
June 20th, 2016 CHICAGO, USA
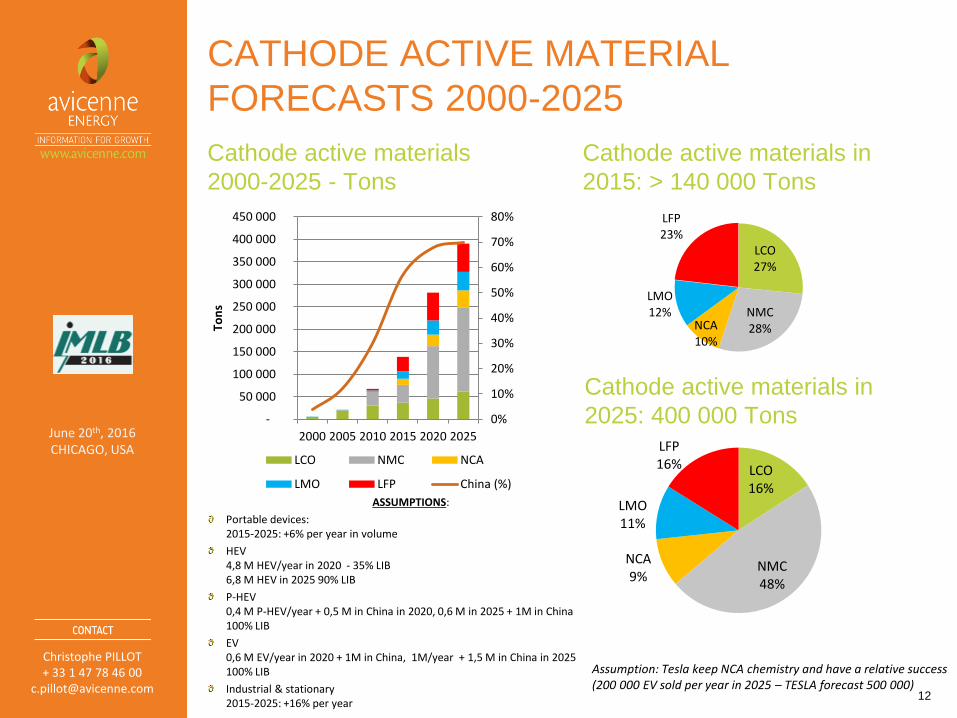
CATHODE ACTIVE MATERIAL
FORECASTS 2000-2025
Cathode active materials
2000-2025 - Tons
Cathode active materials in
2015: > 140 000 Tons
12
ASSUMPTIONS:
Portable devices: 2015-2025: +6% per year in volume
HEV 4,8 M HEV/year in 2020 - 35% LIB 6,8 M HEV in 2025 90% LIB
P-HEV 0,4 M P-HEV/year + 0,5 M in China in 2020, 0,6 M in 2025 + 1M in China 100% LIB
EV 0,6 M EV/year in 2020 + 1M in China, 1M/year + 1,5 M in China in 2025 100% LIB
Industrial & stationary 2015-2025: +16% per year
Assumption: Tesla keep NCA chemistry and have a relative success (200 000 EV sold per year in 2025 – TESLA forecast 500 000)
LCO 27%
NMC 28% NCA
10%
LMO 12%
LFP 23%
Cathode active materials in
2025: 400 000 Tons
LCO 16%
NMC 48%
NCA 9%
LMO 11%
LFP 16%
0%
10%
20%
30%
40%
50%
60%
70%
80%
-
50 000
100 000
150 000
200 000
250 000
300 000
350 000
400 000
450 000
2000 2005 2010 2015 2020 2025
Ton
s
LCO NMC NCA
LMO LFP China (%)
Christophe PILLOT + 33 1 47 78 46 00
June 20th, 2016 CHICAGO, USA
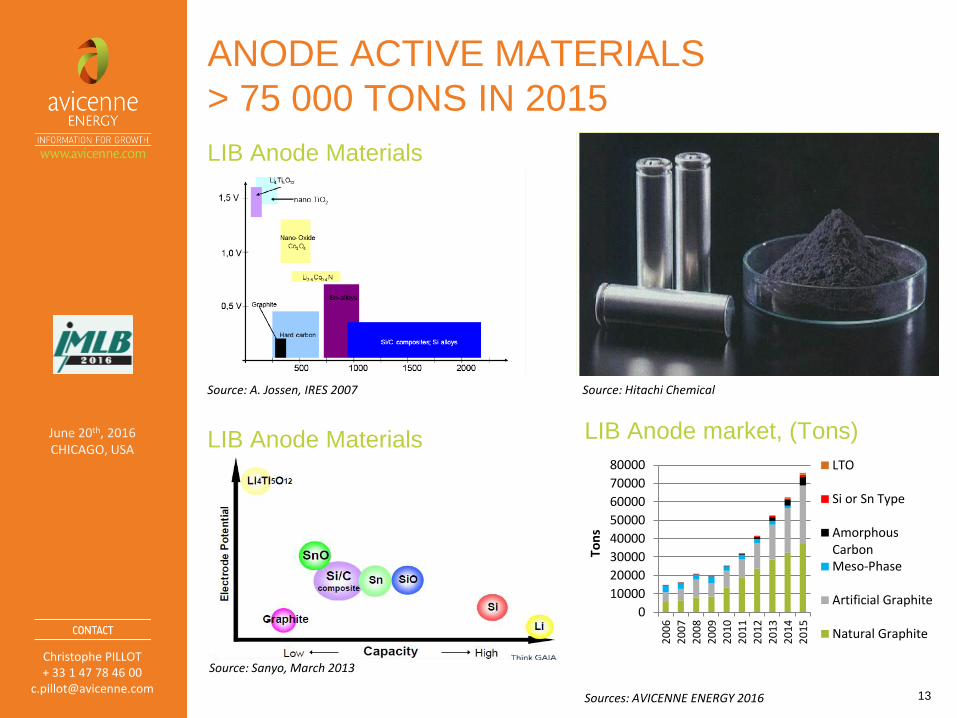
13
ANODE ACTIVE MATERIALS
> 75 000 TONS IN 2015
LIB Anode Materials
Source: Hitachi Chemical
Source: Sanyo, March 2013
LIB Anode market, (Tons)
LIB Anode Materials
Source: A. Jossen, IRES 2007
0,0
0,2
0,4
0,6
0,8
1,0
1,2
0 500 1000 1500 2000 2500
Sources: AVICENNE ENERGY 2016
0
10000
20000
30000
40000
50000
60000
70000
80000
20
06
20
07
20
08
20
09
20
10
20
11
20
12
20
13
20
14
20
15
To
ns
LTO
Si or Sn Type
AmorphousCarbonMeso-Phase
Artificial Graphite
Natural Graphite
Christophe PILLOT + 33 1 47 78 46 00
June 20th, 2016 CHICAGO, USA
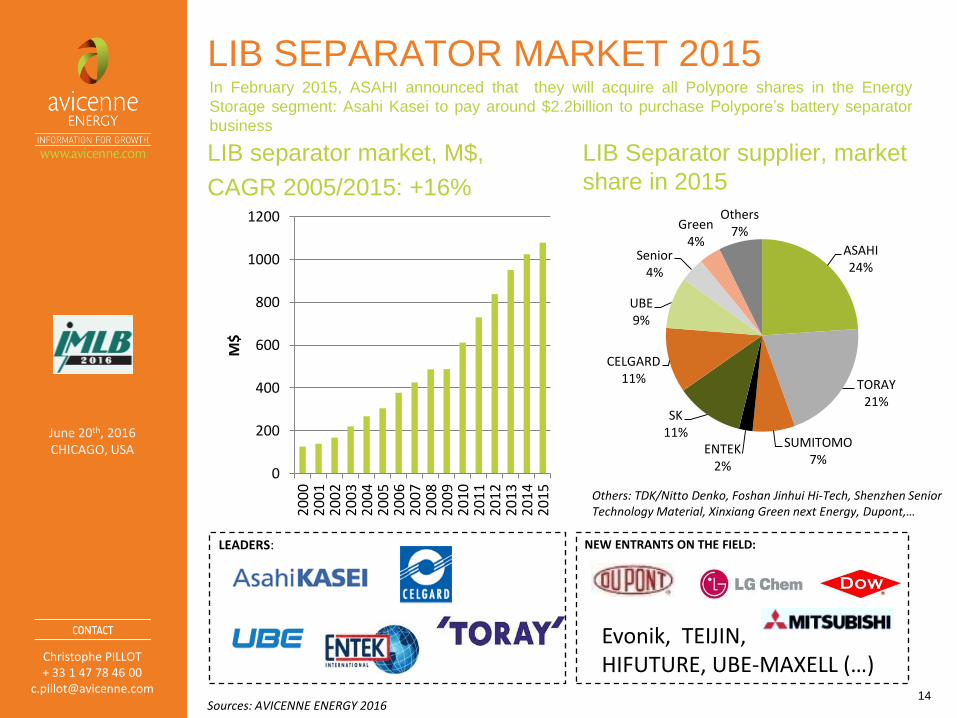
LIB SEPARATOR MARKET 2015
LIB separator market, M$,
CAGR 2005/2015: +16%
LIB Separator supplier, market
share in 2015
14
Others: TDK/Nitto Denko, Foshan Jinhui Hi-Tech, Shenzhen Senior Technology Material, Xinxiang Green next Energy, Dupont,…
0
200
400
600
800
1000
1200
20
00
20
01
20
02
20
03
20
04
20
05
20
06
20
07
20
08
20
09
20
10
20
11
20
12
20
13
20
14
20
15
M$
Evonik, TEIJIN, HIFUTURE, UBE-MAXELL (…)
NEW ENTRANTS ON THE FIELD: LEADERS:
ASAHI 24%
TORAY 21%
SUMITOMO 7%
ENTEK 2%
SK 11%
CELGARD 11%
UBE 9%
Senior 4%
Green 4%
Others 7%
Sources: AVICENNE ENERGY 2016
In February 2015, ASAHI announced that they will acquire all Polypore shares in the Energy
Storage segment: Asahi Kasei to pay around $2.2billion to purchase Polypore’s battery separator
business
Christophe PILLOT + 33 1 47 78 46 00
June 20th, 2016 CHICAGO, USA
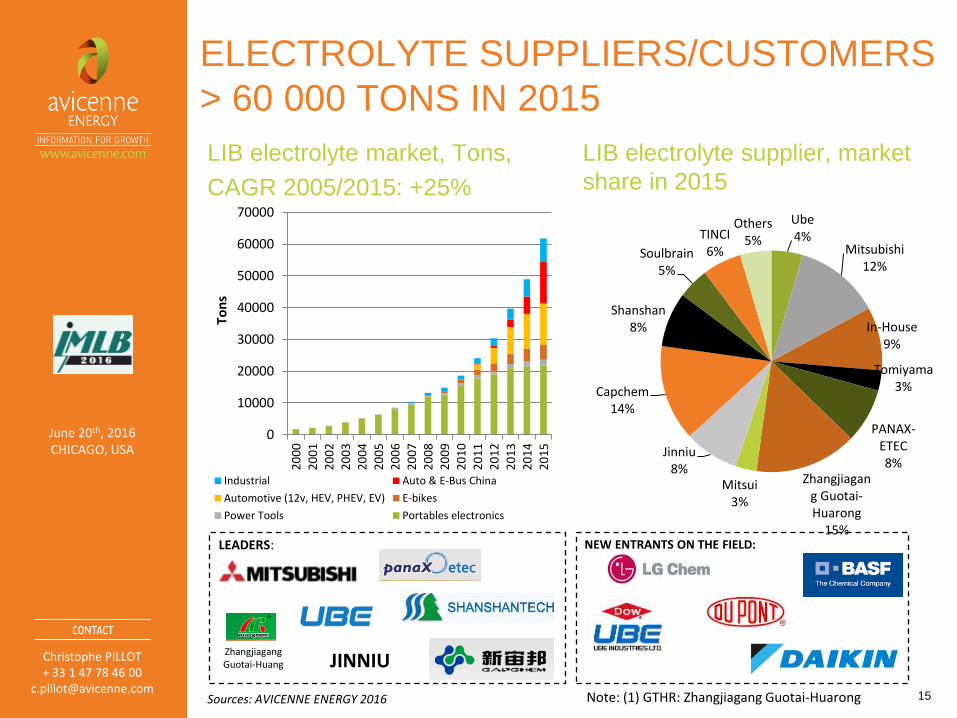
ELECTROLYTE SUPPLIERS/CUSTOMERS
> 60 000 TONS IN 2015
LIB electrolyte market, Tons,
CAGR 2005/2015: +25%
LIB electrolyte supplier, market
share in 2015
15
0
10000
20000
30000
40000
50000
60000
70000
20
00
20
01
20
02
20
03
20
04
20
05
20
06
20
07
20
08
20
09
20
10
20
11
20
12
20
13
20
14
20
15
Ton
s
Industrial Auto & E-Bus China
Automotive (12v, HEV, PHEV, EV) E-bikes
Power Tools Portables electronics
Note: (1) GTHR: Zhangjiagang Guotai-Huarong
NEW ENTRANTS ON THE FIELD: LEADERS:
Zhangjiagang Guotai-Huang JINNIU
Ube 4%
Mitsubishi 12%
In-House 9%
Tomiyama 3%
PANAX-ETEC 8%
Zhangjiagang Guotai-Huarong
15%
Mitsui 3%
Jinniu 8%
Capchem 14%
Shanshan 8%
Soulbrain 5%
TINCI 6%
Others 5%
Sources: AVICENNE ENERGY 2016
Christophe PILLOT + 33 1 47 78 46 00
June 20th, 2016 CHICAGO, USA
BATTERY MARKET FORECASTS
2015-2025
Portable PCs, net-book, Ultra-book Cellular Phones, Smart-phones Tablets Camcorders Cordless Tools, Gardening tools Digital Camera Games, MP3 Cordless Phones Shavers, Toothbrush, RC Cars E-bikes Power tools Security lighting Vehicles: HEV, P-HEV, EV Industrial motive (forklift) Industrial stationary (UPS, Telecom) Medical Energy Storage (Small / large)
Applications covered Parameters analysis
16
Main segment trends
Power need trends (volume, weight, capacity, running time)
Penetration rate for each Chemistry, each form factor,
2013 -2025 Forecasts
OEM strategies and positions
Main drivers & limiters
Christophe PILLOT + 33 1 47 78 46 00
June 20th, 2016 CHICAGO, USA
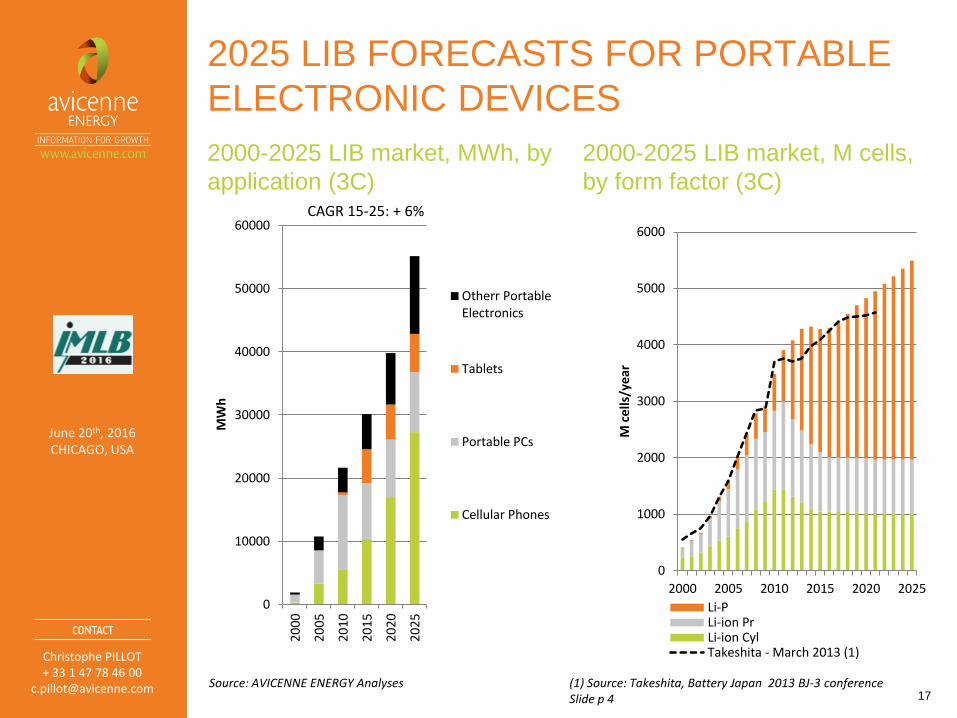
2025 LIB FORECASTS FOR PORTABLE
ELECTRONIC DEVICES
2000-2025 LIB market, MWh, by
application (3C)
2000-2025 LIB market, M cells,
by form factor (3C)
17
0
1000
2000
3000
4000
5000
6000
2000 2005 2010 2015 2020 2025
M c
ells
/yea
r Li-PLi-ion PrLi-ion CylTakeshita - March 2013 (1)
(1) Source: Takeshita, Battery Japan 2013 BJ-3 conference Slide p 4
Source: AVICENNE ENERGY Analyses
CAGR 15-25: + 6%
0
10000
20000
30000
40000
50000
60000
2000
2005
2010
2015
2020
2025
MW
h
Otherr PortableElectronics
Tablets
Portable PCs
Cellular Phones
Christophe PILLOT + 33 1 47 78 46 00
June 20th, 2016 CHICAGO, USA
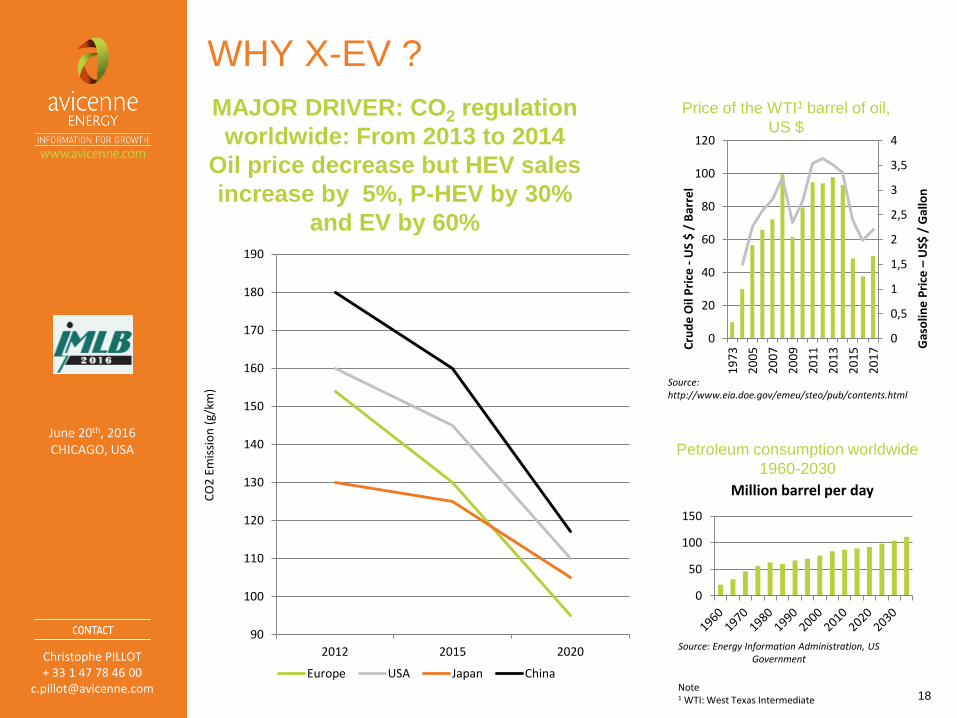
0
50
100
150
Million barrel per day
Price of the WTI1 barrel of oil,
US $
MAJOR DRIVER: CO2 regulation
worldwide: From 2013 to 2014
Oil price decrease but HEV sales
increase by 5%, P-HEV by 30%
and EV by 60%
18
WHY X-EV ?
Petroleum consumption worldwide
1960-2030
0
0,5
1
1,5
2
2,5
3
3,5
4
0
20
40
60
80
100
120
19
73
20
05
20
07
20
09
20
11
20
13
20
15
20
17 G
aso
line
Pri
ce –
US$
/ G
allo
n
Cru
de
Oil
Pri
ce -
US
$ /
Bar
rel
Source: Energy Information Administration, US Government
Source: http://www.eia.doe.gov/emeu/steo/pub/contents.html
Note 1 WTI: West Texas Intermediate
90
100
110
120
130
140
150
160
170
180
190
2012 2015 2020
CO
2 E
mis
sio
n (
g/km
)
Europe USA Japan China
Christophe PILLOT + 33 1 47 78 46 00
June 20th, 2016 CHICAGO, USA
19
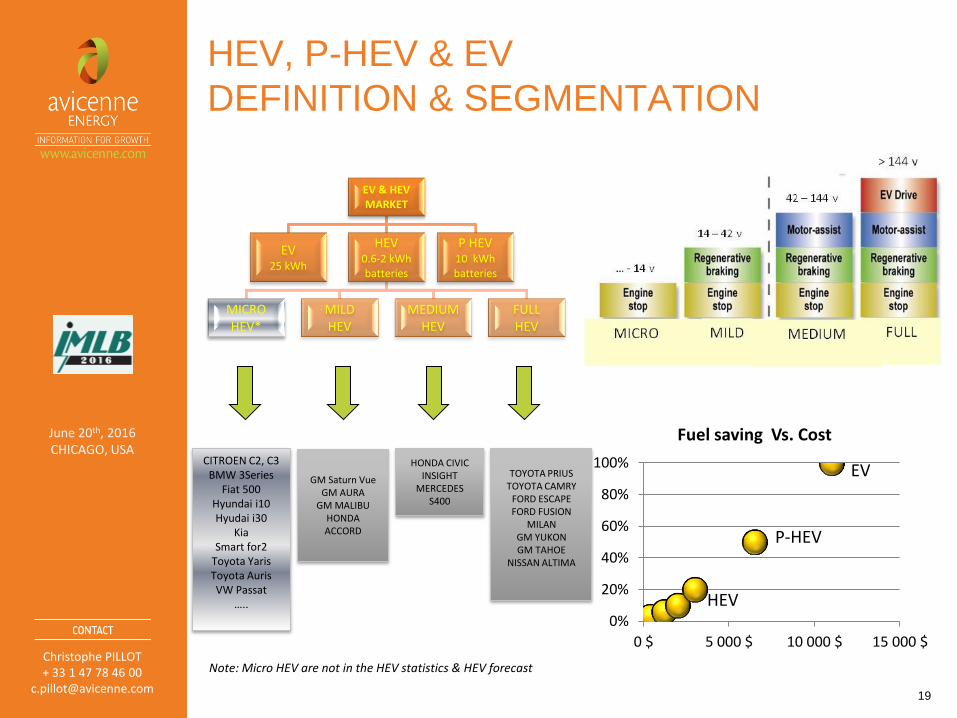
HEV, P-HEV & EV
DEFINITION & SEGMENTATION
Note: Micro HEV are not in the HEV statistics & HEV forecast
EV & HEV MARKET
EV 25 kWh
HEV 0.6-2 kWh batteries
MICRO HEV*
MILD HEV
MEDIUM HEV
FULL HEV
P HEV 10 kWh batteries
CITROEN C2, C3 BMW 3Series
Fiat 500 Hyundai i10 Hyudai i30
Kia Smart for2
Toyota Yaris Toyota Auris VW Passat
…..
GM Saturn Vue GM AURA
GM MALIBU HONDA ACCORD
HONDA CIVIC INSIGHT
MERCEDES S400
TOYOTA PRIUS
TOYOTA CAMRY FORD ESCAPE FORD FUSION
MILAN GM YUKON GM TAHOE
NISSAN ALTIMA
0%
20%
40%
60%
80%
100%
0 $ 5 000 $ 10 000 $ 15 000 $
Fuel saving Vs. Cost
HEV
P-HEV
EV
Christophe PILLOT + 33 1 47 78 46 00
June 20th, 2016 CHICAGO, USA
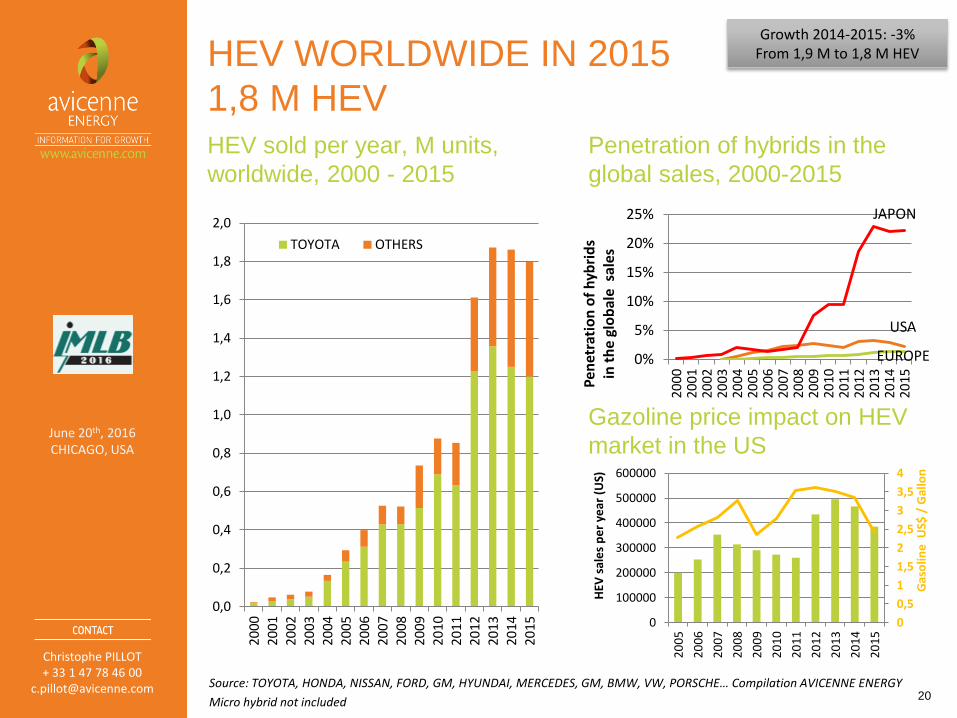
HEV WORLDWIDE IN 2015
1,8 M HEV
HEV sold per year, M units,
worldwide, 2000 - 2015
Penetration of hybrids in the
global sales, 2000-2015
20 Source: TOYOTA, HONDA, NISSAN, FORD, GM, HYUNDAI, MERCEDES, GM, BMW, VW, PORSCHE… Compilation AVICENNE ENERGY
Micro hybrid not included
0,0
0,2
0,4
0,6
0,8
1,0
1,2
1,4
1,6
1,8
2,0
200
0
20
01
20
02
20
03
20
04
20
05
20
06
20
07
20
08
20
09
201
02
011
20
12
20
13
20
14
20
15
Mill
ion
TOYOTA OTHERS
USA
JAPON
EUROPE 0%
5%
10%
15%
20%
25%
200
020
01
200
220
03
200
420
05
200
620
07
200
820
09
201
020
11
201
220
13
201
420
15
Pen
etra
tio
n o
f h
ybri
ds
in t
he
glo
bal
e s
ales
Growth 2014-2015: -3% From 1,9 M to 1,8 M HEV
0
0,5
1
1,5
2
2,5
3
3,5
4
0
100000
200000
300000
400000
500000
600000
20
05
20
06
20
07
20
08
20
09
20
10
20
11
20
12
20
13
20
14
20
15
Gas
olin
e U
S$ /
Gal
lon
HEV
sal
es
pe
r ye
ar (
US)
Gazoline price impact on HEV
market in the US
Christophe PILLOT + 33 1 47 78 46 00
June 20th, 2016 CHICAGO, USA
21
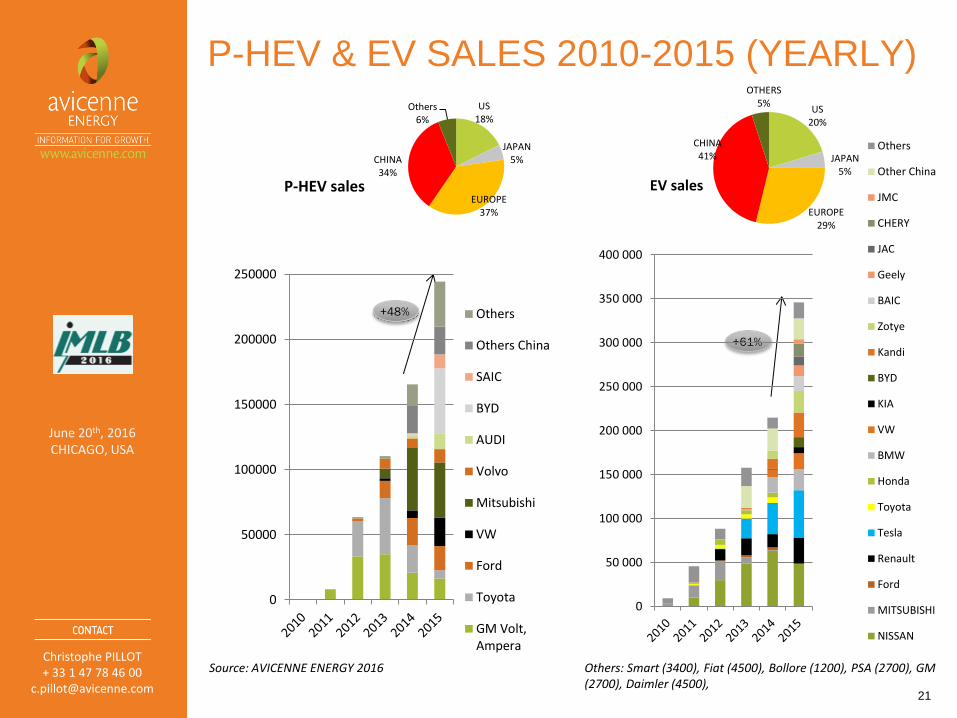
Others: Smart (3400), Fiat (4500), Bollore (1200), PSA (2700), GM (2700), Daimler (4500),
Source: AVICENNE ENERGY 2016
P-HEV & EV SALES 2010-2015 (YEARLY)
+48%
+61%
0
50000
100000
150000
200000
250000
P-HEV sales
Others
Others China
SAIC
BYD
AUDI
Volvo
Mitsubishi
VW
Ford
Toyota
GM Volt,Ampera
US 18%
JAPAN 5%
EUROPE 37%
CHINA 34%
Others 6%
0
50 000
100 000
150 000
200 000
250 000
300 000
350 000
400 000
EV sales
Others
Other China
JMC
CHERY
JAC
Geely
BAIC
Zotye
Kandi
BYD
KIA
VW
BMW
Honda
Toyota
Tesla
Renault
Ford
MITSUBISHI
NISSAN
US 20%
JAPAN 5%
EUROPE 29%
CHINA 41%
OTHERS 5%
Christophe PILLOT + 33 1 47 78 46 00
June 20th, 2016 CHICAGO, USA
22
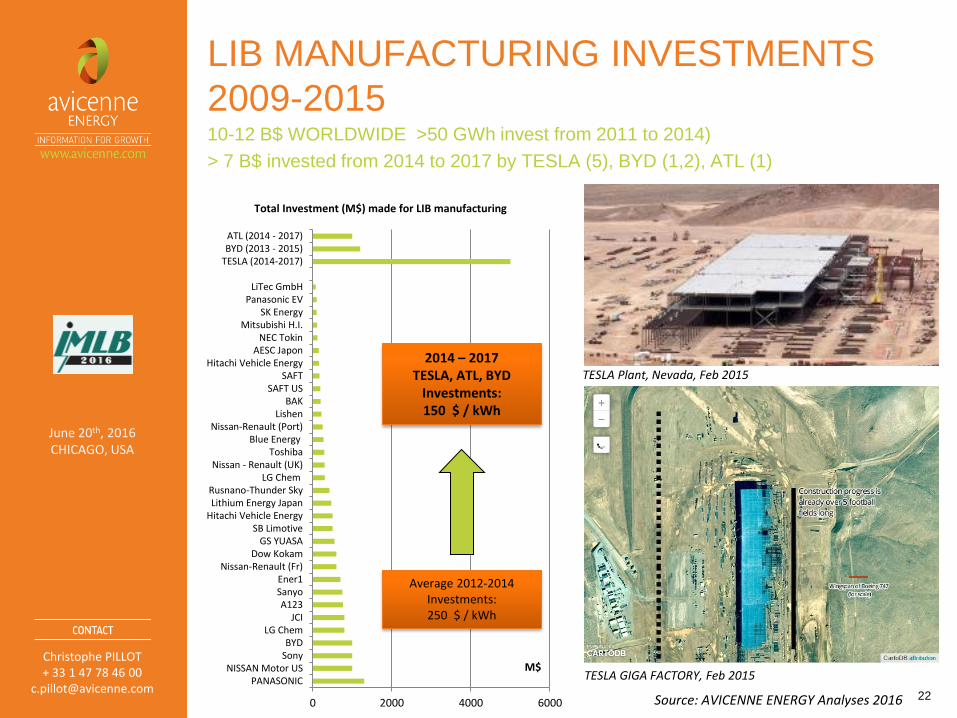
LIB MANUFACTURING INVESTMENTS
2009-2015
10-12 B$ WORLDWIDE >50 GWh invest from 2011 to 2014)
> 7 B$ invested from 2014 to 2017 by TESLA (5), BYD (1,2), ATL (1)
TESLA Plant, Nevada, Feb 2015
0 2000 4000 6000
PANASONICNISSAN Motor US
SonyBYD
LG ChemJCI
A123SanyoEner1
Nissan-Renault (Fr)Dow Kokam
GS YUASASB Limotive
Hitachi Vehicle EnergyLithium Energy JapanRusnano-Thunder Sky
LG ChemNissan - Renault (UK)
ToshibaBlue Energy
Nissan-Renault (Port)Lishen
BAKSAFT US
SAFTHitachi Vehicle Energy
AESC JaponNEC Tokin
Mitsubishi H.I.SK Energy
Panasonic EVLiTec GmbH
TESLA (2014-2017)BYD (2013 - 2015)ATL (2014 - 2017)
M$
Total Investment (M$) made for LIB manufacturing
Average 2012-2014 Investments: 250 $ / kWh
Source: AVICENNE ENERGY Analyses 2016
2014 – 2017 TESLA, ATL, BYD
Investments: 150 $ / kWh
TESLA GIGA FACTORY, Feb 2015
Christophe PILLOT + 33 1 47 78 46 00
June 20th, 2016 CHICAGO, USA
SAFETY ISSUES
23
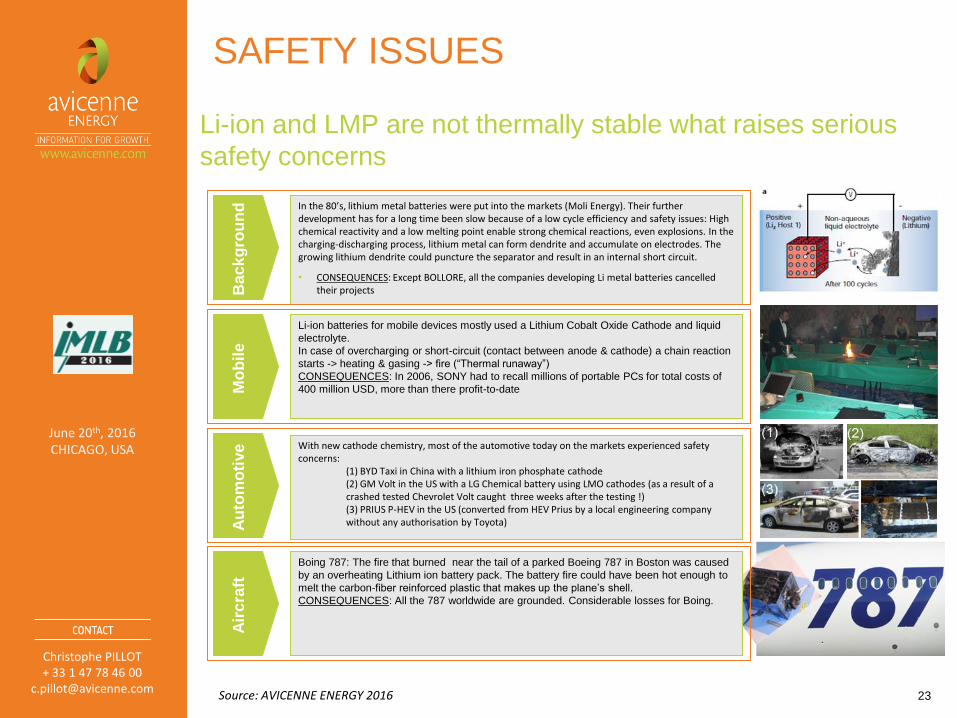
Li-ion and LMP are not thermally stable what raises serious
safety concerns
In the 80’s, lithium metal batteries were put into the markets (Moli Energy). Their further development has for a long time been slow because of a low cycle efficiency and safety issues: High chemical reactivity and a low melting point enable strong chemical reactions, even explosions. In the charging-discharging process, lithium metal can form dendrite and accumulate on electrodes. The growing lithium dendrite could puncture the separator and result in an internal short circuit.
• CONSEQUENCES: Except BOLLORE, all the companies developing Li metal batteries cancelled their projects
Bac
kg
rou
nd
M
ob
ile
Li-ion batteries for mobile devices mostly used a Lithium Cobalt Oxide Cathode and liquid
electrolyte.
In case of overcharging or short-circuit (contact between anode & cathode) a chain reaction
starts -> heating & gasing -> fire (“Thermal runaway”)
CONSEQUENCES: In 2006, SONY had to recall millions of portable PCs for total costs of
400 million USD, more than there profit-to-date
Au
tom
oti
ve
A
irc
raft
Boing 787: The fire that burned near the tail of a parked Boeing 787 in Boston was caused
by an overheating Lithium ion battery pack. The battery fire could have been hot enough to
melt the carbon-fiber reinforced plastic that makes up the plane’s shell.
CONSEQUENCES: All the 787 worldwide are grounded. Considerable losses for Boing.
With new cathode chemistry, most of the automotive today on the markets experienced safety concerns:
(1) BYD Taxi in China with a lithium iron phosphate cathode (2) GM Volt in the US with a LG Chemical battery using LMO cathodes (as a result of a crashed tested Chevrolet Volt caught three weeks after the testing !) (3) PRIUS P-HEV in the US (converted from HEV Prius by a local engineering company without any authorisation by Toyota)
Source: AVICENNE ENERGY 2016
Christophe PILLOT + 33 1 47 78 46 00
June 20th, 2016 CHICAGO, USA
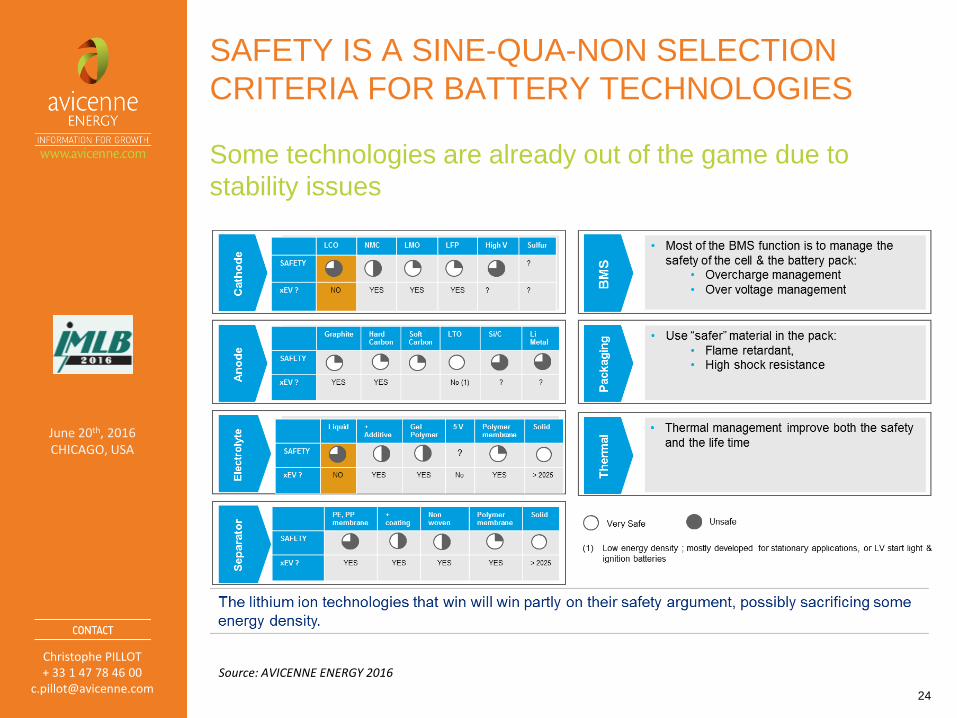
SAFETY IS A SINE-QUA-NON SELECTION
CRITERIA FOR BATTERY TECHNOLOGIES
24
Some technologies are already out of the game due to
stability issues
Source: AVICENNE ENERGY 2016
Christophe PILLOT + 33 1 47 78 46 00
June 20th, 2016 CHICAGO, USA
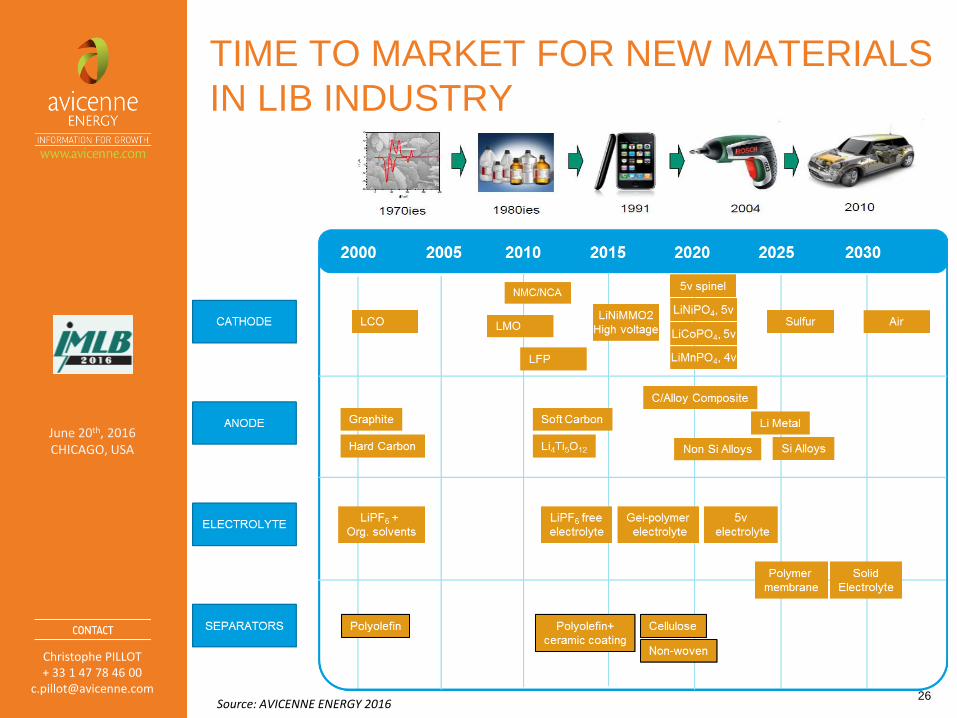
TIME TO MARKET FOR NEW MATERIALS
IN LIB INDUSTRY
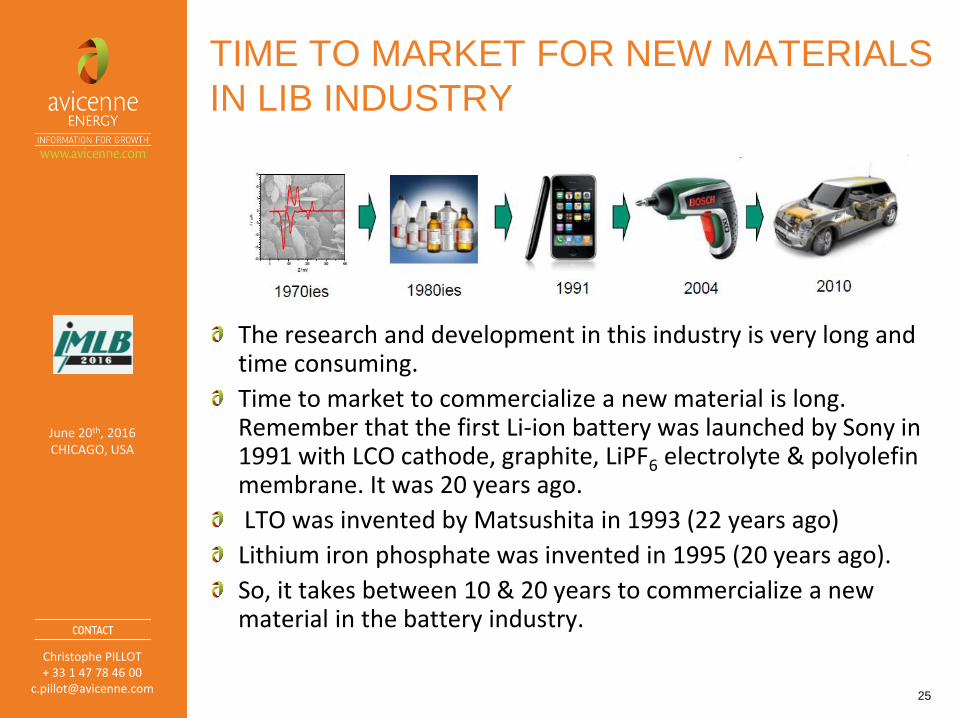
The research and development in this industry is very long and time consuming.
Time to market to commercialize a new material is long. Remember that the first Li-ion battery was launched by Sony in 1991 with LCO cathode, graphite, LiPF6 electrolyte & polyolefin membrane. It was 20 years ago.
LTO was invented by Matsushita in 1993 (22 years ago)
Lithium iron phosphate was invented in 1995 (20 years ago).
So, it takes between 10 & 20 years to commercialize a new material in the battery industry.
25
Christophe PILLOT + 33 1 47 78 46 00
June 20th, 2016 CHICAGO, USA
TIME TO MARKET FOR NEW MATERIALS
IN LIB INDUSTRY
26 Source: AVICENNE ENERGY 2016
Christophe PILLOT + 33 1 47 78 46 00
June 20th, 2016 CHICAGO, USA
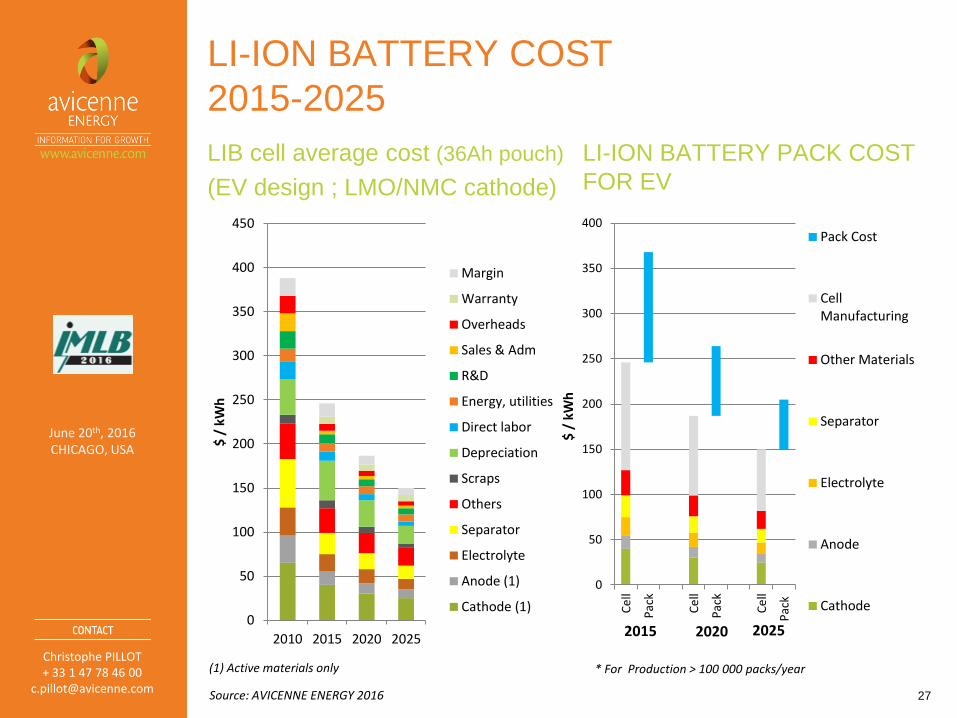
LI-ION BATTERY COST
2015-2025
LIB cell average cost (36Ah pouch)
(EV design ; LMO/NMC cathode)
LI-ION BATTERY PACK COST
FOR EV
27
* For Production > 100 000 packs/year
(1) Active materials only
2020 2025 2015
0
50
100
150
200
250
300
350
400
Ce
ll
Pac
k
Ce
ll
Pac
k
Ce
ll
Pac
k
$ /
kW
h
Pack Cost
CellManufacturing
Other Materials
Separator
Electrolyte
Anode
Cathode0
50
100
150
200
250
300
350
400
450
2010 2015 2020 2025
$ /
kW
h
Margin
Warranty
Overheads
Sales & Adm
R&D
Energy, utilities
Direct labor
Depreciation
Scraps
Others
Separator
Electrolyte
Anode (1)
Cathode (1)
Source: AVICENNE ENERGY 2016
Christophe PILLOT + 33 1 47 78 46 00
June 20th, 2016 CHICAGO, USA
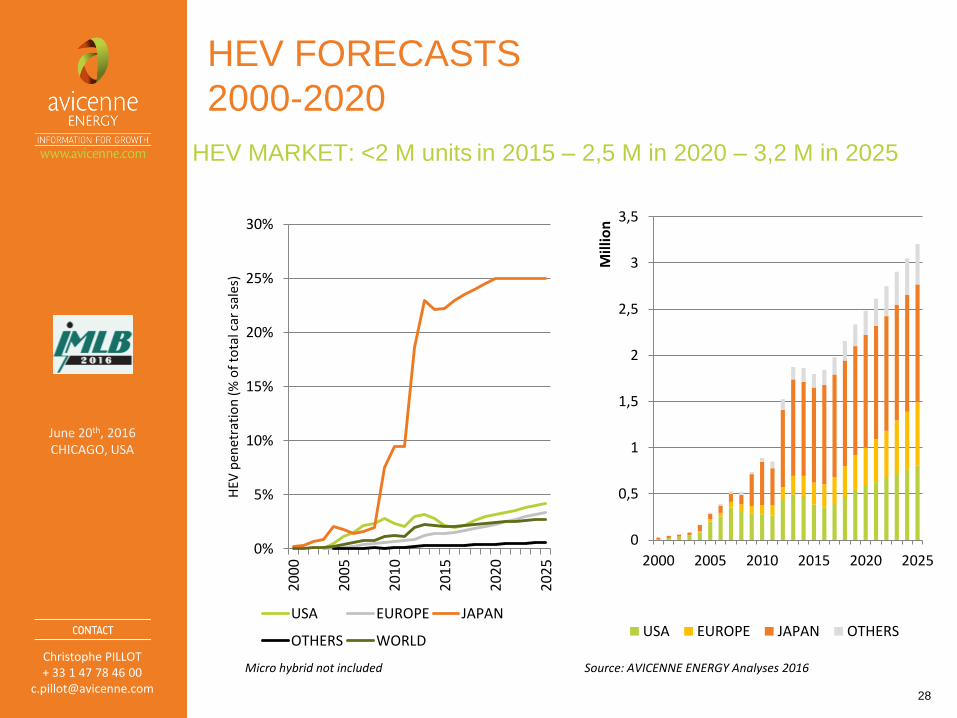
HEV FORECASTS
2000-2020
0%
5%
10%
15%
20%
25%
30%
20
00
20
05
20
10
20
15
20
20
20
25
HEV
pen
etra
tio
n (
% o
f to
tal c
ar s
ales
)
USA EUROPE JAPAN
OTHERS WORLD
HEV MARKET: <2 M units in 2015 – 2,5 M in 2020 – 3,2 M in 2025
28
0
0,5
1
1,5
2
2,5
3
3,5
2000 2005 2010 2015 2020 2025
Mill
ion
USA EUROPE JAPAN OTHERS
Micro hybrid not included
Source: AVICENNE ENERGY Analyses 2016
Christophe PILLOT + 33 1 47 78 46 00
June 20th, 2016 CHICAGO, USA
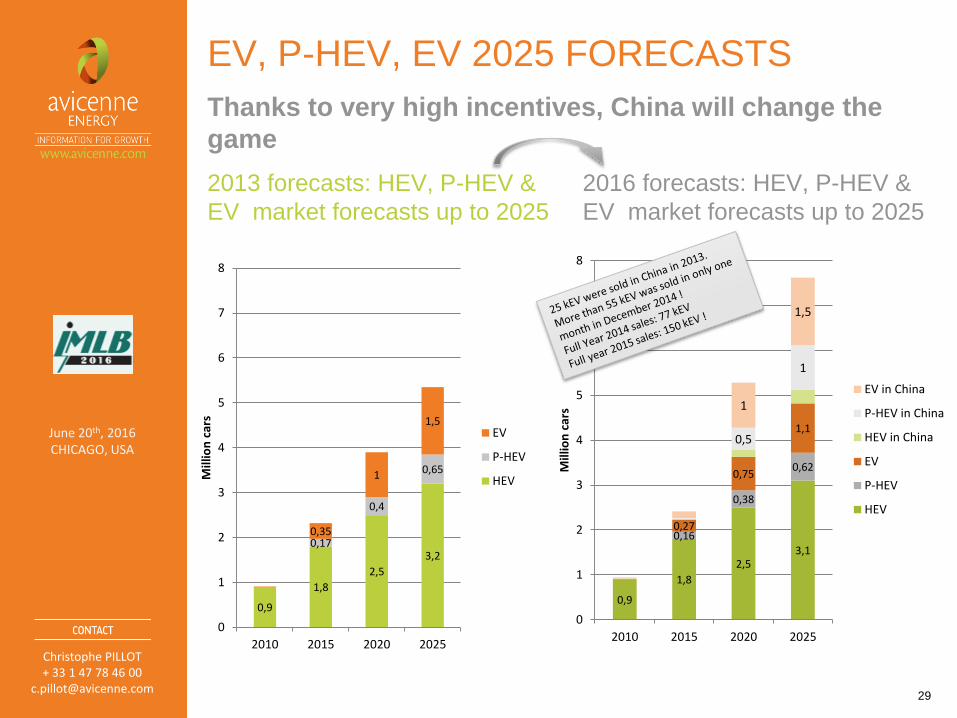
EV, P-HEV, EV 2025 FORECASTS
0,9
1,8
2,5
3,2 0,17
0,4
0,65
0,35
1
1,5
0
1
2
3
4
5
6
7
8
2010 2015 2020 2025
Mill
ion
car
s
EV
P-HEV
HEV
2013 forecasts: HEV, P-HEV &
EV market forecasts up to 2025
2016 forecasts: HEV, P-HEV &
EV market forecasts up to 2025
29
Thanks to very high incentives, China will change the
game
0,9
1,8
2,5 3,1
0,16
0,38
0,62
0,27
0,75
1,1 0,5
1
1
1,5
0
1
2
3
4
5
6
7
8
2010 2015 2020 2025
Mill
ion
car
s
EV in China
P-HEV in China
HEV in China
EV
P-HEV
HEV
Christophe PILLOT + 33 1 47 78 46 00
June 20th, 2016 CHICAGO, USA
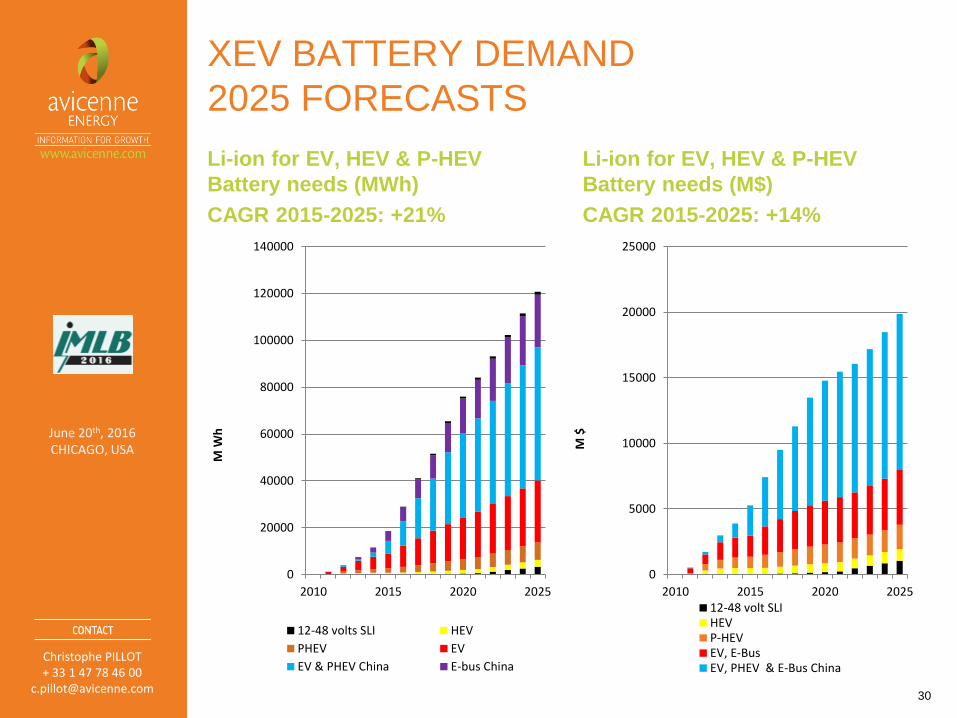
XEV BATTERY DEMAND
2025 FORECASTS
Li-ion for EV, HEV & P-HEV
Battery needs (MWh)
CAGR 2015-2025: +21%
Li-ion for EV, HEV & P-HEV
Battery needs (M$)
CAGR 2015-2025: +14%
30
0
20000
40000
60000
80000
100000
120000
140000
2010 2015 2020 2025
M W
h
12-48 volts SLI HEV
PHEV EV
EV & PHEV China E-bus China
0
5000
10000
15000
20000
25000
2010 2015 2020 2025M
$
12-48 volt SLIHEVP-HEVEV, E-BusEV, PHEV & E-Bus China
Christophe PILLOT + 33 1 47 78 46 00
June 20th, 2016 CHICAGO, USA
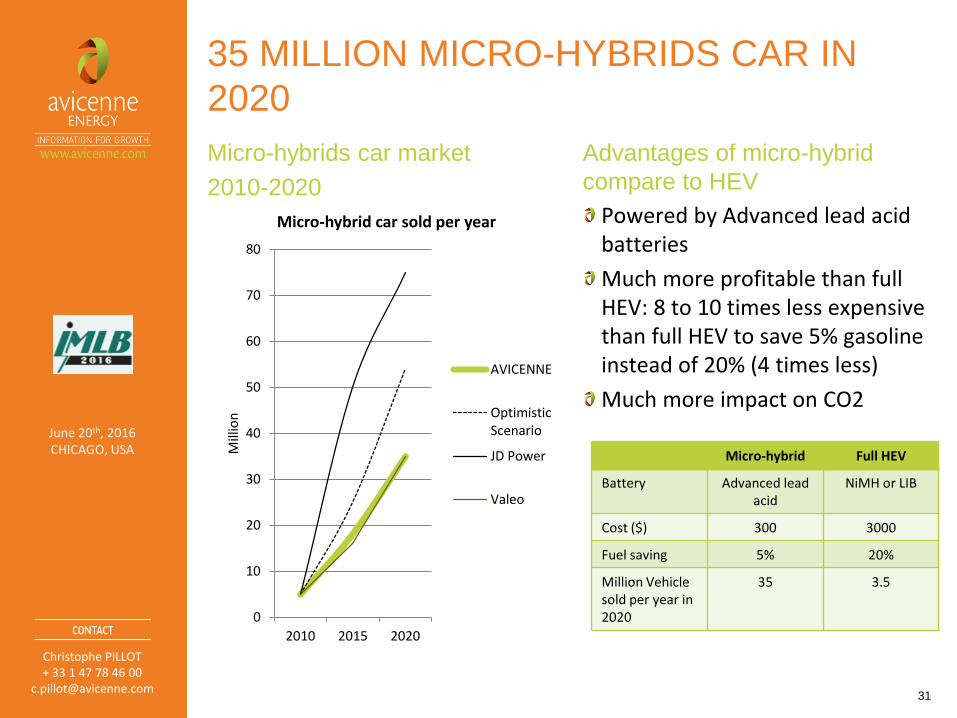
35 MILLION MICRO-HYBRIDS CAR IN
2020
Micro-hybrids car market
2010-2020
Advantages of micro-hybrid
compare to HEV
31
Powered by Advanced lead acid batteries
Much more profitable than full HEV: 8 to 10 times less expensive than full HEV to save 5% gasoline instead of 20% (4 times less)
Much more impact on CO2
0
10
20
30
40
50
60
70
80
2010 2015 2020
Mill
ion
Micro-hybrid car sold per year
AVICENNE
OptimisticScenario
JD Power
Valeo
Micro-hybrid Full HEV
Battery Advanced lead acid
NiMH or LIB
Cost ($) 300 3000
Fuel saving 5% 20%
Million Vehicle sold per year in 2020
35 3.5
Christophe PILLOT + 33 1 47 78 46 00
June 20th, 2016 CHICAGO, USA
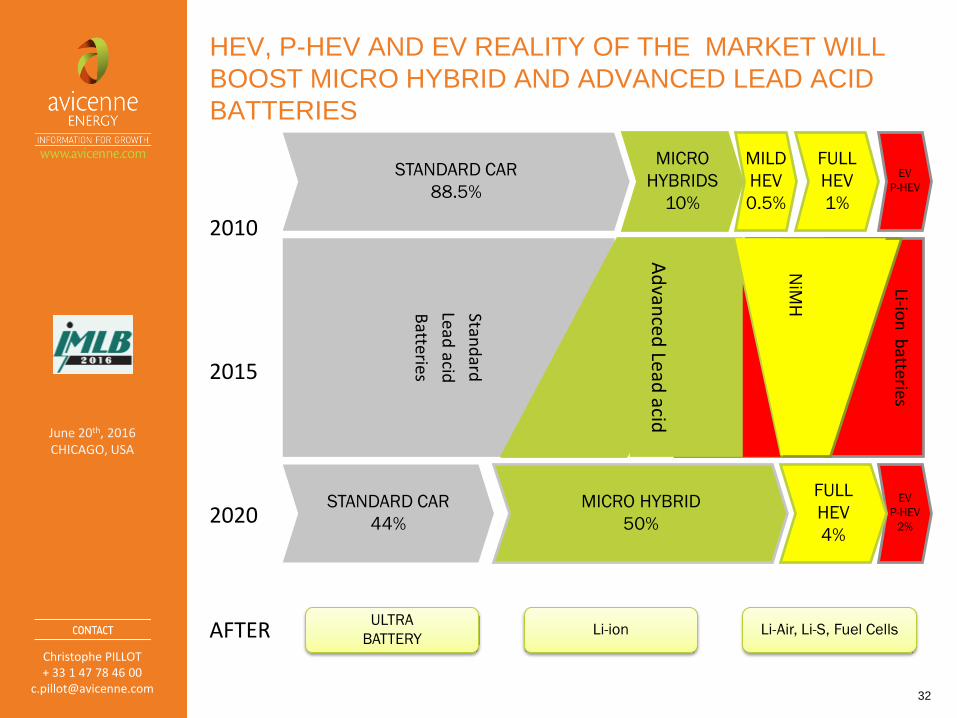
HEV, P-HEV AND EV REALITY OF THE MARKET WILL
BOOST MICRO HYBRID AND ADVANCED LEAD ACID
BATTERIES
32
Stand
ard
Lead acid
Batteries
2010 2015 2020 AFTER
Li-ion
batteries
NiM
H b
atte
ries
STANDARD CAR
88.5% EV
P-HEV
FULL
HEV
1%
MILD
HEV
0.5%
MICRO
HYBRIDS
10%
Ad
vanced
Lead acid
NiM
H
STANDARD CAR
44%
MICRO HYBRID
50%
EV
P-HEV
2%
FULL
HEV
4%
ULTRA
BATTERY Li-Air, Li-S, Fuel Cells Li-ion
Christophe PILLOT + 33 1 47 78 46 00
June 20th, 2016 CHICAGO, USA
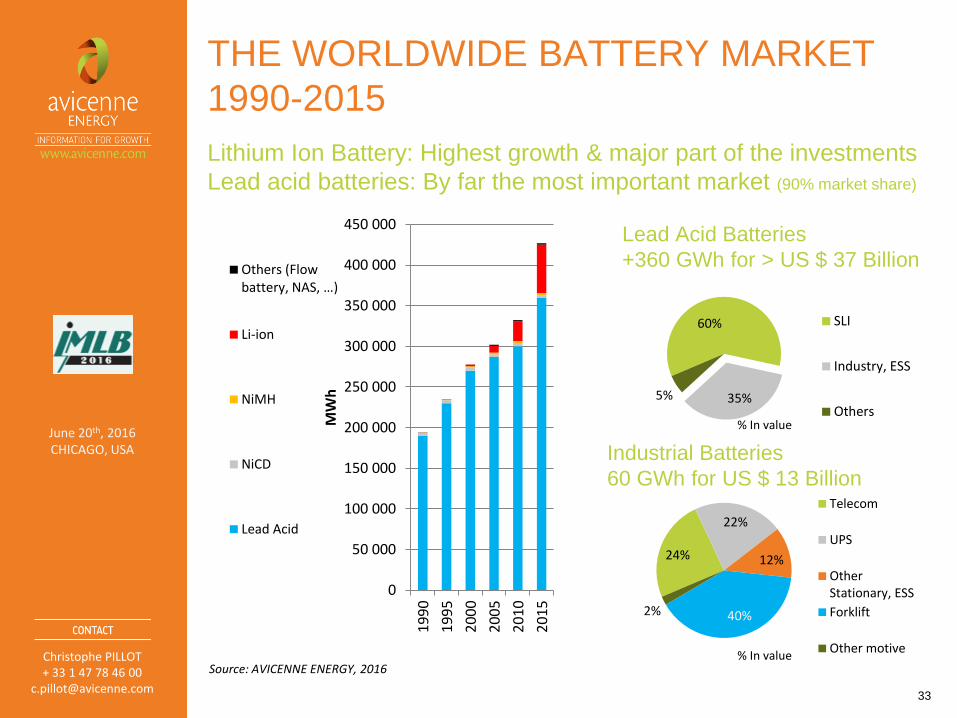
THE WORLDWIDE BATTERY MARKET
1990-2015
Lithium Ion Battery: Highest growth & major part of the investments
Lead acid batteries: By far the most important market (90% market share)
33
Source: AVICENNE ENERGY, 2016
Lead Acid Batteries
+360 GWh for > US $ 37 Billion
60%
35% 5%
SLI
Industry, ESS
Others
24%
22%
12%
40% 2%
Telecom
UPS
OtherStationary, ESS
Forklift
Other motive
Industrial Batteries
60 GWh for US $ 13 Billion
0
50 000
100 000
150 000
200 000
250 000
300 000
350 000
400 000
450 000
19
90
19
95
20
00
20
05
20
10
20
15
MW
h
Others (Flow battery, NAS, …)
Li-ion
NiMH
NiCD
Lead Acid
% In value
% In value
Christophe PILLOT + 33 1 47 78 46 00
June 20th, 2016 CHICAGO, USA
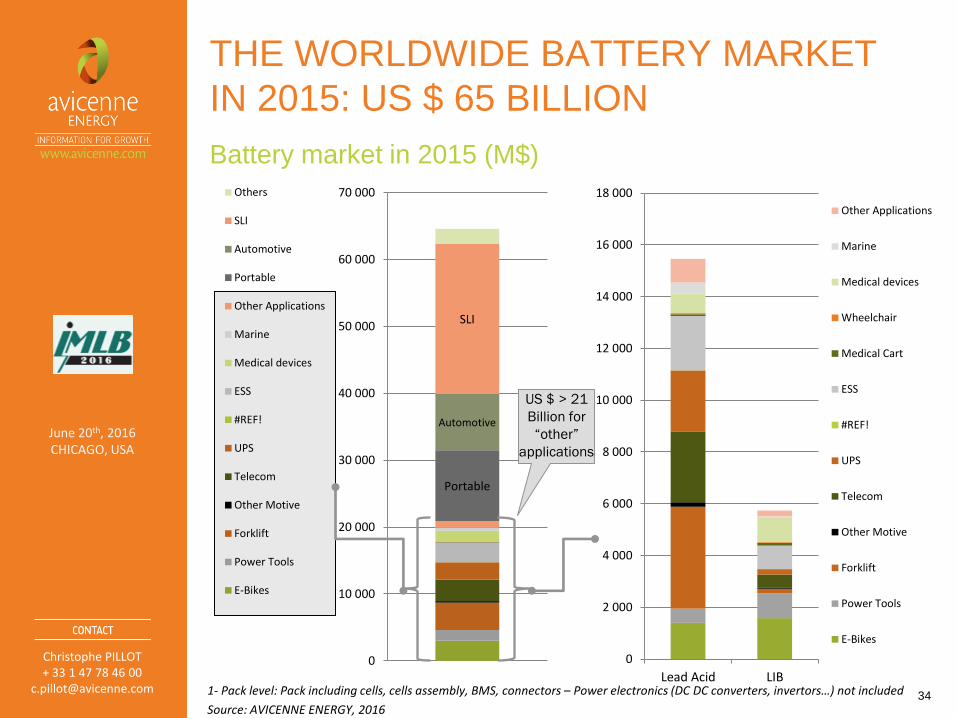
THE WORLDWIDE BATTERY MARKET
IN 2015: US $ 65 BILLION
Portable
Automotive
SLI
0
10 000
20 000
30 000
40 000
50 000
60 000
70 000Others
SLI
Automotive
Portable
Other Applications
Marine
Medical devices
ESS
#REF!
UPS
Telecom
Other Motive
Forklift
Power Tools
E-Bikes
34
Battery market in 2015 (M$)
1- Pack level: Pack including cells, cells assembly, BMS, connectors – Power electronics (DC DC converters, invertors…) not included
Source: AVICENNE ENERGY, 2016
0
2 000
4 000
6 000
8 000
10 000
12 000
14 000
16 000
18 000
Lead Acid LIB
Other Applications
Marine
Medical devices
Wheelchair
Medical Cart
ESS
#REF!
UPS
Telecom
Other Motive
Forklift
Power Tools
E-Bikes
US $ > 21
Billion for
“other”
applications
Christophe PILLOT + 33 1 47 78 46 00
June 20th, 2016 CHICAGO, USA
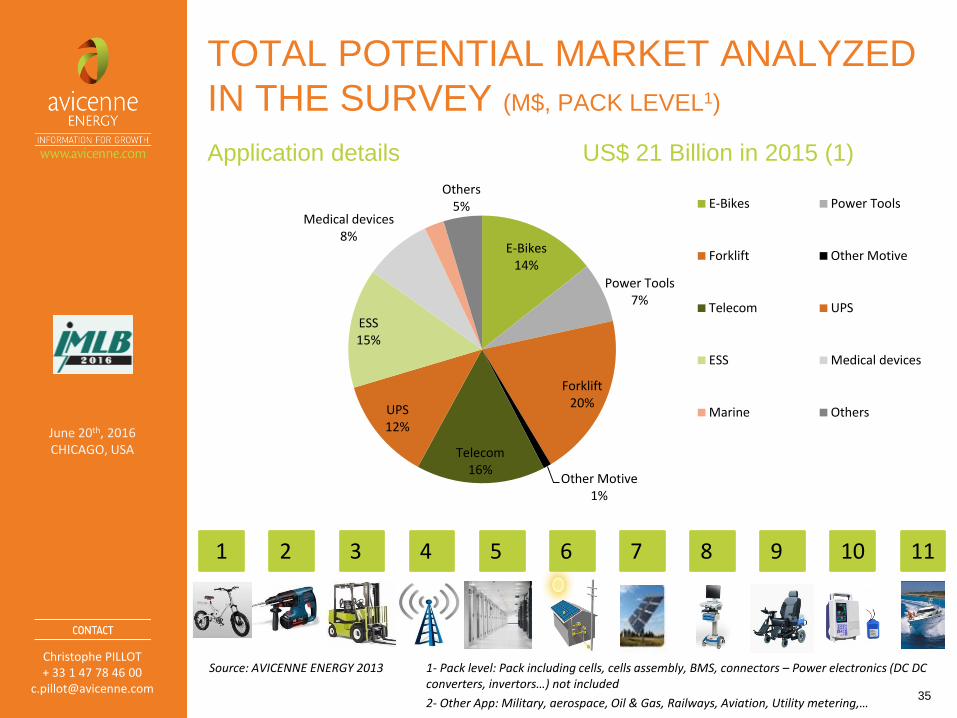
TOTAL POTENTIAL MARKET ANALYZED
IN THE SURVEY (M$, PACK LEVEL1)
Application details US$ 21 Billion in 2015 (1)
35
E-Bikes 14%
Power Tools 7%
Forklift 20%
Other Motive 1%
Telecom 16%
UPS 12%
ESS 15%
Medical devices 8%
Others 5% E-Bikes Power Tools
Forklift Other Motive
Telecom UPS
ESS Medical devices
Marine Others
1- Pack level: Pack including cells, cells assembly, BMS, connectors – Power electronics (DC DC converters, invertors…) not included
2- Other App: Military, aerospace, Oil & Gas, Railways, Aviation, Utility metering,…
Source: AVICENNE ENERGY 2013
1 2 3 4 5 7 8 9 10 11 6
Christophe PILLOT + 33 1 47 78 46 00
June 20th, 2016 CHICAGO, USA
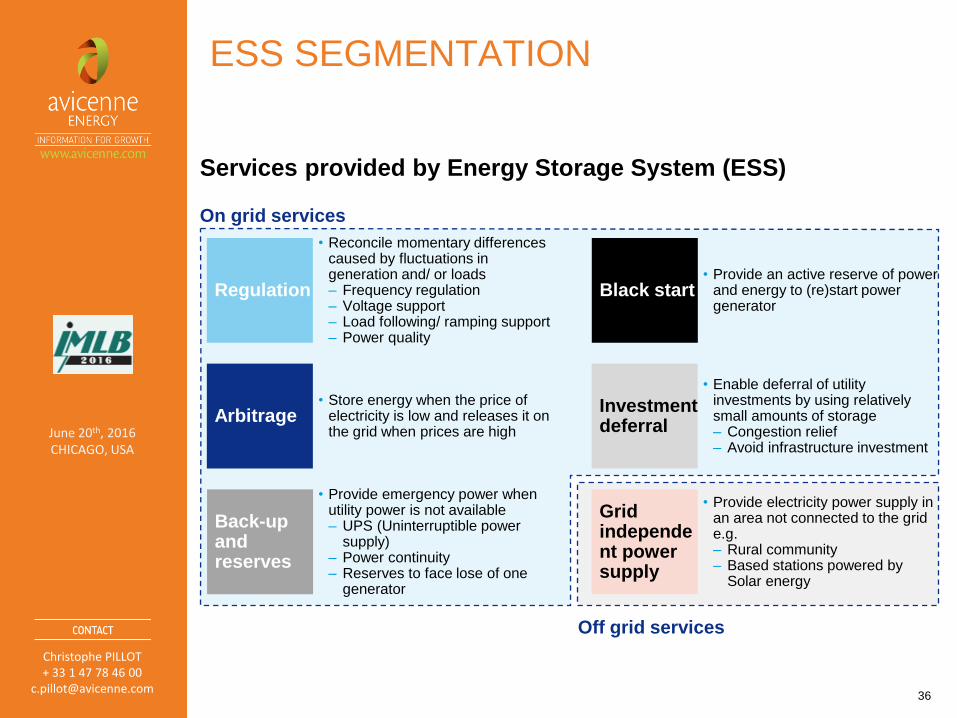
ESS SEGMENTATION
36
Services provided by Energy Storage System (ESS)
Regulation
Arbitrage Investment deferral
Grid independent power supply
• Reconcile momentary differences caused by fluctuations in generation and/ or loads – Frequency regulation – Voltage support – Load following/ ramping support – Power quality
Back-up and reserves
• Provide emergency power when utility power is not available – UPS (Uninterruptible power
supply) – Power continuity – Reserves to face lose of one
generator
Black start • Provide an active reserve of power
and energy to (re)start power generator
• Store energy when the price of electricity is low and releases it on the grid when prices are high
• Enable deferral of utility investments by using relatively small amounts of storage – Congestion relief – Avoid infrastructure investment
• Provide electricity power supply in an area not connected to the grid e.g. – Rural community – Based stations powered by
Solar energy
On grid services
Off grid services
Christophe PILLOT + 33 1 47 78 46 00
June 20th, 2016 CHICAGO, USA
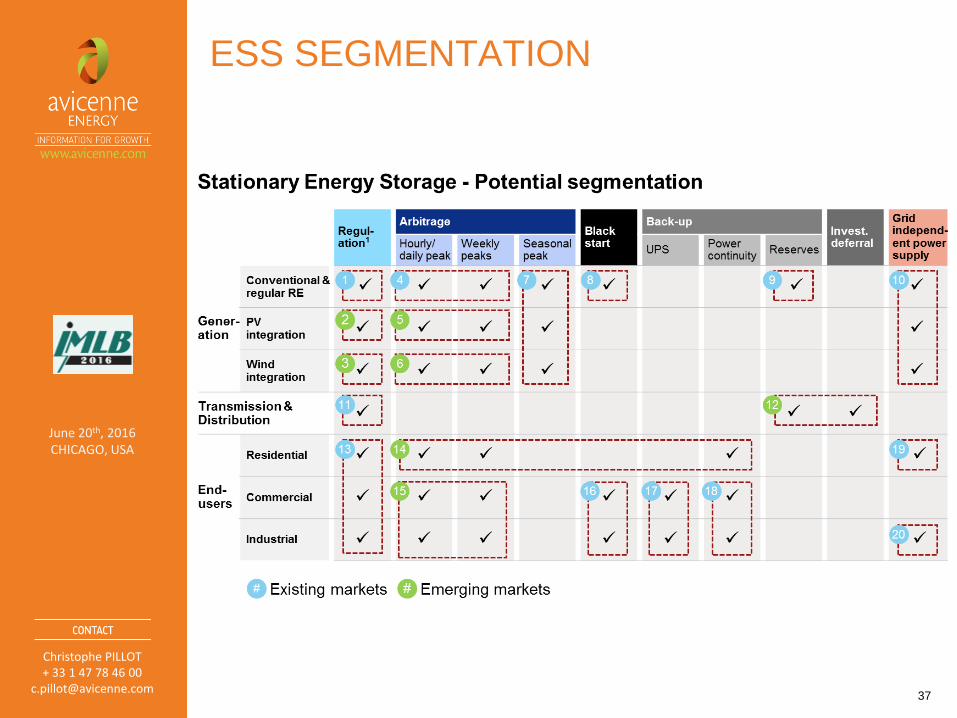
ESS SEGMENTATION
37
Christophe PILLOT + 33 1 47 78 46 00
June 20th, 2016 CHICAGO, USA
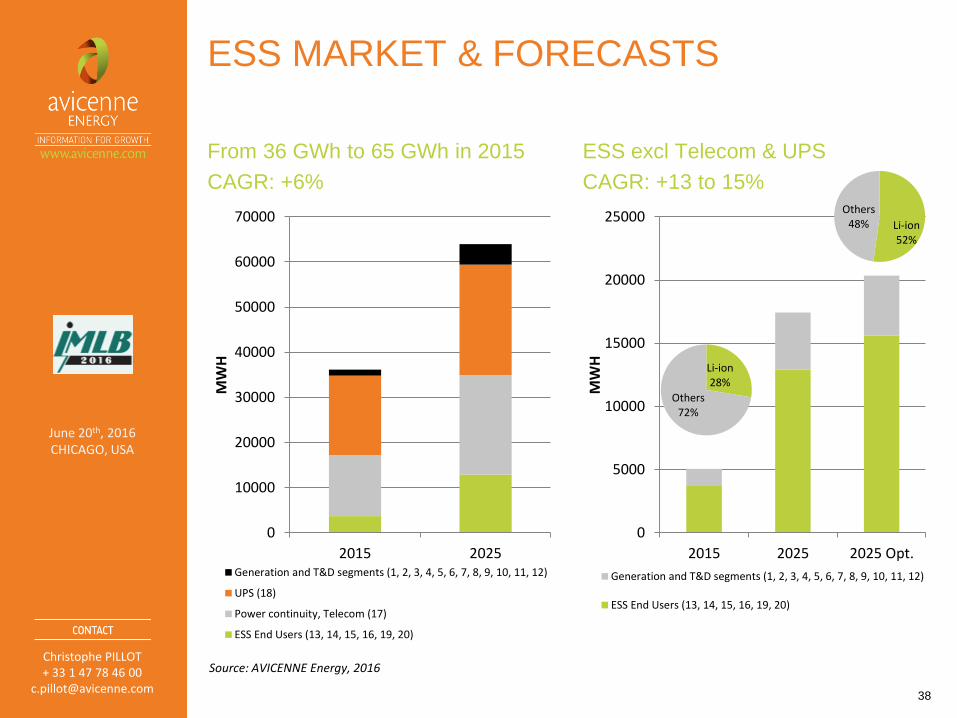
ESS MARKET & FORECASTS
0
10000
20000
30000
40000
50000
60000
70000
2015 2025
MW
H
Generation and T&D segments (1, 2, 3, 4, 5, 6, 7, 8, 9, 10, 11, 12)
UPS (18)
Power continuity, Telecom (17)
ESS End Users (13, 14, 15, 16, 19, 20)
From 36 GWh to 65 GWh in 2015
CAGR: +6%
ESS excl Telecom & UPS
CAGR: +13 to 15%
38
Source: AVICENNE Energy, 2016
0
5000
10000
15000
20000
25000
2015 2025 2025 Opt.
MW
H
Generation and T&D segments (1, 2, 3, 4, 5, 6, 7, 8, 9, 10, 11, 12)
ESS End Users (13, 14, 15, 16, 19, 20)
Li-ion 28%
Others 72%
Li-ion 52%
Others 48%
Christophe PILLOT + 33 1 47 78 46 00
June 20th, 2016 CHICAGO, USA
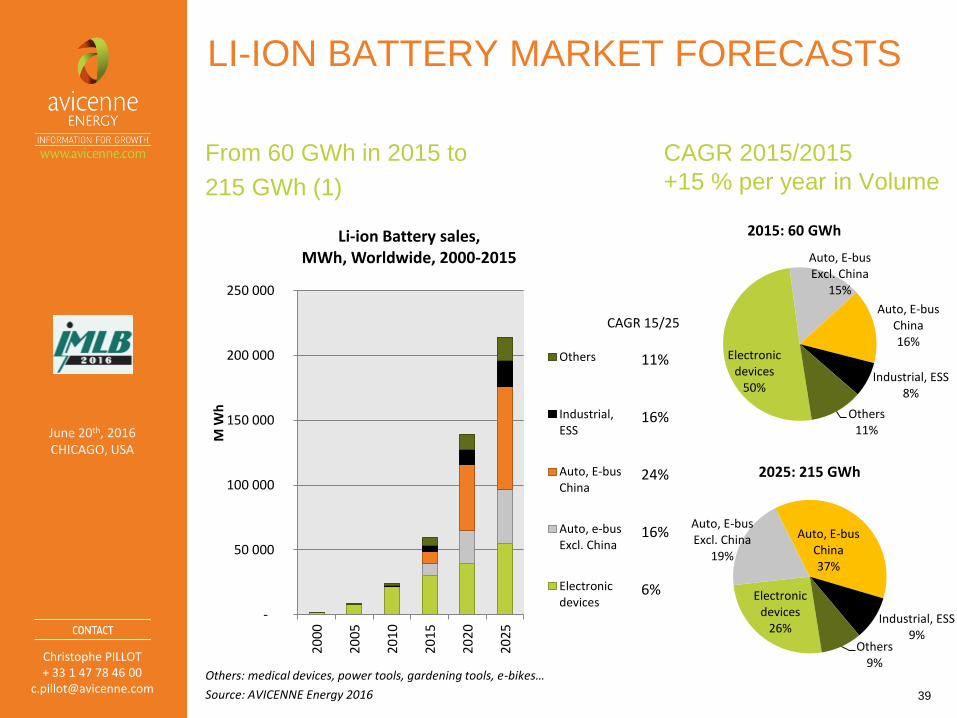
LI-ION BATTERY MARKET FORECASTS
39
Others: medical devices, power tools, gardening tools, e-bikes…
Source: AVICENNE Energy 2016
From 60 GWh in 2015 to
215 GWh (1)
CAGR 2015/2015
+15 % per year in Volume
-
50 000
100 000
150 000
200 000
250 000
200
0
200
5
201
0
201
5
202
0
202
5
M W
h
Li-ion Battery sales, MWh, Worldwide, 2000-2015
Others
Industrial,ESS
Auto, E-busChina
Auto, e-busExcl. China
Electronicdevices
2015: 60 GWh
2025: 215 GWh
Electronic devices
50%
Auto, E-bus Excl. China
15%
Auto, E-bus China 16%
Industrial, ESS 8%
Others 11%
Electronic devices
26%
Auto, E-bus Excl. China
19%
Auto, E-bus China 37%
Industrial, ESS 9%
Others 9%
11% 16% 24% 16% 6%
CAGR 15/25
Christophe PILLOT + 33 1 47 78 46 00
June 20th, 2016 CHICAGO, USA
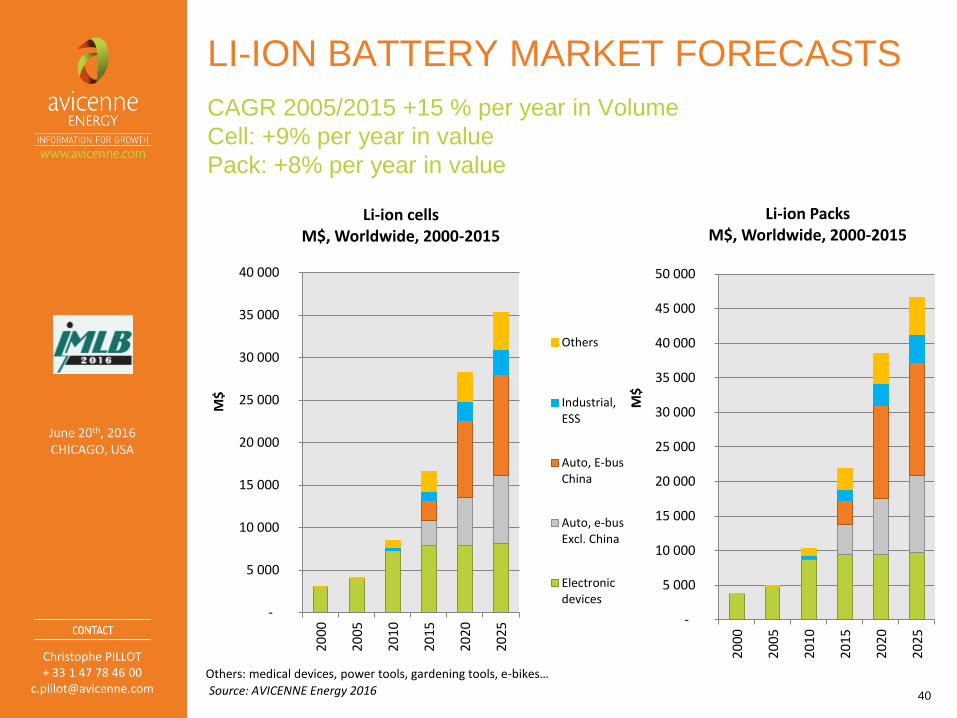
LI-ION BATTERY MARKET FORECASTS
CAGR 2005/2015 +15 % per year in Volume
Cell: +9% per year in value
Pack: +8% per year in value
40 Source: AVICENNE Energy 2016
-
5 000
10 000
15 000
20 000
25 000
30 000
35 000
40 000
20
00
20
05
20
10
20
15
20
20
20
25
M$
Li-ion cells
M$, Worldwide, 2000-2015
Others
Industrial,ESS
Auto, E-busChina
Auto, e-busExcl. China
Electronicdevices
-
5 000
10 000
15 000
20 000
25 000
30 000
35 000
40 000
45 000
50 000
20
00
20
05
20
10
20
15
202
0
20
25
M$
Li-ion Packs M$, Worldwide, 2000-2015
Others: medical devices, power tools, gardening tools, e-bikes…
Christophe PILLOT + 33 1 47 78 46 00
June 20th, 2016 CHICAGO, USA
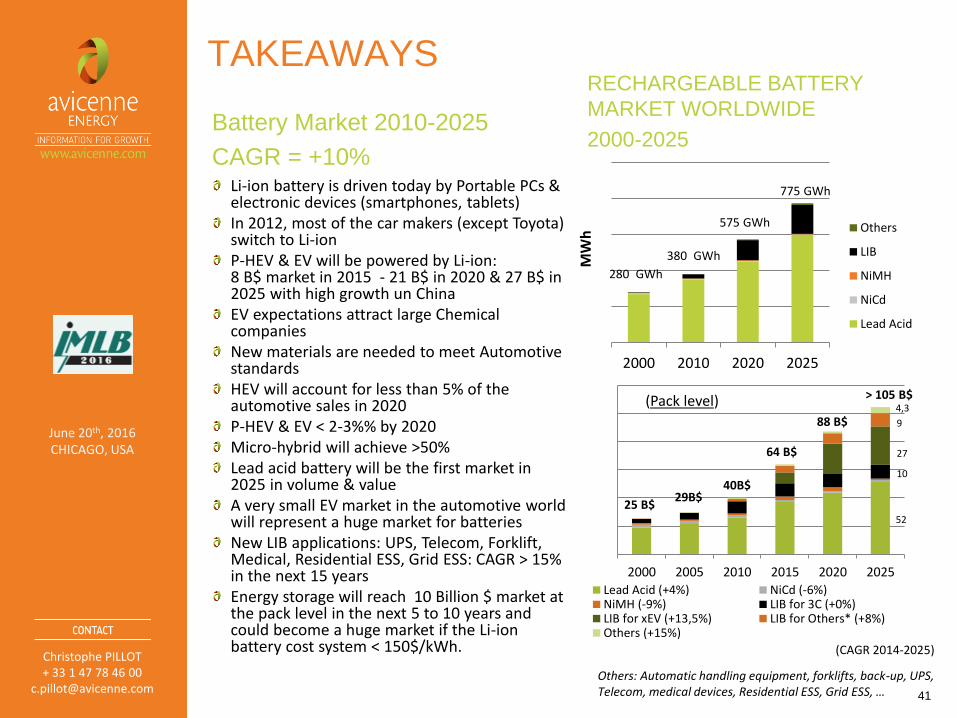
TAKEAWAYS
41
Others: Automatic handling equipment, forklifts, back-up, UPS, Telecom, medical devices, Residential ESS, Grid ESS, …
Li-ion battery is driven today by Portable PCs & electronic devices (smartphones, tablets) In 2012, most of the car makers (except Toyota) switch to Li-ion P-HEV & EV will be powered by Li-ion: 8 B$ market in 2015 - 21 B$ in 2020 & 27 B$ in 2025 with high growth un China EV expectations attract large Chemical companies New materials are needed to meet Automotive standards HEV will account for less than 5% of the automotive sales in 2020 P-HEV & EV < 2-3%% by 2020 Micro-hybrid will achieve >50% Lead acid battery will be the first market in 2025 in volume & value A very small EV market in the automotive world will represent a huge market for batteries New LIB applications: UPS, Telecom, Forklift, Medical, Residential ESS, Grid ESS: CAGR > 15% in the next 15 years Energy storage will reach 10 Billion $ market at the pack level in the next 5 to 10 years and could become a huge market if the Li-ion battery cost system < 150$/kWh.
Battery Market 2010-2025
CAGR = +10%
RECHARGEABLE BATTERY
MARKET WORLDWIDE
2000-2025
2000 2010 2020 2025
MW
h Others
LIB
NiMH
NiCd
Lead Acid
2000 2005 2010 2015 2020 2025
Lead Acid (+4%) NiCd (-6%)NiMH (-9%) LIB for 3C (+0%)LIB for xEV (+13,5%) LIB for Others* (+8%)Others (+15%)
25 B$ 29B$
64 B$
88 B$
> 105 B$
280 GWh
380 GWh
575 GWh
775 GWh
9
10
52
(CAGR 2014-2025)
27
(Pack level) 4,3
40B$
Christophe PILLOT + 33 1 47 78 46 00
June 20th, 2016 CHICAGO, USA
THANK YOU
Christophe PILLOT
AVICENNE ENERGY
Phone: +33 1 47 78 46 00
Mobile: + 33 6 88 82 79 49
42