Embed Size (px)
Citation preview
# D ATA 2 0 1 5
# A L L A G E S
WifiUsername: Casa1537Password: Venue1537
Older people count: Making data fit for purpose in a rapidly ageing world
Session 1: Global data, demographic change and inequality
Chair: Danny Sriskandarajah, CIVICUS
Panellists: Sabina Alkire, OPHI
Edilberto Loaiza, UNFPAJane Scobie, HelpAge International
#DATA2015
#ALLAGES
WifiUsername: Casa1537Password: Venue1537
Session 1: Global data, demographic change and inequality
Chair: Danny Sriskandarajah, CIVICUS
Opening comments on importance of use of data by citizens of all ages. Introduction to first session and panellists.
#DATA2015
#ALLAGES
WifiUsername: Casa1537Password: Venue1537

Session 1: Global data, demographic change and inequality
Speaker:Sabina Alkire, OPHI
Multi-dimensional poverty measurement: What lessons can be drawn to improve age-disaggregated data?
#DATA2015
#ALLAGES
WifiUsername: Casa1537Password: Venue1537
Multidimensional Poverty
and Age-Disaggregated data
Sabina Alkire, University of Oxford
HelpAge side event: Older People Count
Cartagena, 20 April 2015
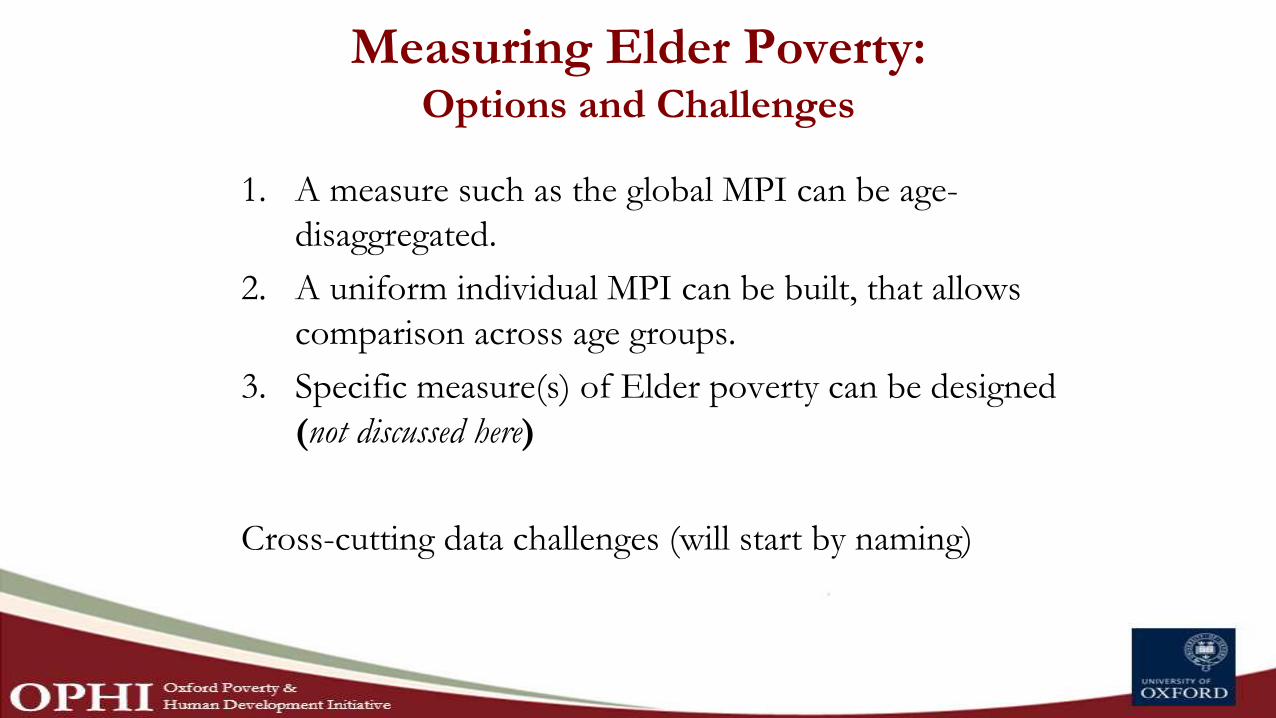
Measuring Elder Poverty:Options and Challenges
1. A measure such as the global MPI can be age-
disaggregated.
2. A uniform individual MPI can be built, that allows
comparison across age groups.
3. Specific measure(s) of Elder poverty can be designed
(not discussed here)
Cross-cutting data challenges (will start by naming)
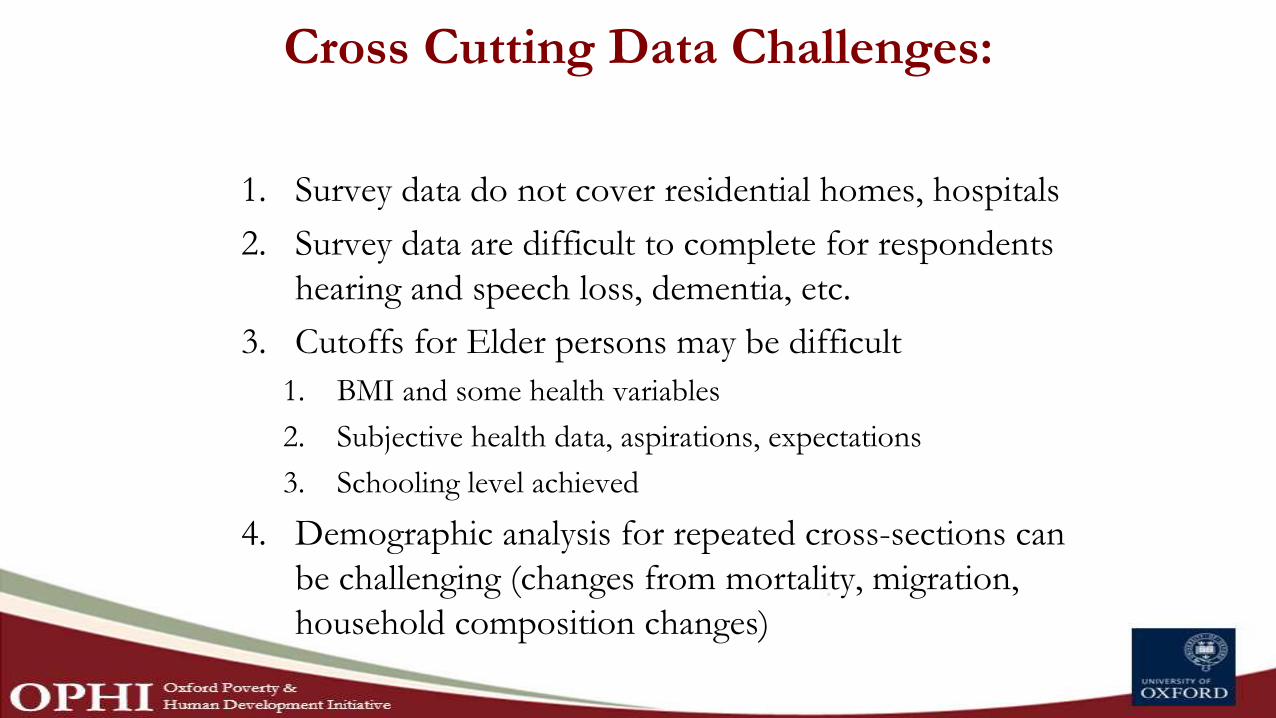
Cross Cutting Data Challenges:
1. Survey data do not cover residential homes, hospitals
2. Survey data are difficult to complete for respondents
hearing and speech loss, dementia, etc.
3. Cutoffs for Elder persons may be difficult
1. BMI and some health variables
2. Subjective health data, aspirations, expectations
3. Schooling level achieved
4. Demographic analysis for repeated cross-sections can
be challenging (changes from mortality, migration,
household composition changes)

Option 1
Age-disaggregated
Global (or national) MPI
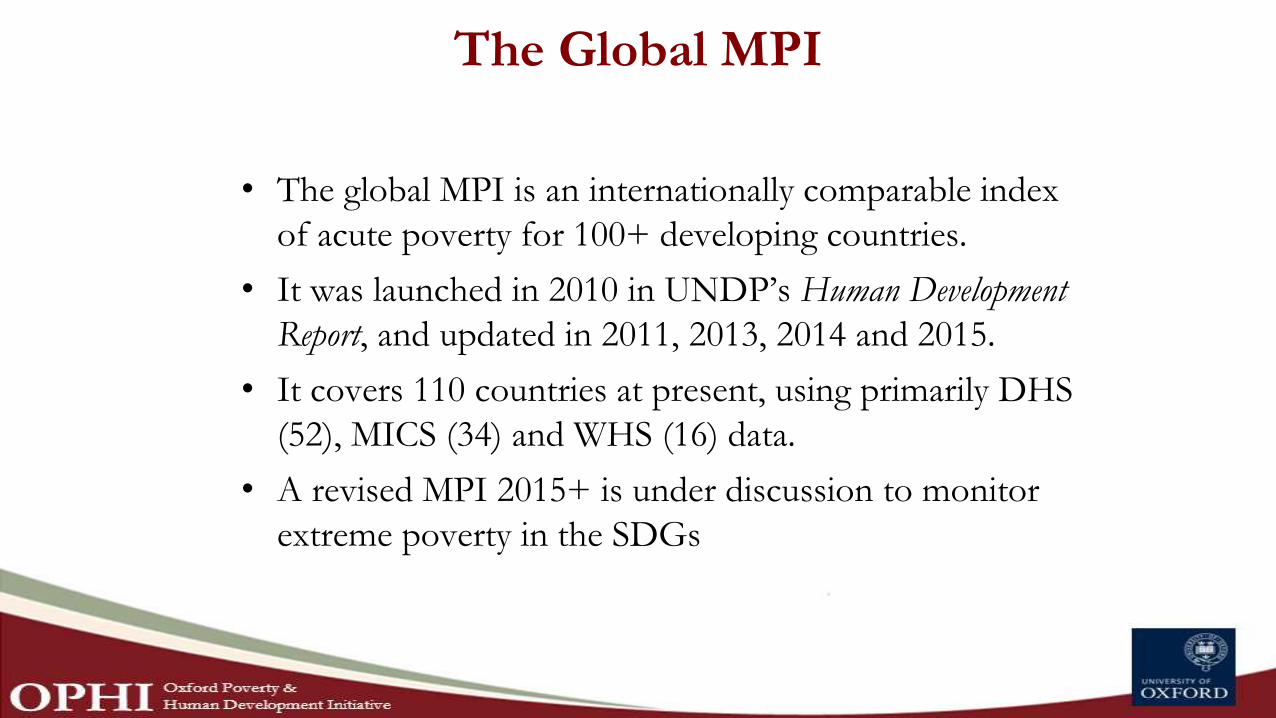
The Global MPI
• The global MPI is an internationally comparable index
of acute poverty for 100+ developing countries.
• It was launched in 2010 in UNDP’s Human Development
Report, and updated in 2011, 2013, 2014 and 2015.
• It covers 110 countries at present, using primarily DHS
(52), MICS (34) and WHS (16) data.
• A revised MPI 2015+ is under discussion to monitor
extreme poverty in the SDGs
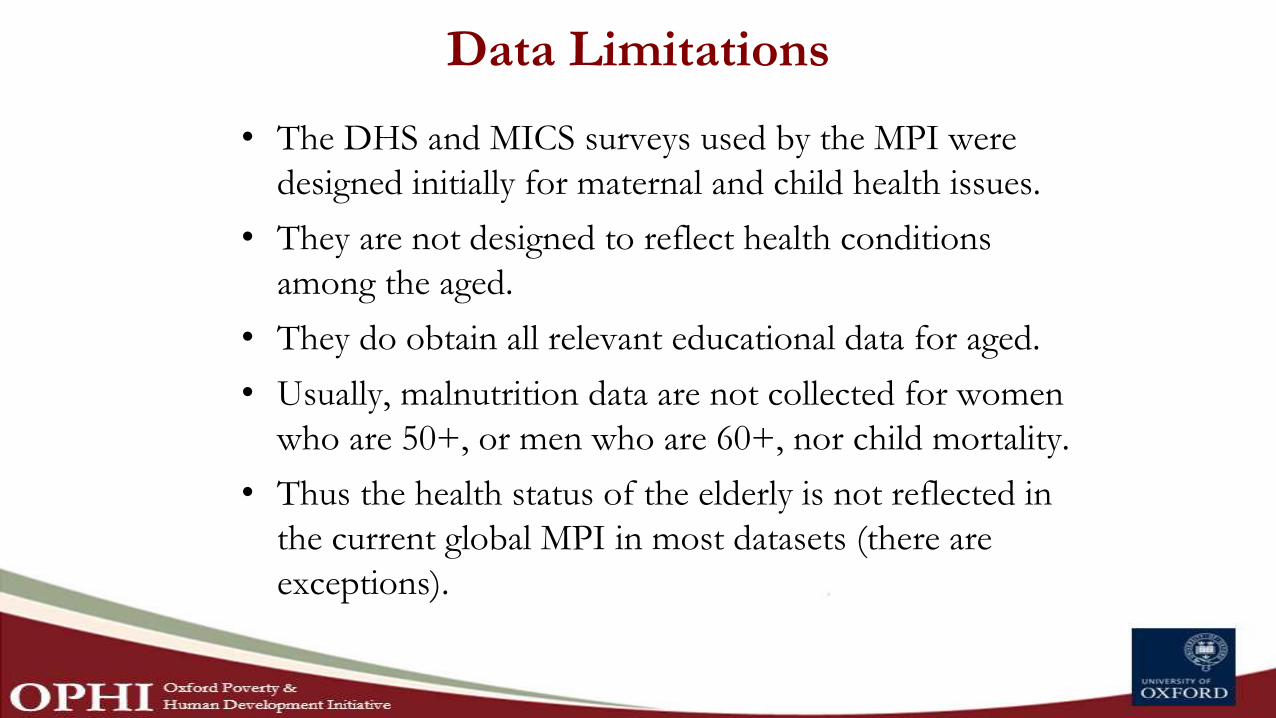
Data Limitations
• The DHS and MICS surveys used by the MPI were
designed initially for maternal and child health issues.
• They are not designed to reflect health conditions
among the aged.
• They do obtain all relevant educational data for aged.
• Usually, malnutrition data are not collected for women
who are 50+, or men who are 60+, nor child mortality.
• Thus the health status of the elderly is not reflected in
the current global MPI in most datasets (there are
exceptions).
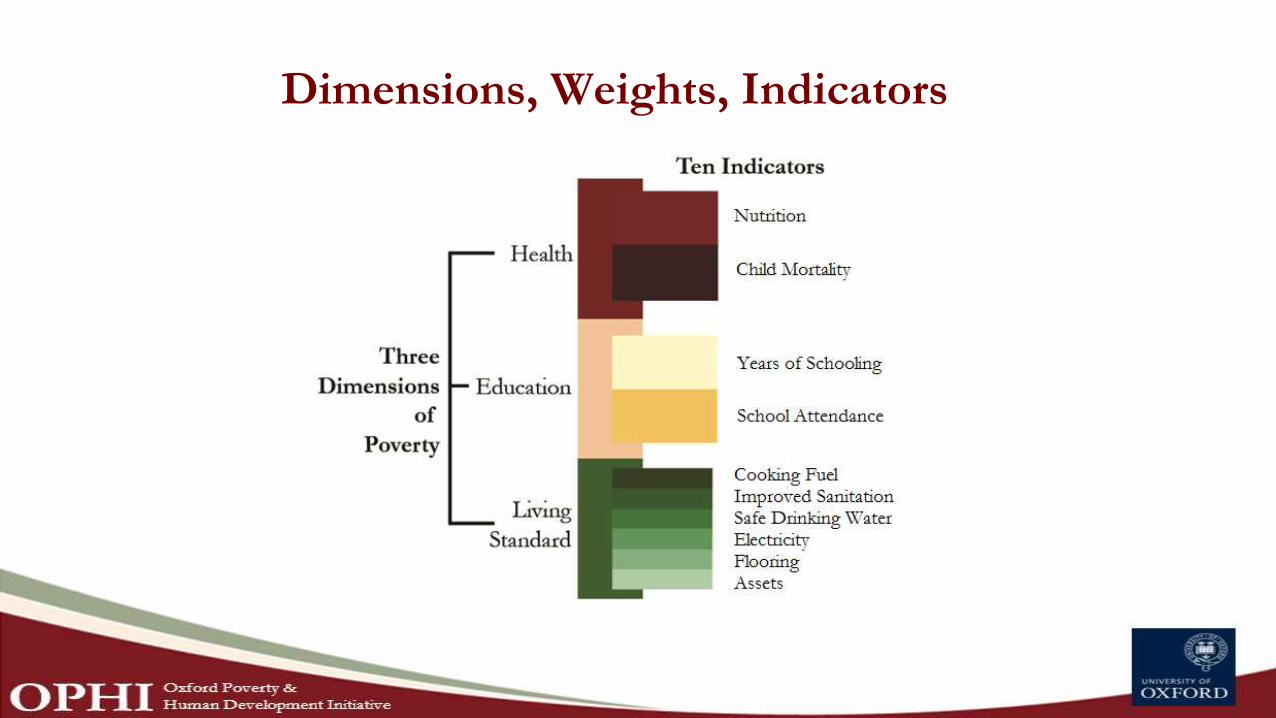
Dimensions, Weights, Indicators
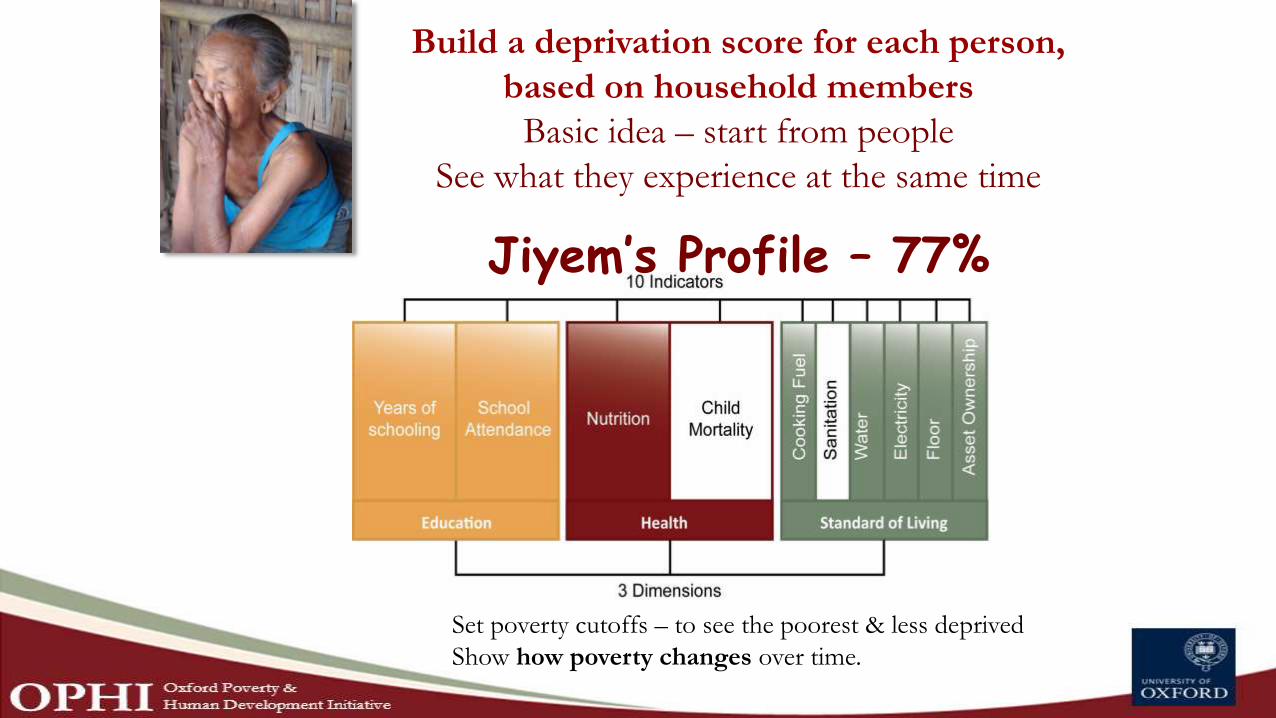
Build a deprivation score for each person,
based on household members
Basic idea – start from people
See what they experience at the same time
Jiyem’s Profile – 77%
Set poverty cutoffs – to see the poorest & less deprived
Show how poverty changes over time.
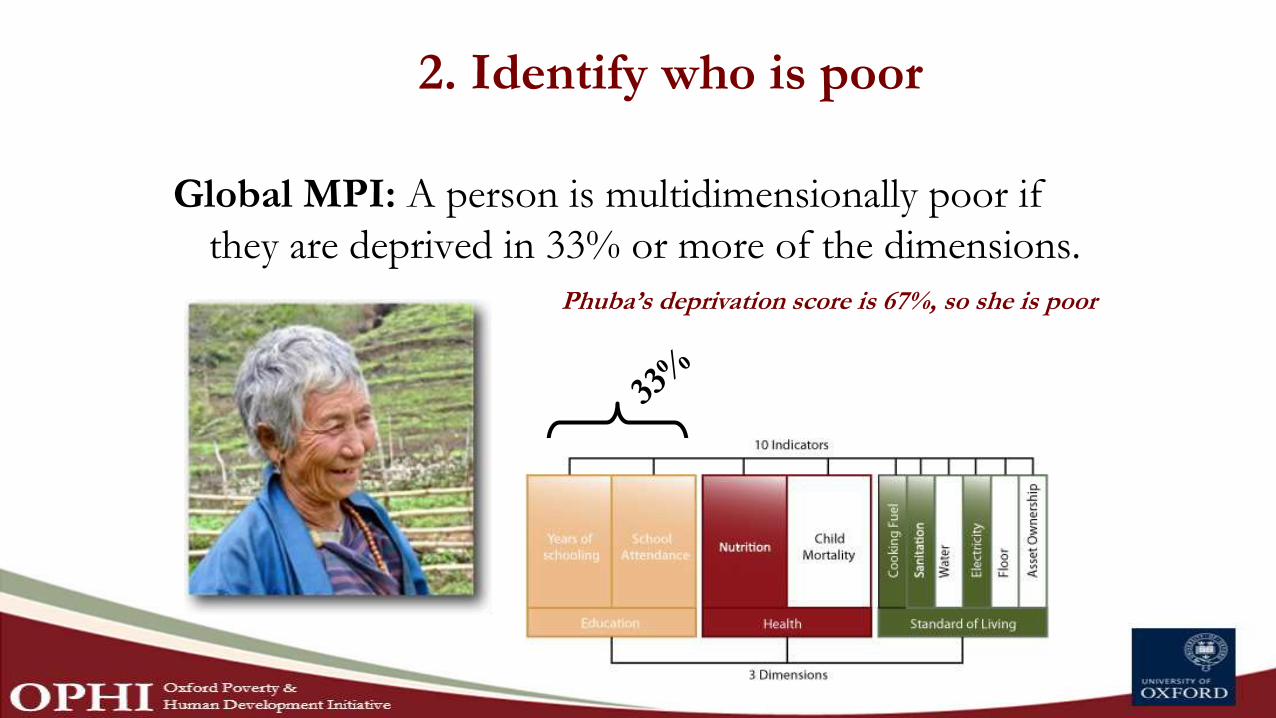
2. Identify who is poor
Global MPI: A person is multidimensionally poor if
they are deprived in 33% or more of the dimensions.
Phuba’s deprivation score is 67%, so she is poor
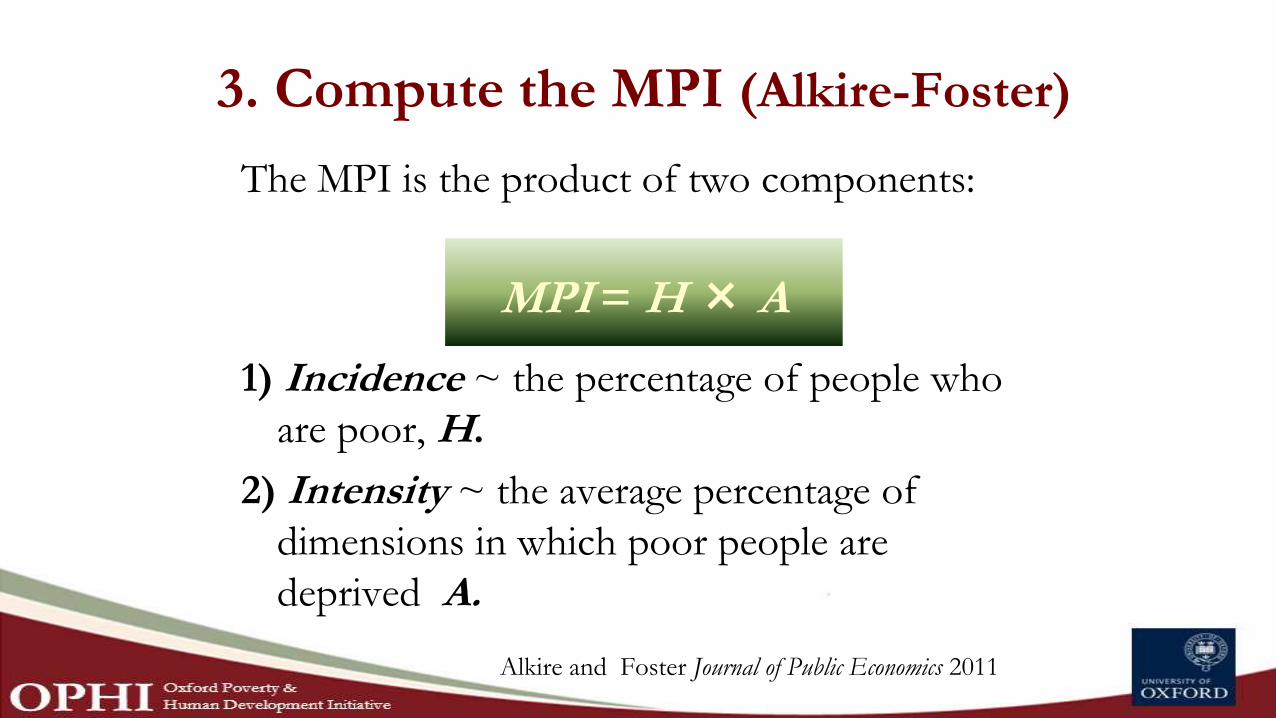
3. Compute the MPI (Alkire-Foster)
The MPI is the product of two components:
1) Incidence ~ the percentage of people who
are poor, H.
2) Intensity ~ the average percentage of
dimensions in which poor people are
deprived A.
MPI = H× A
Alkire and Foster Journal of Public Economics 2011
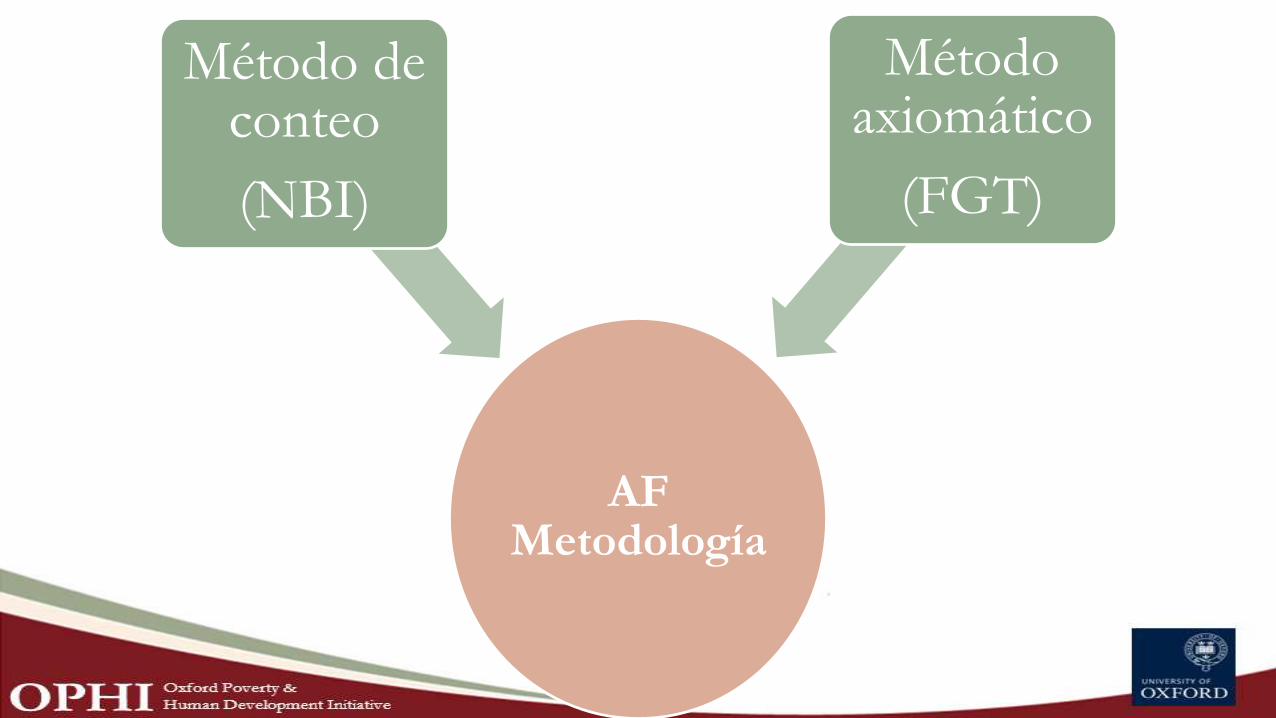
AF Metodología
Método de conteo
(NBI)
Método axiomático
(FGT)
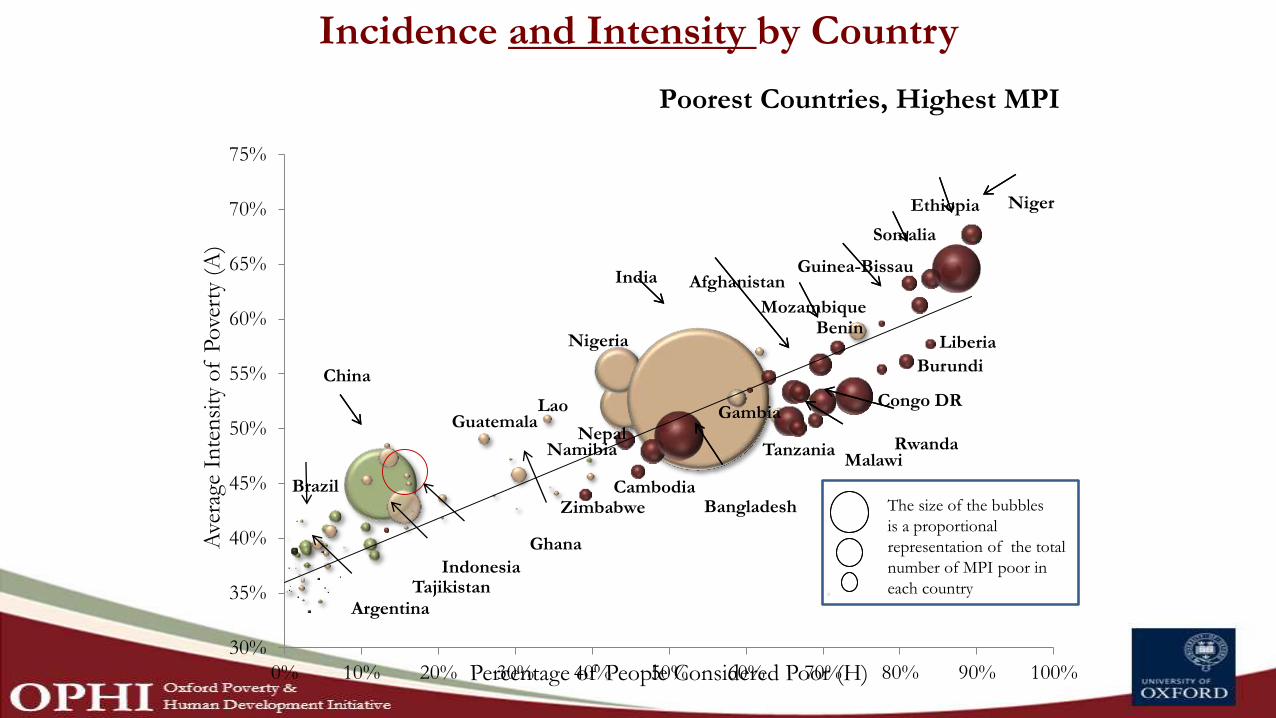
Incidence and Intensity by Country
Namibia
Brazil
Argentina
Indonesia
Guatemala
Ghana
Lao
Nigeria
Tajikistan
ZimbabweCambodia
Nepal
Bangladesh
Gambia
TanzaniaMalawi
Rwanda
Afghanistan
Mozambique
Congo DR
Benin
Burundi
Guinea-Bissau
Liberia
Somalia
Ethiopia Niger
30%
35%
40%
45%
50%
55%
60%
65%
70%
75%
0% 10% 20% 30% 40% 50% 60% 70% 80% 90% 100%
Ave
rage
In
ten
sity
of
Pove
rty
(A)
Percentage of People Considered Poor (H)
Poorest Countries, Highest MPI
China
India
The size of the bubbles
is a proportional
representation of the total
number of MPI poor in
each country
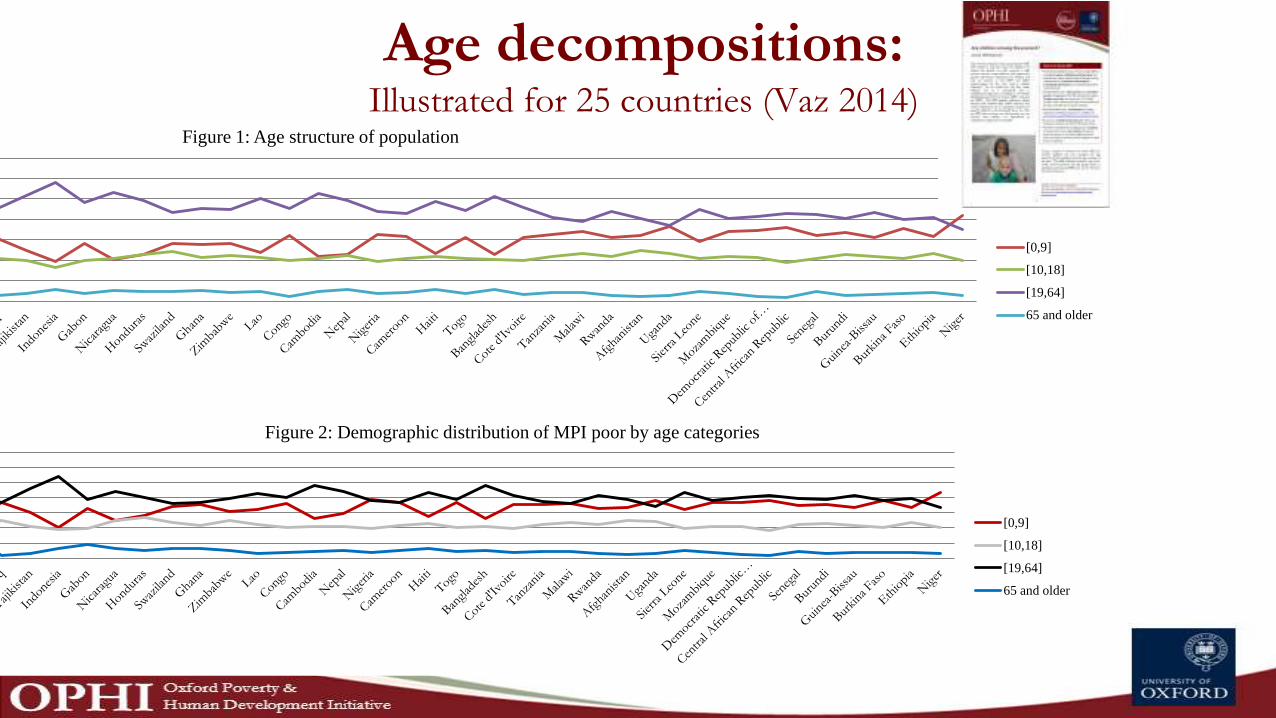
Age decompositions: Illustrated for 25 countries (Vaz 2014)
Figure 2: Demographic distribution of MPI poor by age categories
[0,9]
[10,18]
[19,64]
65 and older
Figure 1: Age structure of population
[0,9]
[10,18]
[19,64]
65 and older
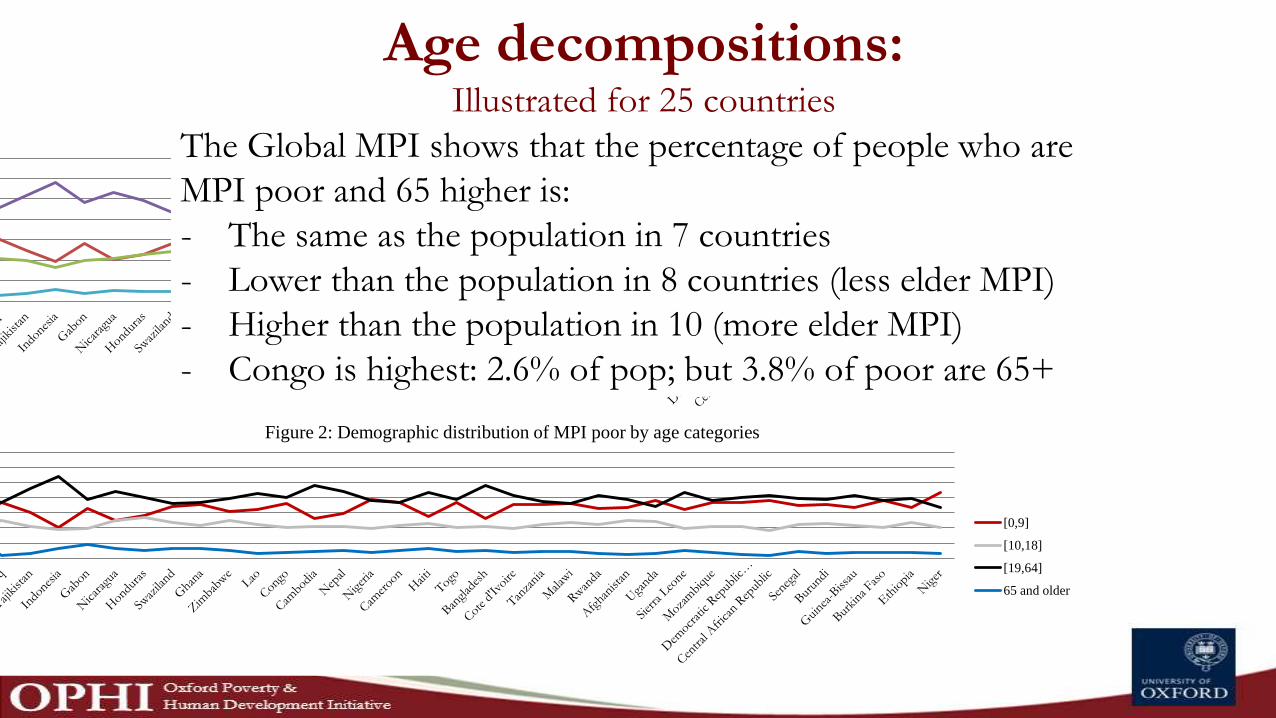
Age decompositions: Illustrated for 25 countries
Figure 2: Demographic distribution of MPI poor by age categories
[0,9]
[10,18]
[19,64]
65 and older
Figure 1: Age structure of population
[0,9]
[10,18]
[19,64]
65 and older
The Global MPI shows that the percentage of people who are
MPI poor and 65 higher is:
- The same as the population in 7 countries
- Lower than the population in 8 countries (less elder MPI)
- Higher than the population in 10 (more elder MPI)
- Congo is highest: 2.6% of pop; but 3.8% of poor are 65+
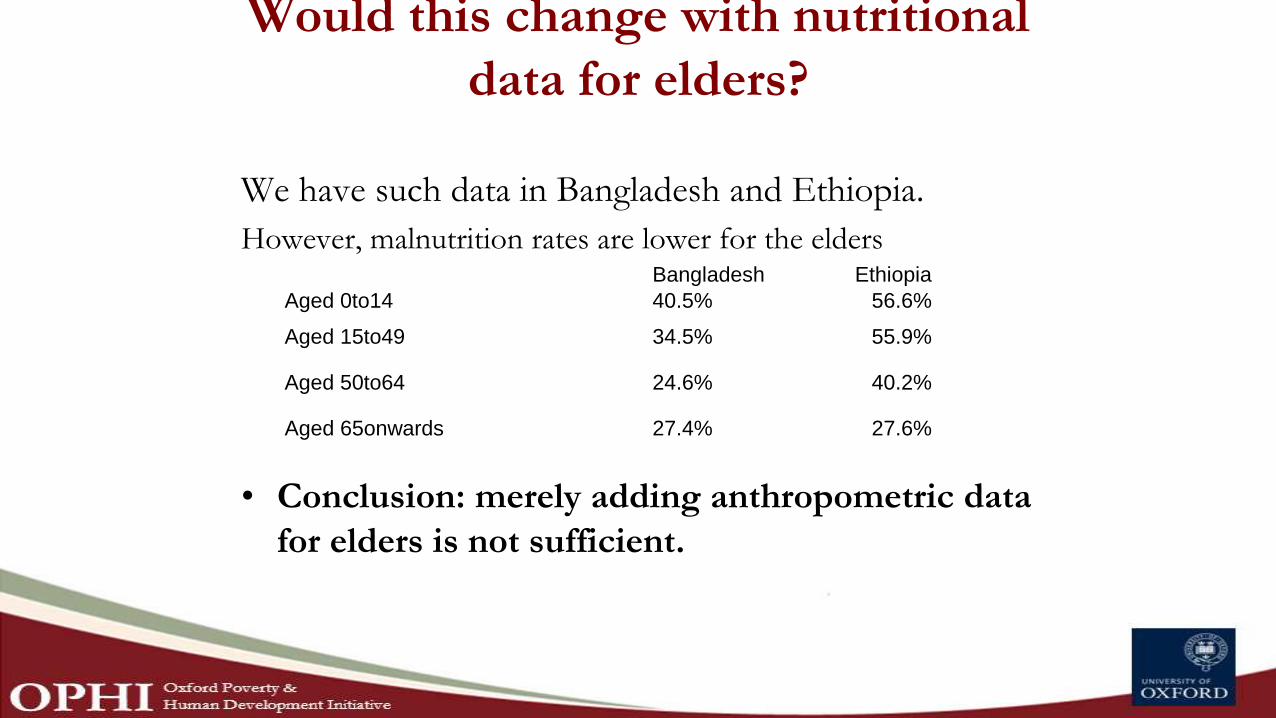
Would this change with nutritional
data for elders?
We have such data in Bangladesh and Ethiopia.
However, malnutrition rates are lower for the elders
• Conclusion: merely adding anthropometric data
for elders is not sufficient.
Bangladesh Ethiopia
Aged 0to14 40.5% 56.6%
Aged 15to49 34.5% 55.9%
Aged 50to64 24.6% 40.2%
Aged 65onwards 27.4% 27.6%
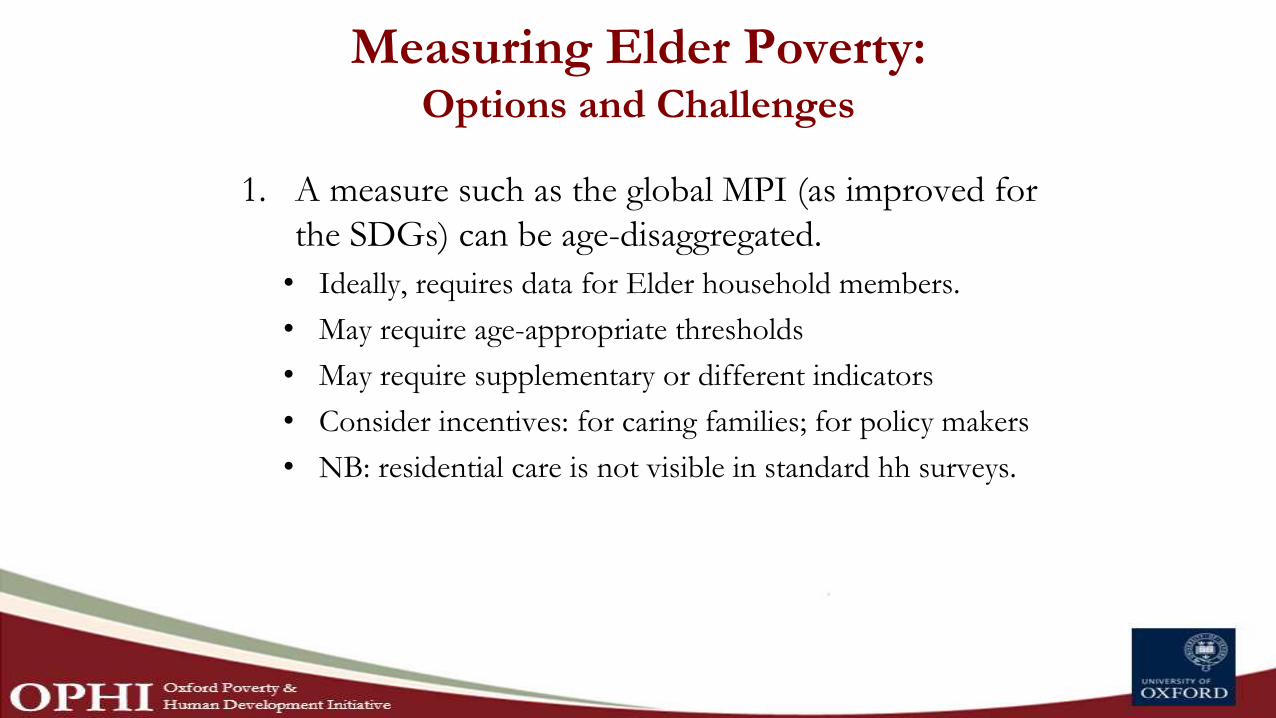
Measuring Elder Poverty:Options and Challenges
1. A measure such as the global MPI (as improved for
the SDGs) can be age-disaggregated.
• Ideally, requires data for Elder household members.
• May require age-appropriate thresholds
• May require supplementary or different indicators
• Consider incentives: for caring families; for policy makers
• NB: residential care is not visible in standard hh surveys.
Option 2
MPI based on individual’s
attainments
0.5
0.55
0.6
0.65
0.7
0.75
0.8
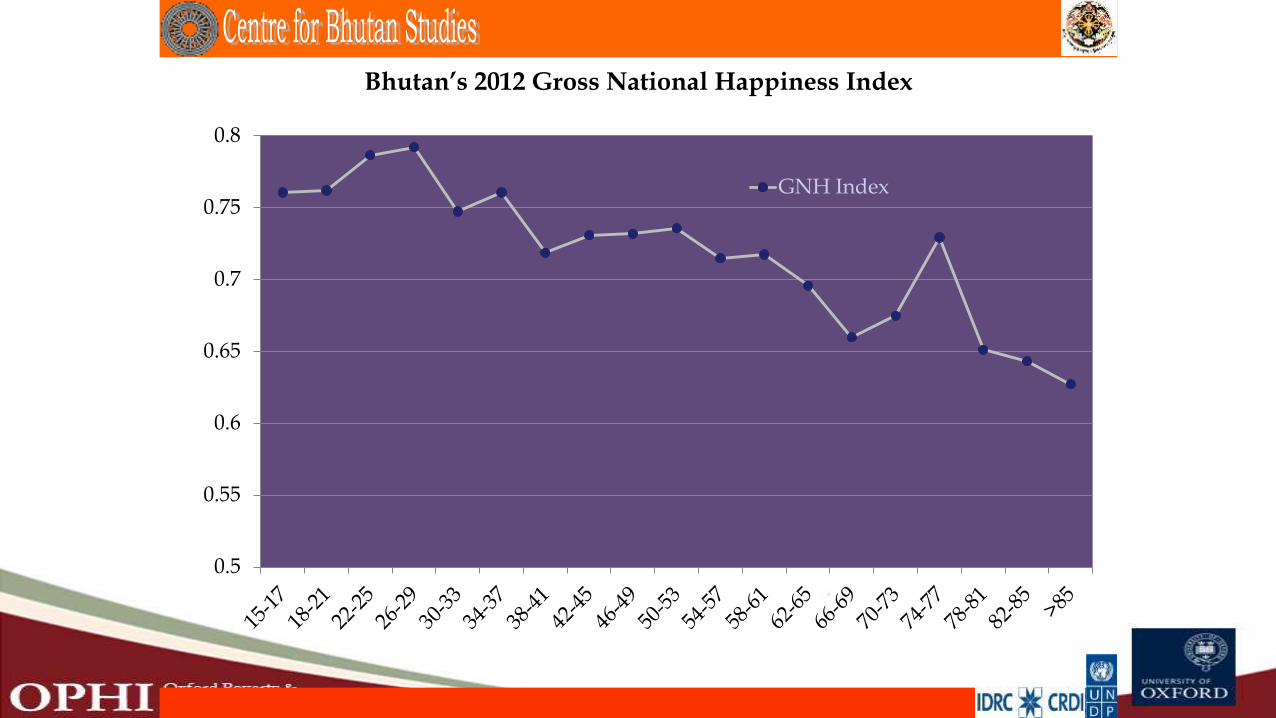
Bhutan’s 2012 Gross National Happiness Index
GNH Index
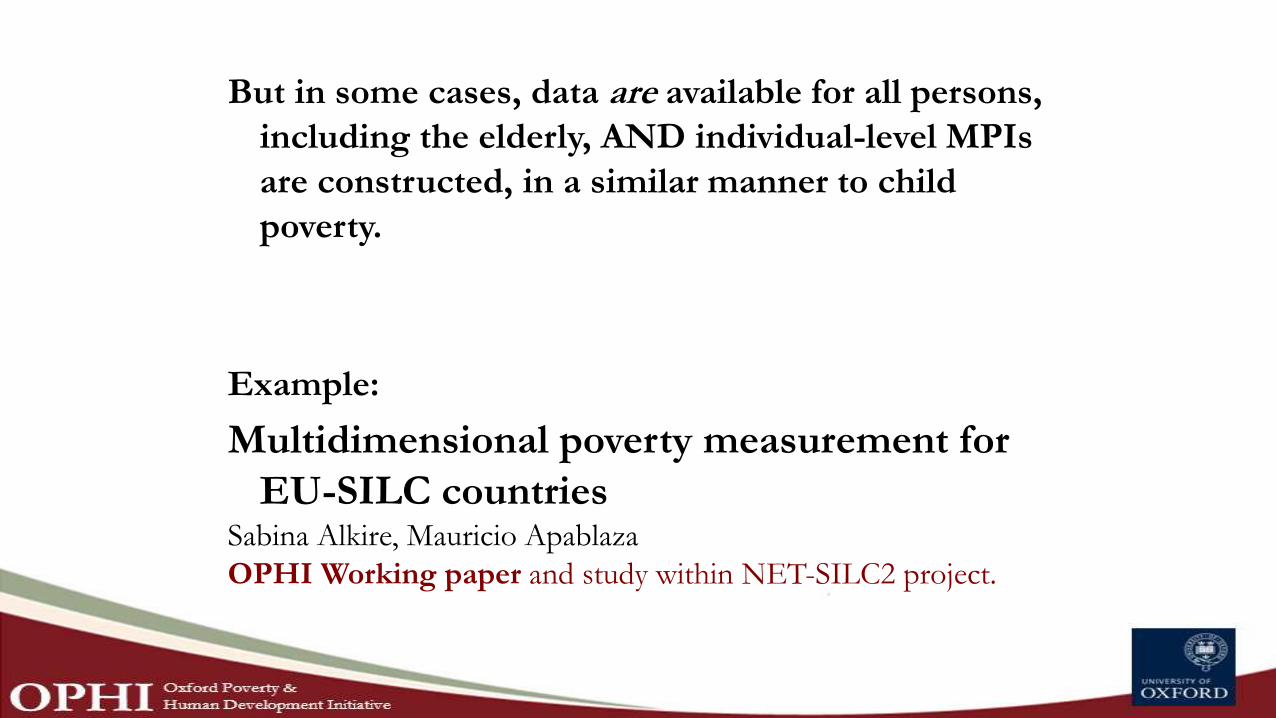
But in some cases, data are available for all persons,
including the elderly, AND individual-level MPIs
are constructed, in a similar manner to child
poverty.
Example:
Multidimensional poverty measurement for
EU-SILC countriesSabina Alkire, Mauricio Apablaza
OPHI Working paper and study within NET-SILC2 project.
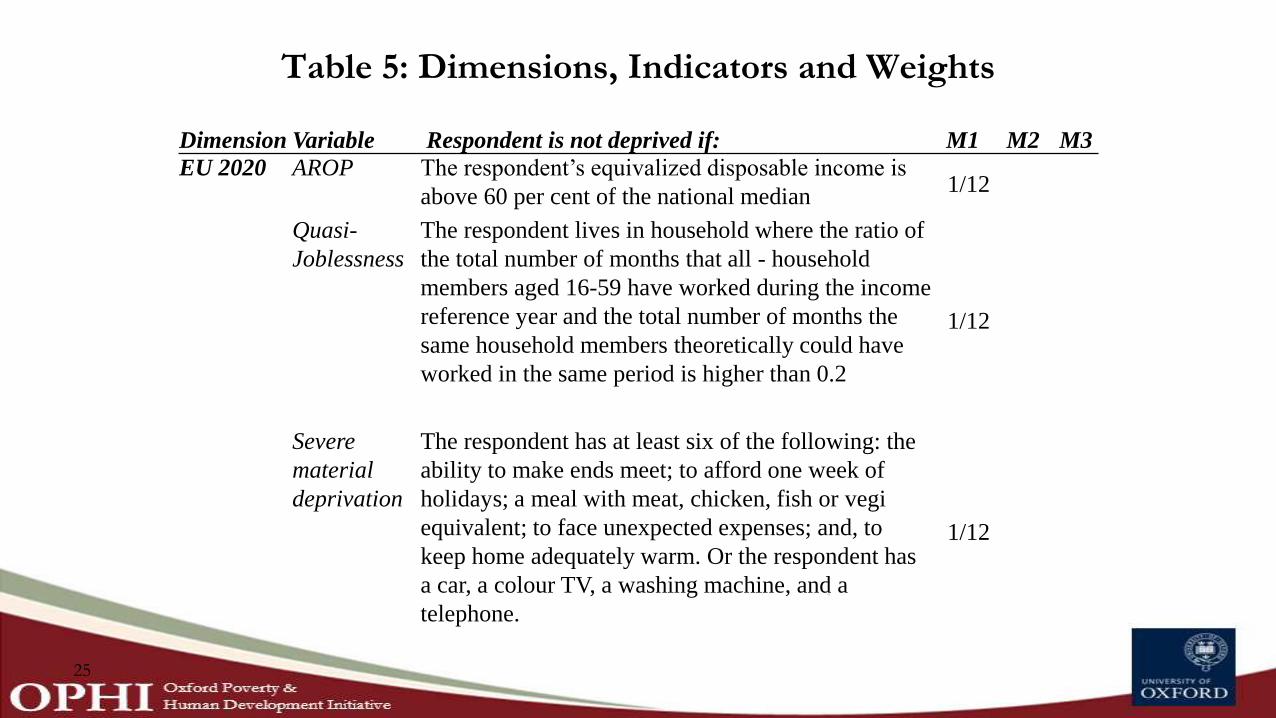
Table 5: Dimensions, Indicators and Weights
25
Dimension Variable Respondent is not deprived if: M1 M2 M3
EU 2020 AROP The respondent’s equivalized disposable income is
above 60 per cent of the national median1/12
Quasi-
Joblessness
The respondent lives in household where the ratio of
the total number of months that all - household
members aged 16-59 have worked during the income
reference year and the total number of months the
same household members theoretically could have
worked in the same period is higher than 0.2
1/12
Severe
material
deprivation
The respondent has at least six of the following: the
ability to make ends meet; to afford one week of
holidays; a meal with meat, chicken, fish or vegi
equivalent; to face unexpected expenses; and, to
keep home adequately warm. Or the respondent has
a car, a colour TV, a washing machine, and a
telephone.
1/12
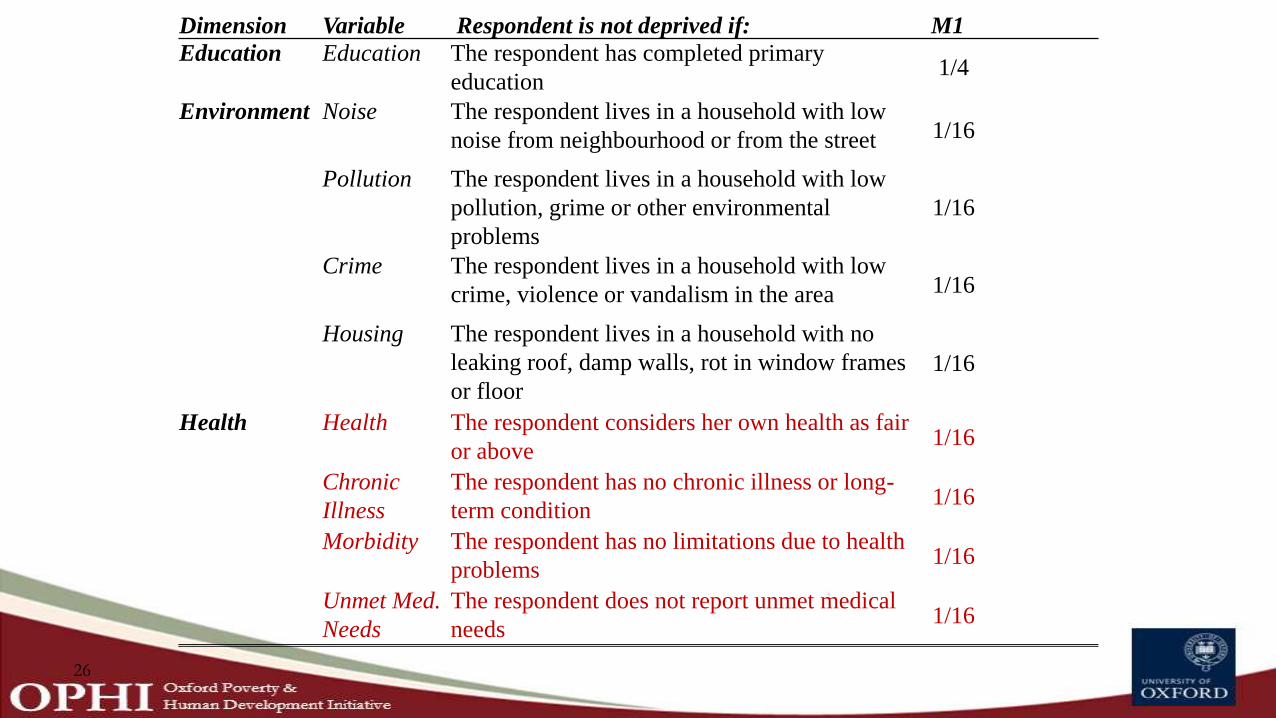
26
Dimension Variable Respondent is not deprived if: M1
Education Education The respondent has completed primary
education1/4
Environment Noise The respondent lives in a household with low
noise from neighbourhood or from the street 1/16
Pollution The respondent lives in a household with low
pollution, grime or other environmental
problems
1/16
Crime The respondent lives in a household with low
crime, violence or vandalism in the area 1/16
Housing The respondent lives in a household with no
leaking roof, damp walls, rot in window frames
or floor
1/16
Health Health The respondent considers her own health as fair
or above1/16
Chronic
Illness
The respondent has no chronic illness or long-
term condition1/16
Morbidity The respondent has no limitations due to health
problems1/16
Unmet Med.
Needs
The respondent does not report unmet medical
needs1/16
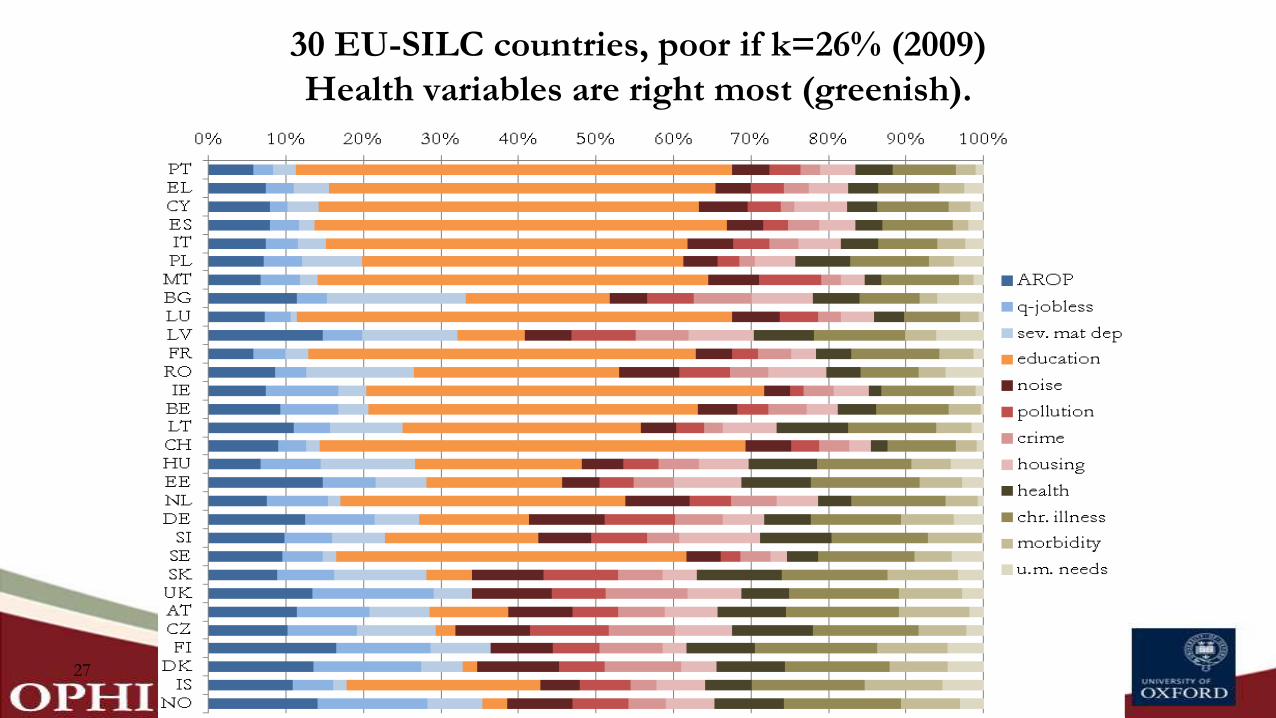
30 EU-SILC countries, poor if k=26% (2009)
Health variables are right most (greenish).
27
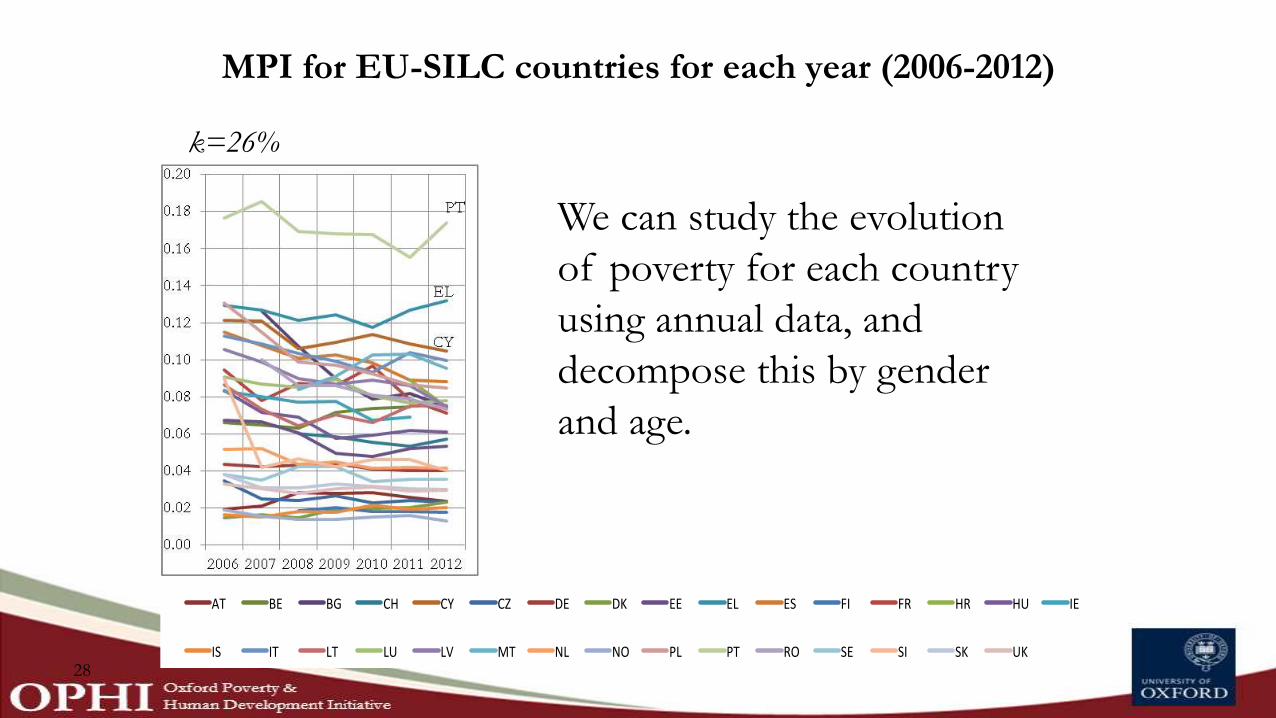
MPI for EU-SILC countries for each year (2006-2012)
28
0.00
0.02
0.04
0.06
0.08
0.10
0.12
0.14
0.16
0.18
0.20
2006 2007 2008 2009 2010 2011 2012
AT BE BG CH CY CZ DE DK EE EL ES FI FR HR HU IE
IS IT LT LU LV MT NL NO PL PT RO SE SI SK UK
k=26%
We can study the evolution
of poverty for each country
using annual data, and
decompose this by gender
and age.
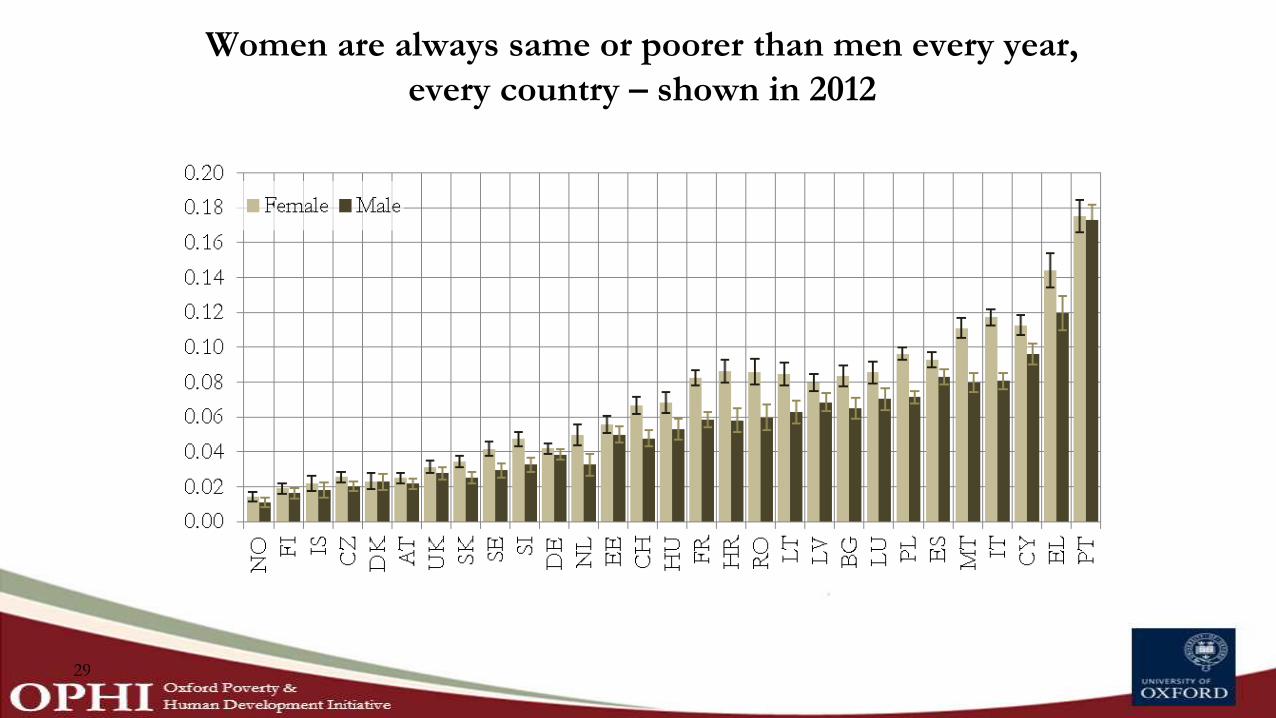
Women are always same or poorer than men every year,
every country – shown in 2012
29
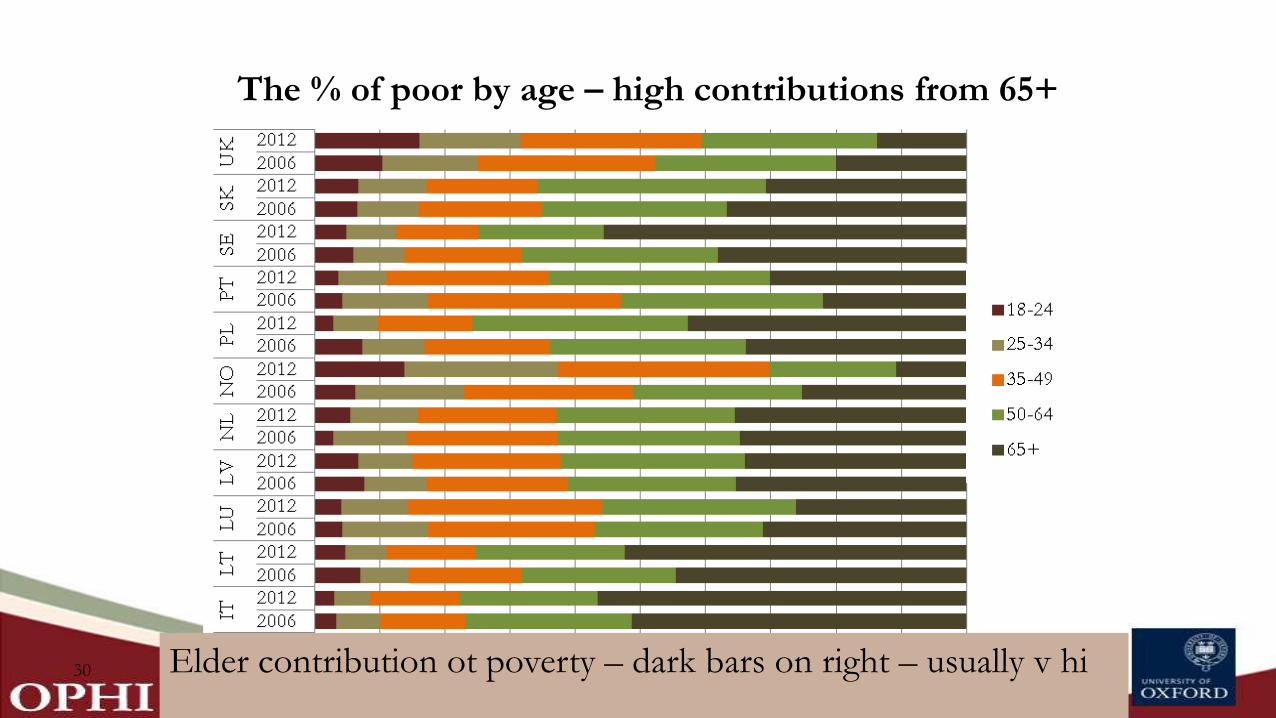
The % of poor by age – high contributions from 65+
30 Elder contribution ot poverty – dark bars on right – usually v hi
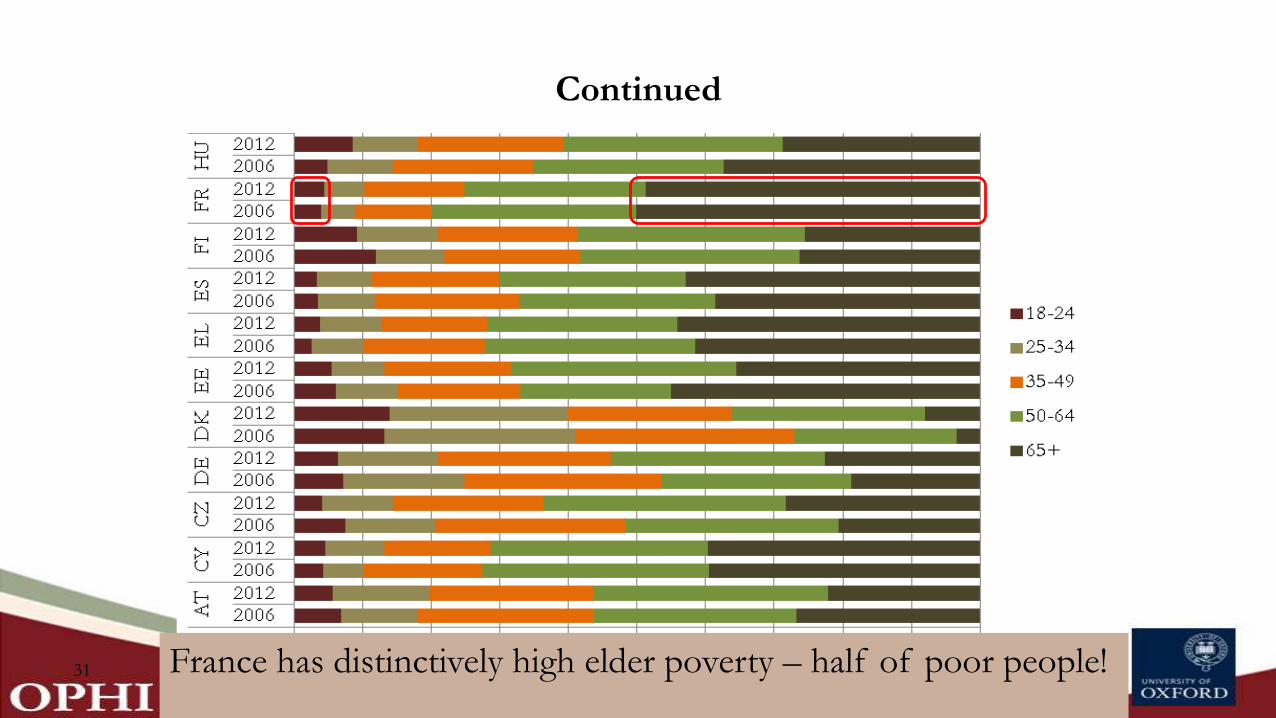
Continued
31 France has distinctively high elder poverty – half of poor people!
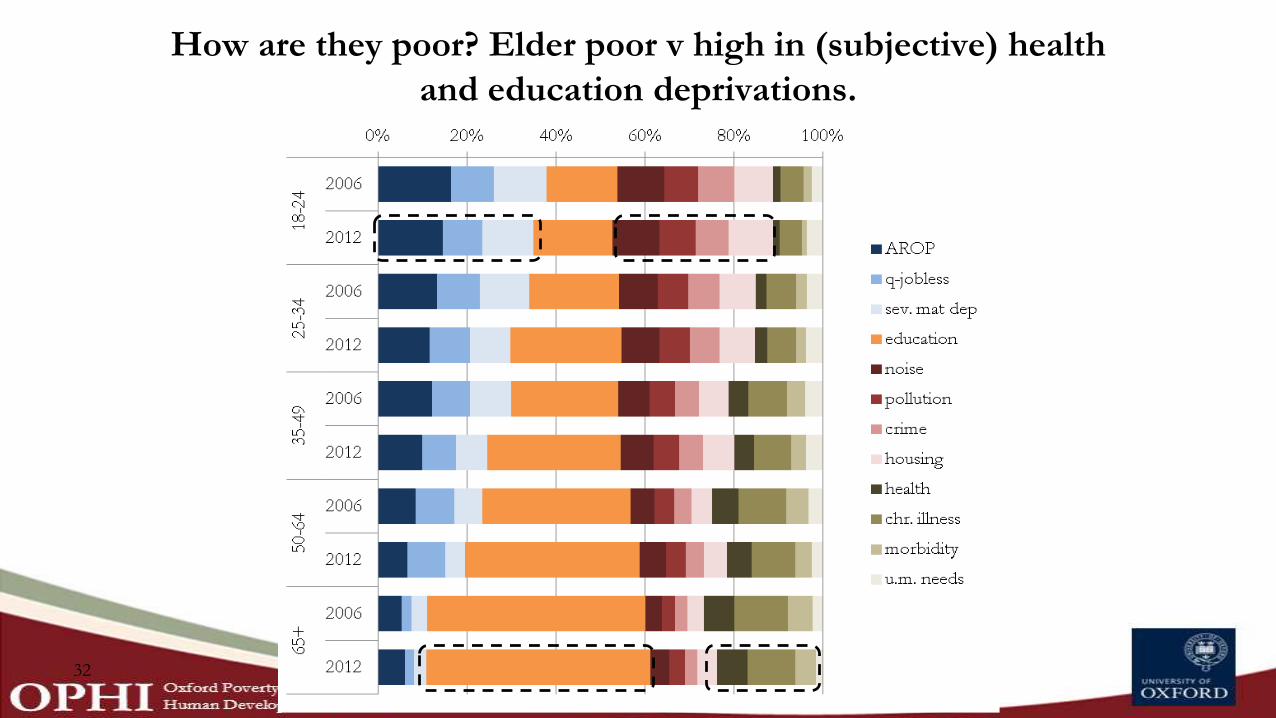
How are they poor? Elder poor v high in (subjective) health
and education deprivations.
32
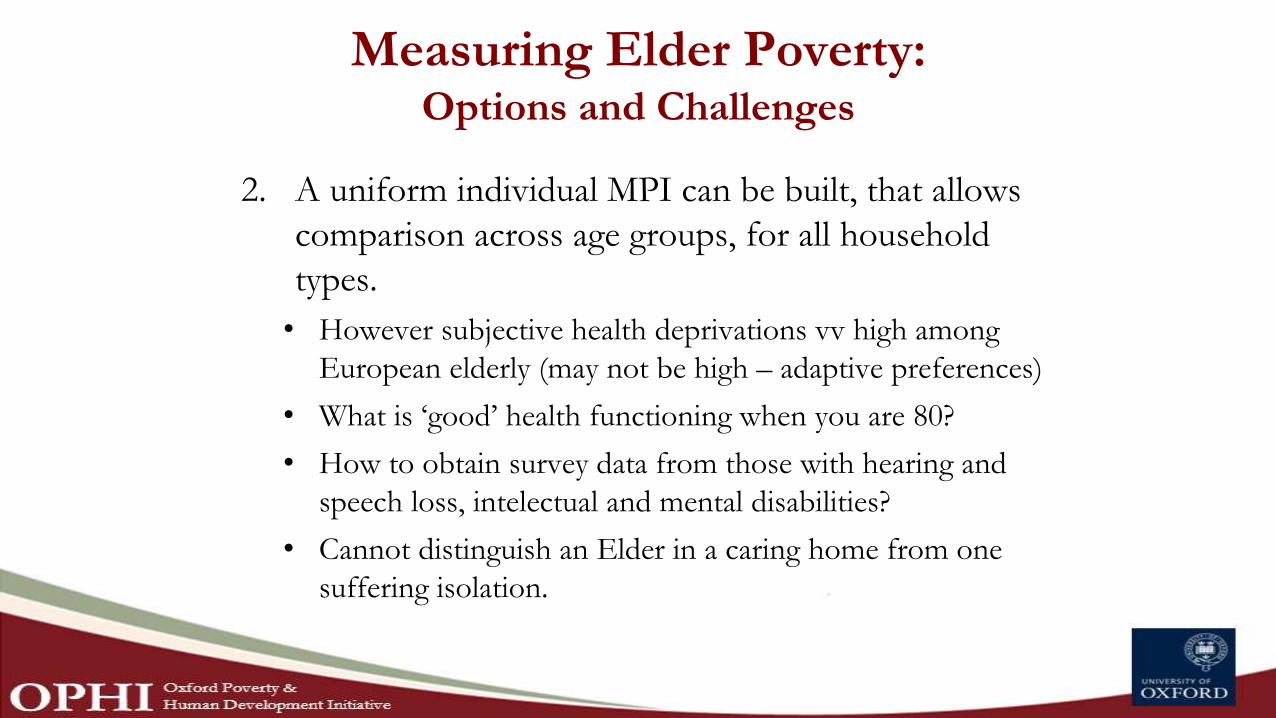
Measuring Elder Poverty:Options and Challenges
2. A uniform individual MPI can be built, that allows
comparison across age groups, for all household
types.
• However subjective health deprivations vv high among
European elderly (may not be high – adaptive preferences)
• What is ‘good’ health functioning when you are 80?
• How to obtain survey data from those with hearing and
speech loss, intelectual and mental disabilities?
• Cannot distinguish an Elder in a caring home from one
suffering isolation.
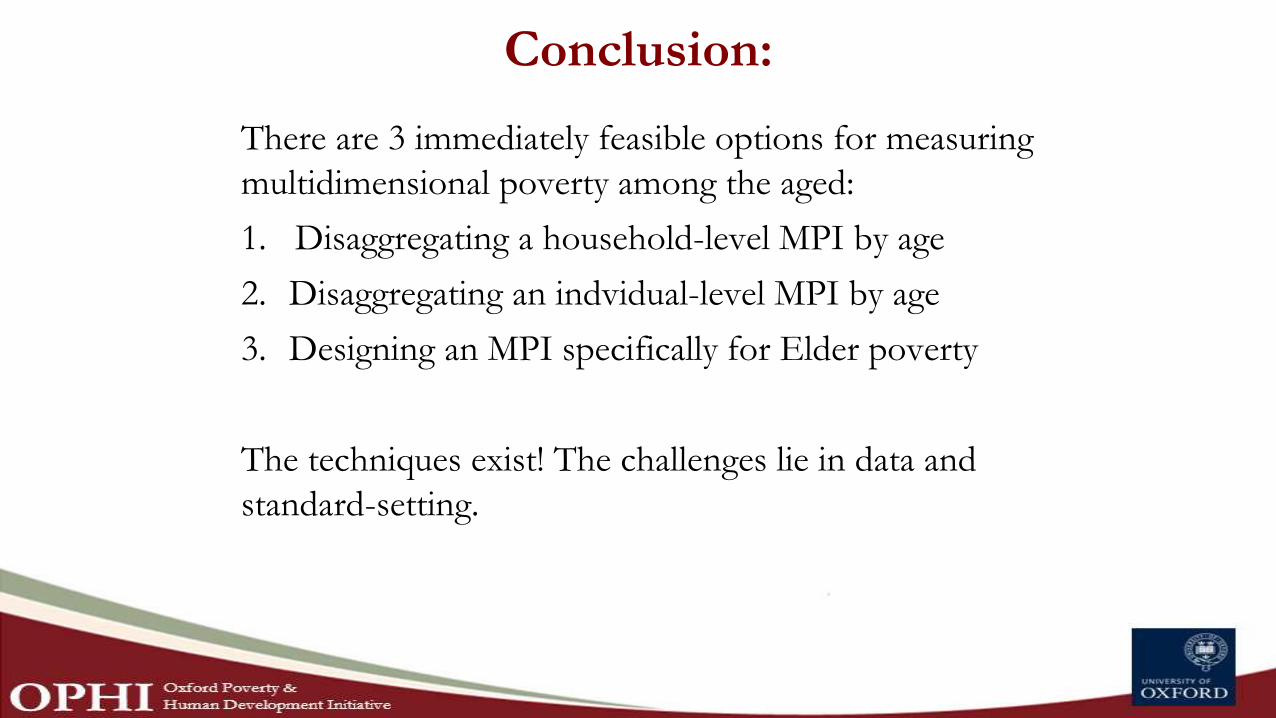
Conclusion:
There are 3 immediately feasible options for measuring
multidimensional poverty among the aged:
1. Disaggregating a household-level MPI by age
2. Disaggregating an indvidual-level MPI by age
3. Designing an MPI specifically for Elder poverty
The techniques exist! The challenges lie in data and
standard-setting.
Session 1: Global data, demographic change and inequality
Speaker: Edilberto Loaiza, UNFPA
Population dynamics and SDGs in the context of the "data revolution".
#DATA2015
#ALLAGES
WifiUsername: Casa1537Password: Venue1537
Population Dynamics and SDGs in the Context of the Data Revolution
Edilberto Loaiza, Ph.D.
UNFPA, New York
Global Data, Demographic Change and Inequality
20th April 2015 , Cartagena
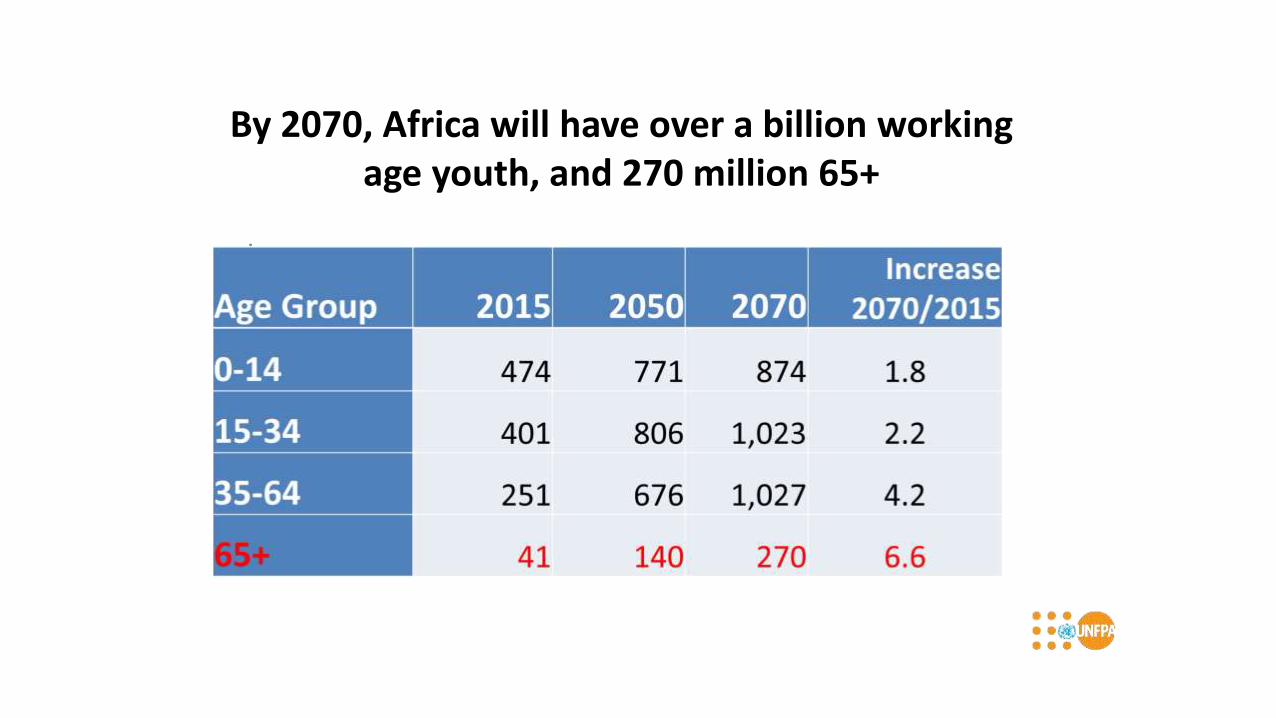
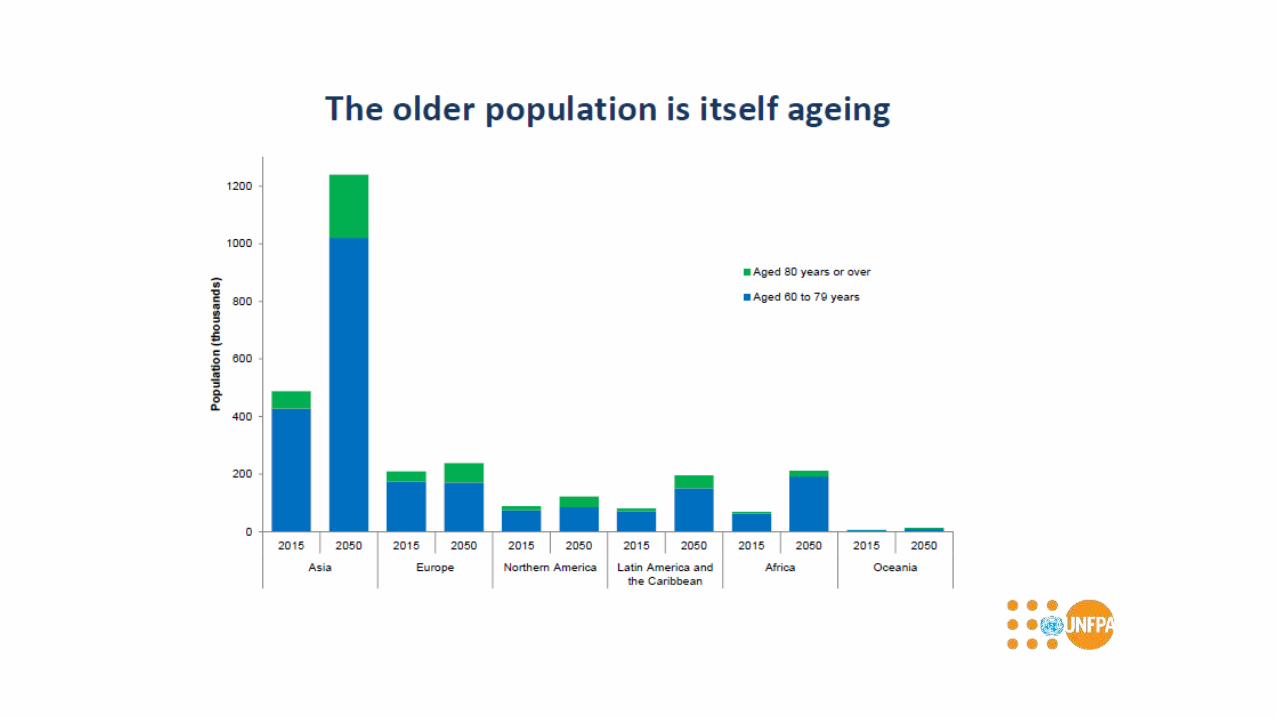
By 2070, Africa will have over a billion working age youth, and 270 million 65+
j
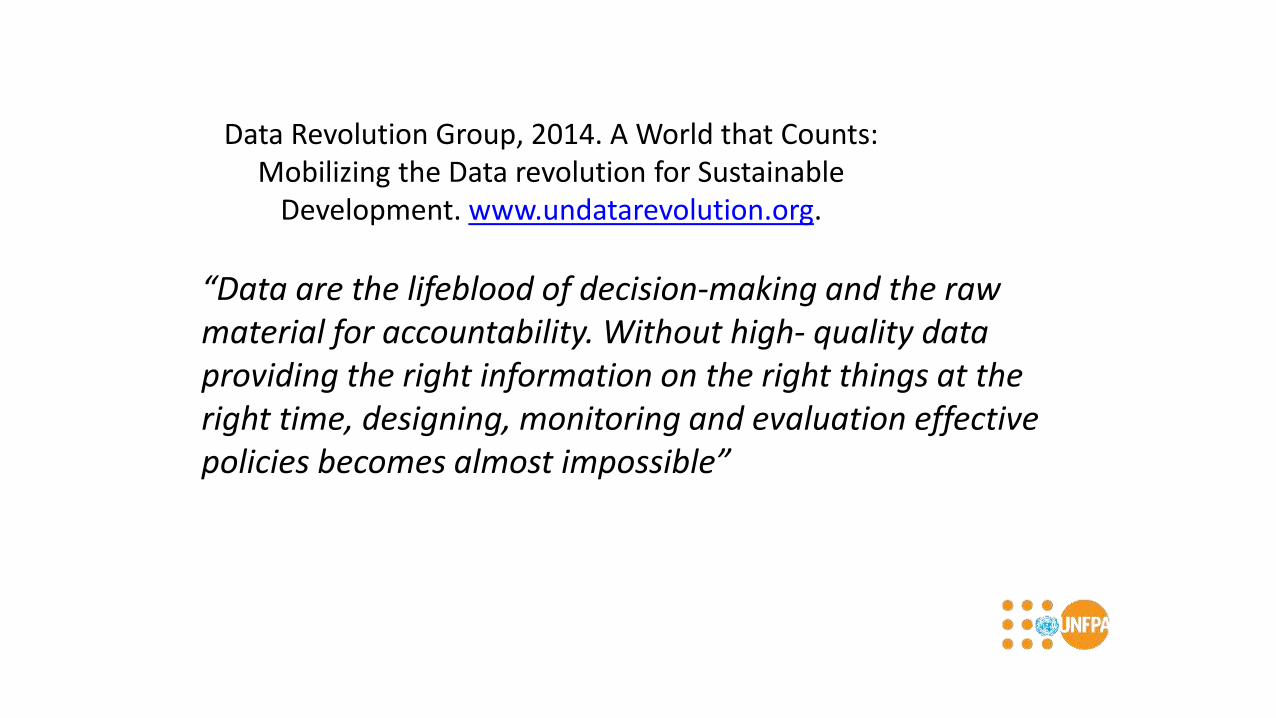
Data Revolution Group, 2014. A World that Counts: Mobilizing the Data revolution for Sustainable
Development. www.undatarevolution.org.
“Data are the lifeblood of decision-making and the raw material for accountability. Without high- quality data providing the right information on the right things at the right time, designing, monitoring and evaluation effective policies becomes almost impossible”
What is the data revolution?
• An explosion in the volume of data, the speed with which data are produced, the number of producers of data, the dissemination of data, and the range of things on which there is data, coming from new technologies such as mobile phones and the “internet of things”, and from other sources, such as qualitative data, citizen-generated data and perceptions data;
• A growing demand for data from all parts of society
What is the DR for Sustainable Development?
• The integration of these new data with traditional data to produce high-quality information that is more detailed, timely and relevant for many purposes and users, especially to foster and monitor sustainable development;
• The increase in the usefulness of data through a much greater degree of openness and transparency, avoiding invasion of privacy and abuse of human rights from misuse of data on individuals and groups, and minimising inequality in production, access to and use of data;
• Ultimately, more empowered people, better policies, better decisions and greater participation and accountability, leading to better outcomes for people and the planet.
Challenges
• MDG and SDG processes data and knowledge gaps;
• Not having enough high-quality data ;
• Data are not used or usable ;
• Capacity of agencies with a mandate to collect public information;
• Human and financial resources
Opportunities (1)
SDGs addressing these challenges
Particularly on Goals: 1, 2, 3, 4, 5, 8, 16 and 17.
SDGs are broader in scope and and universal.
SDGs addresses economic, social and environment
Emphasis: inclusion, participation: no one behind.
Accountability = additional data will be needed
NSSs and needed resources (human and financial)
The data revolution is an opportunity
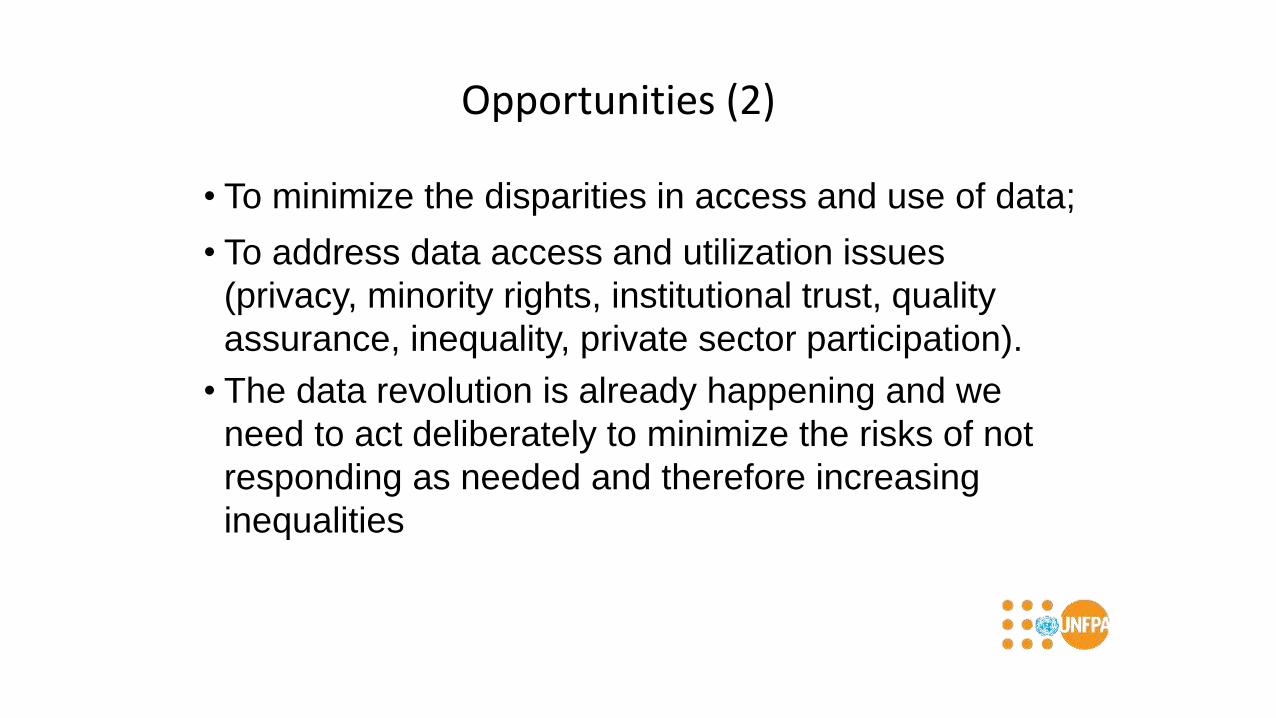
Opportunities (2)
• To minimize the disparities in access and use of data;
• To address data access and utilization issues
(privacy, minority rights, institutional trust, quality
assurance, inequality, private sector participation).
• The data revolution is already happening and we
need to act deliberately to minimize the risks of not
responding as needed and therefore increasing
inequalities
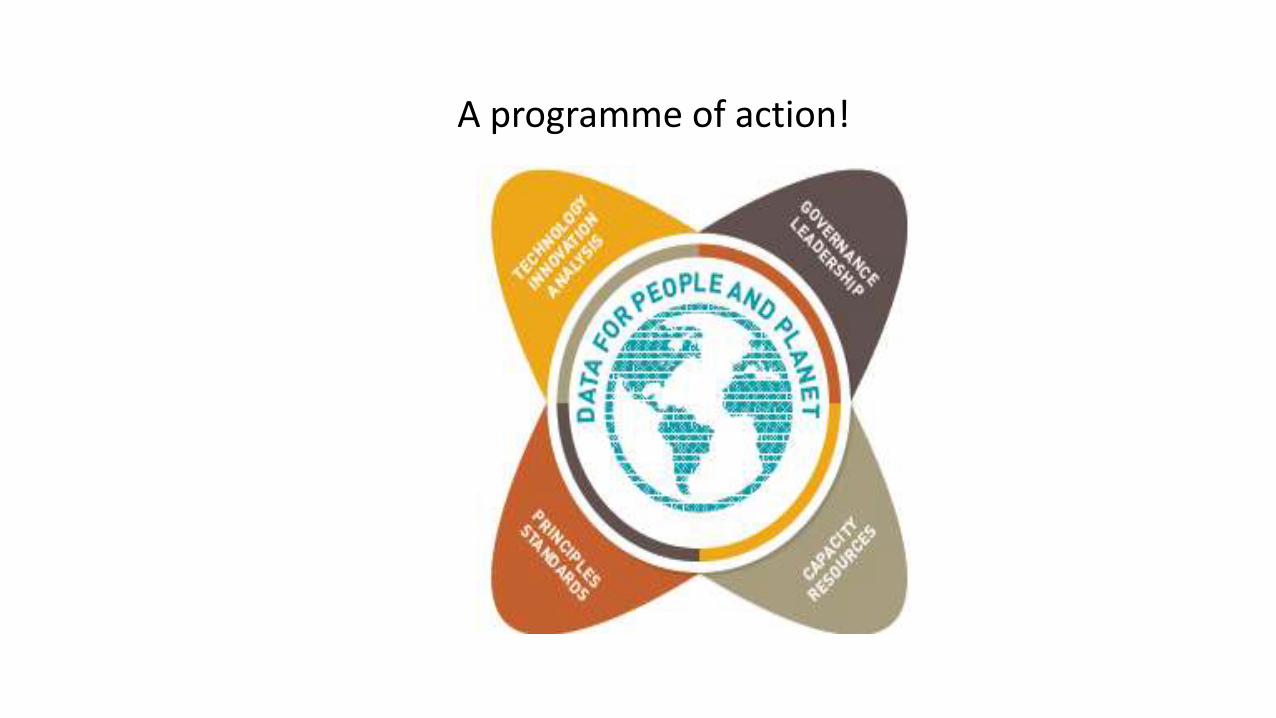
A programme of action!

Session 1: Global data, demographic change and inequality
Speaker: Jane Scobie, HelpAge International
Global AgeWatch Index and the invisibility of data on older people.
#DATA2015
#ALLAGES
WifiUsername: Casa1537Password: Venue1537
Global AgeWatch Index
Invisibility of data on older people
Jane Scobie, HelpAge International [email protected]
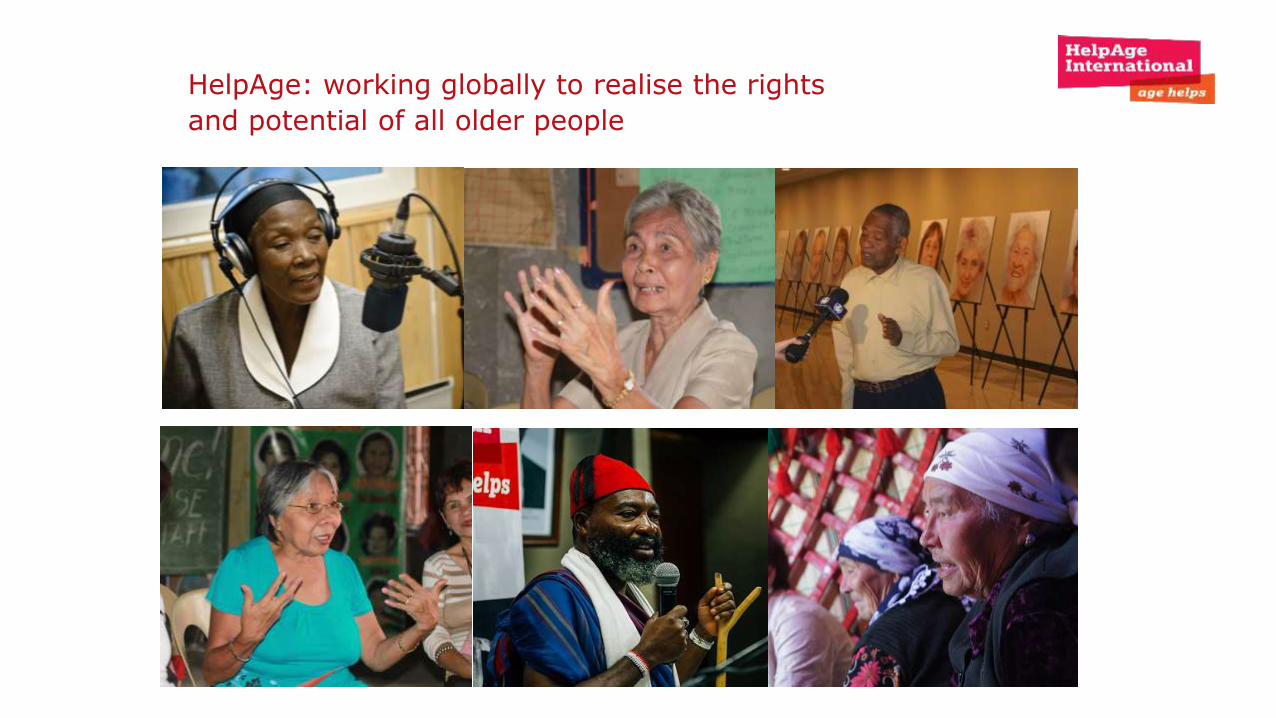
HelpAge: working globally to realise the rights
and potential of all older people
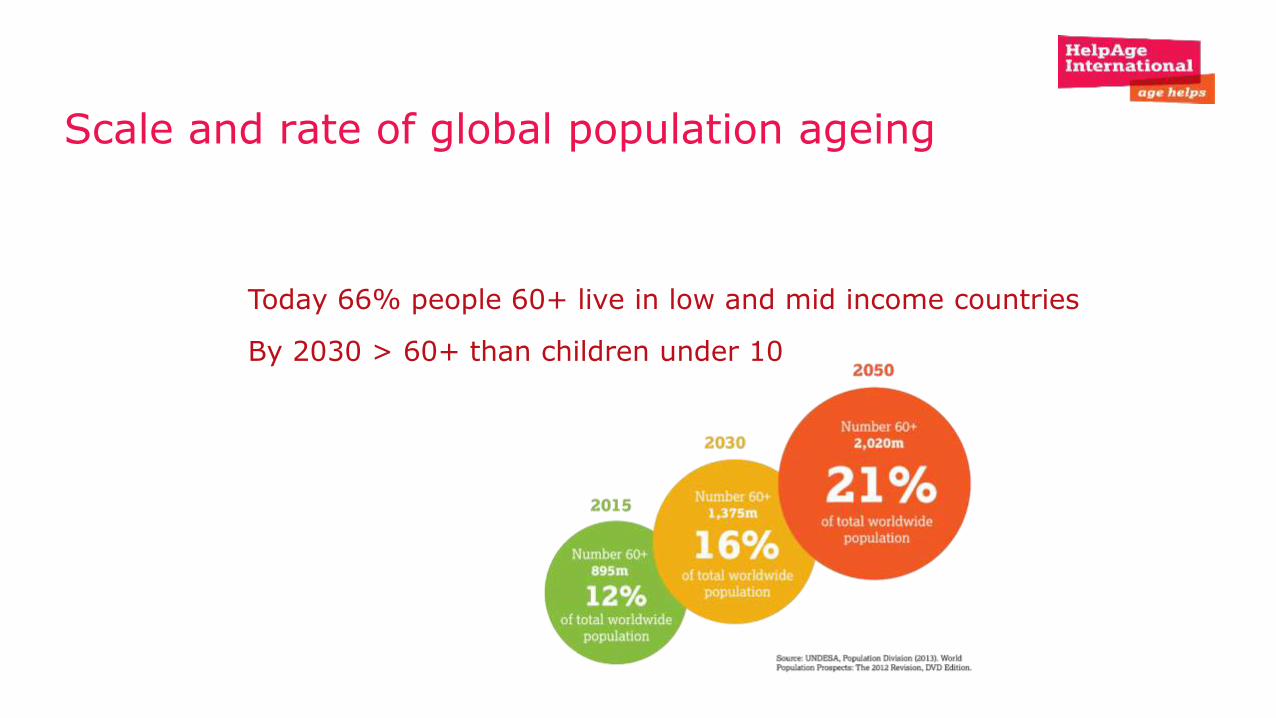
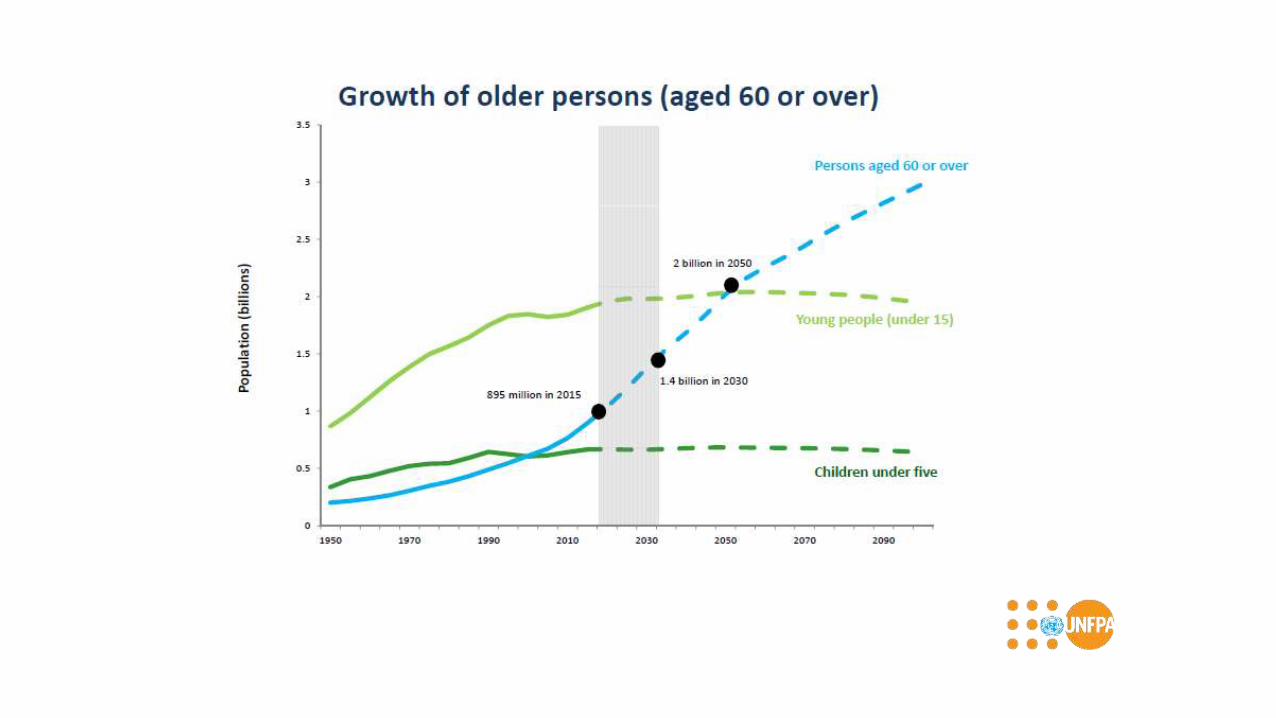
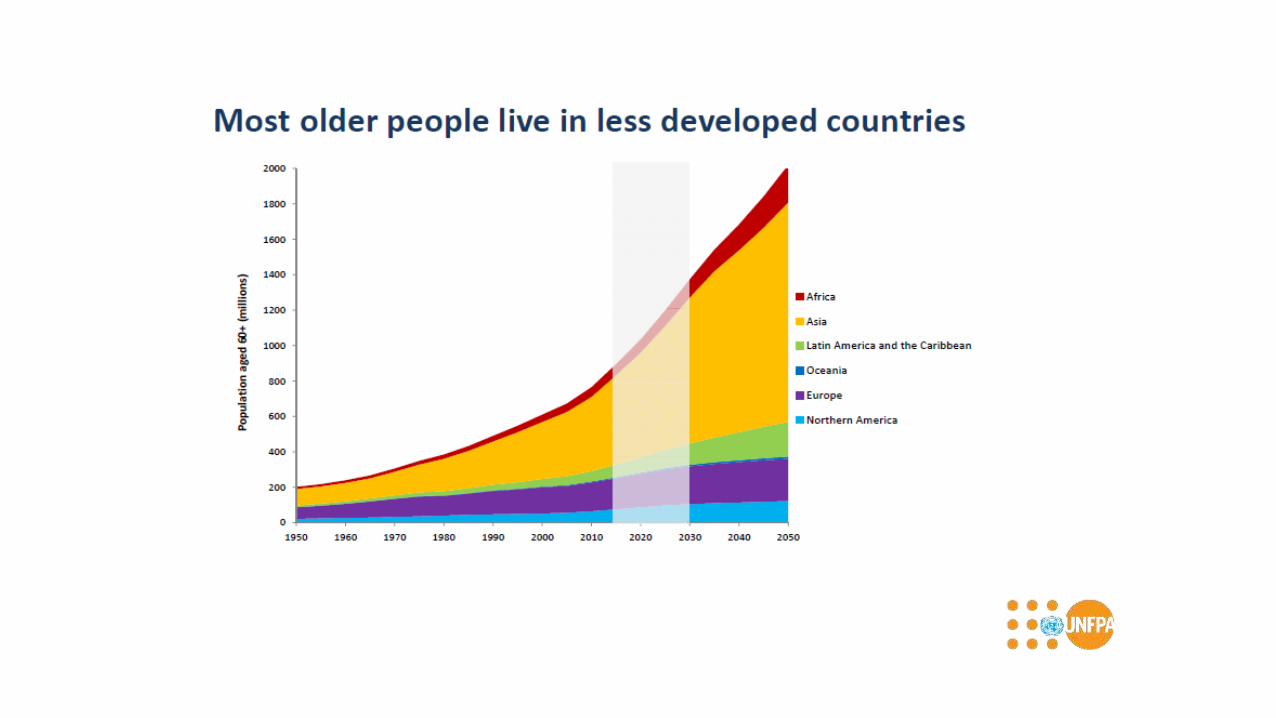
Scale and rate of global population ageing
Today 66% people 60+ live in low and mid income countries
By 2030 > 60+ than children under 10
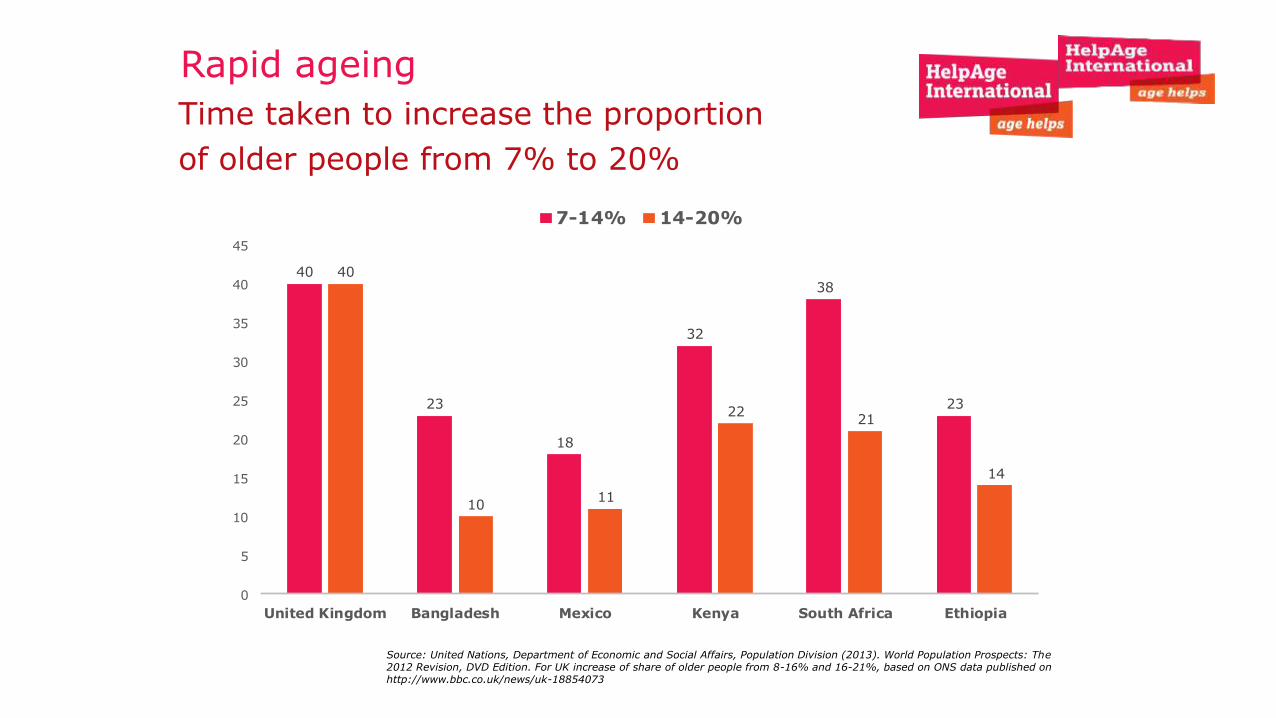
Time taken to increase the proportion
of older people from 7% to 20%
Rapid ageing
40
23
18
32
38
23
40
1011
2221
14
0
5
10
15
20
25
30
35
40
45
United Kingdom Bangladesh Mexico Kenya South Africa Ethiopia
7-14% 14-20%
Source: United Nations, Department of Economic and Social Affairs, Population Division (2013). World Population Prospects: The 2012 Revision, DVD Edition. For UK increase of share of older people from 8-16% and 16-21%, based on ONS data published on http://www.bbc.co.uk/news/uk-18854073
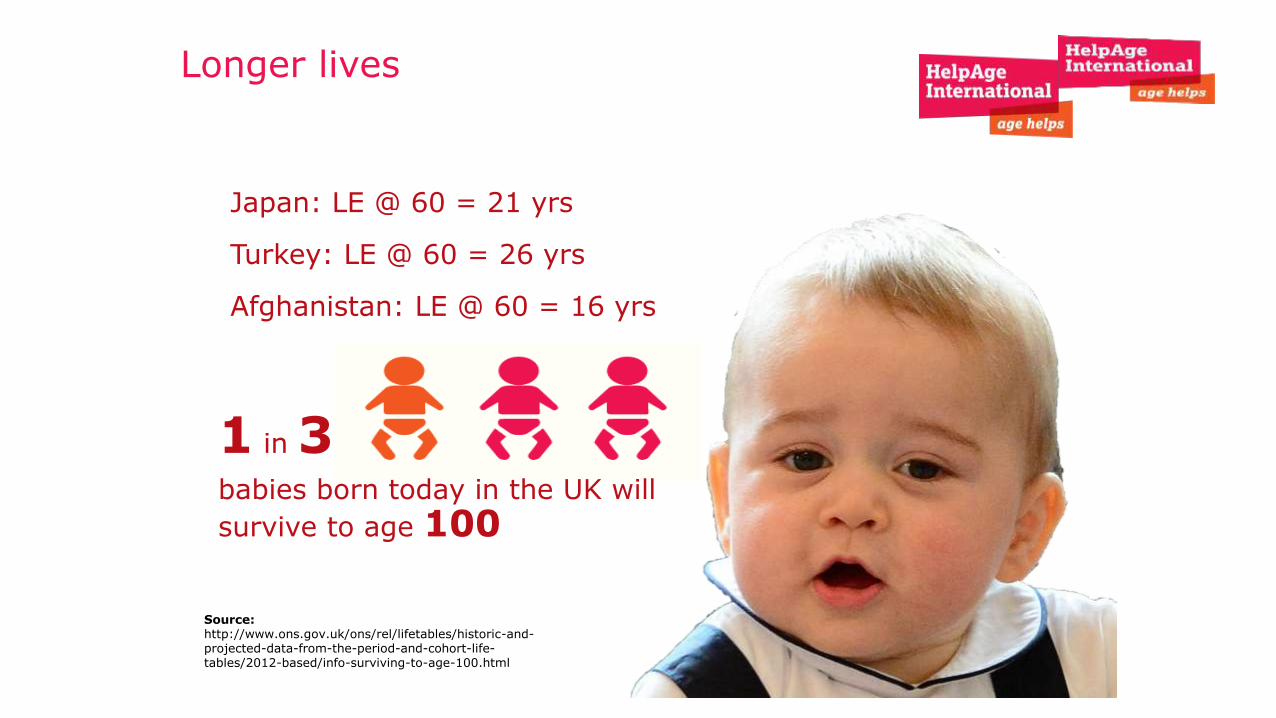
Longer lives
Source: http://www.ons.gov.uk/ons/rel/lifetables/historic-and-projected-data-from-the-period-and-cohort-life-tables/2012-based/info-surviving-to-age-100.html
1 in 3babies born today in the UK will
survive to age 100
Japan: LE @ 60 = 21 yrs
Turkey: LE @ 60 = 26 yrs
Afghanistan: LE @ 60 = 16 yrs
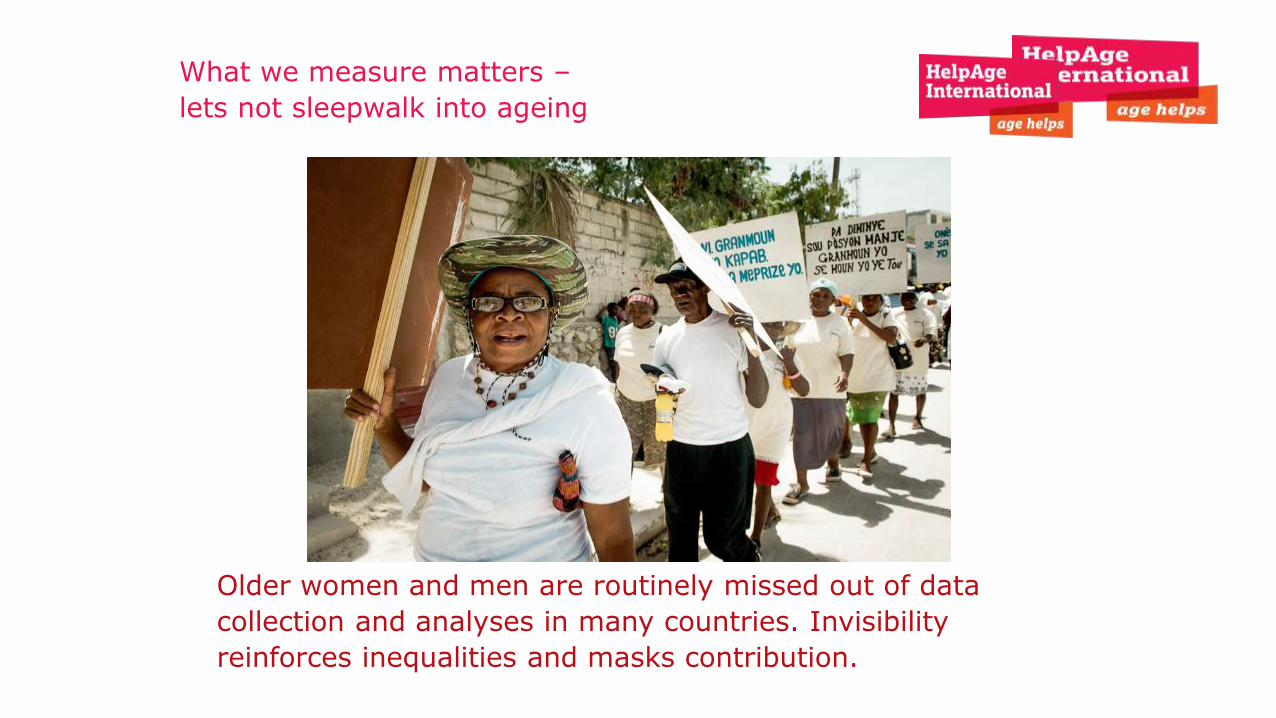
What we measure matters –
lets not sleepwalk into ageing
Older women and men are routinely missed out of data
collection and analyses in many countries. Invisibility
reinforces inequalities and masks contribution.
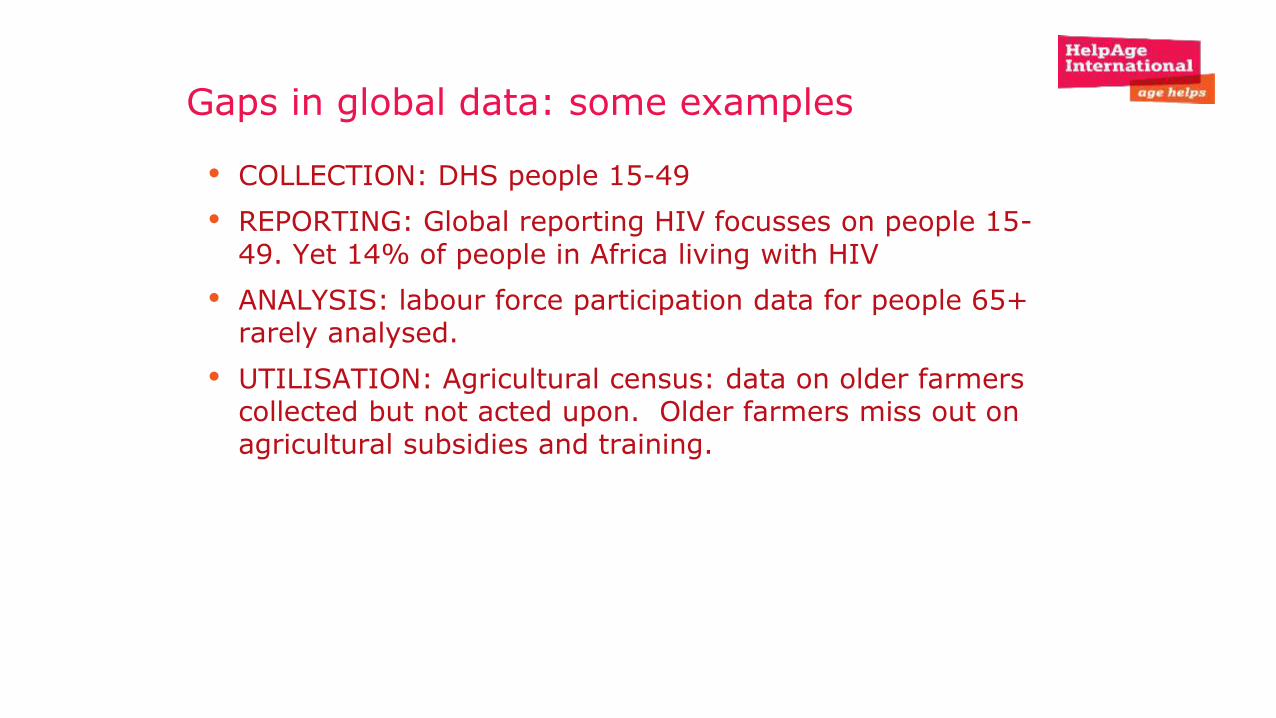
Gaps in global data: some examples
• COLLECTION: DHS people 15-49
• REPORTING: Global reporting HIV focusses on people 15-49. Yet 14% of people in Africa living with HIV
• ANALYSIS: labour force participation data for people 65+ rarely analysed.
• UTILISATION: Agricultural census: data on older farmers collected but not acted upon. Older farmers miss out on agricultural subsidies and training.
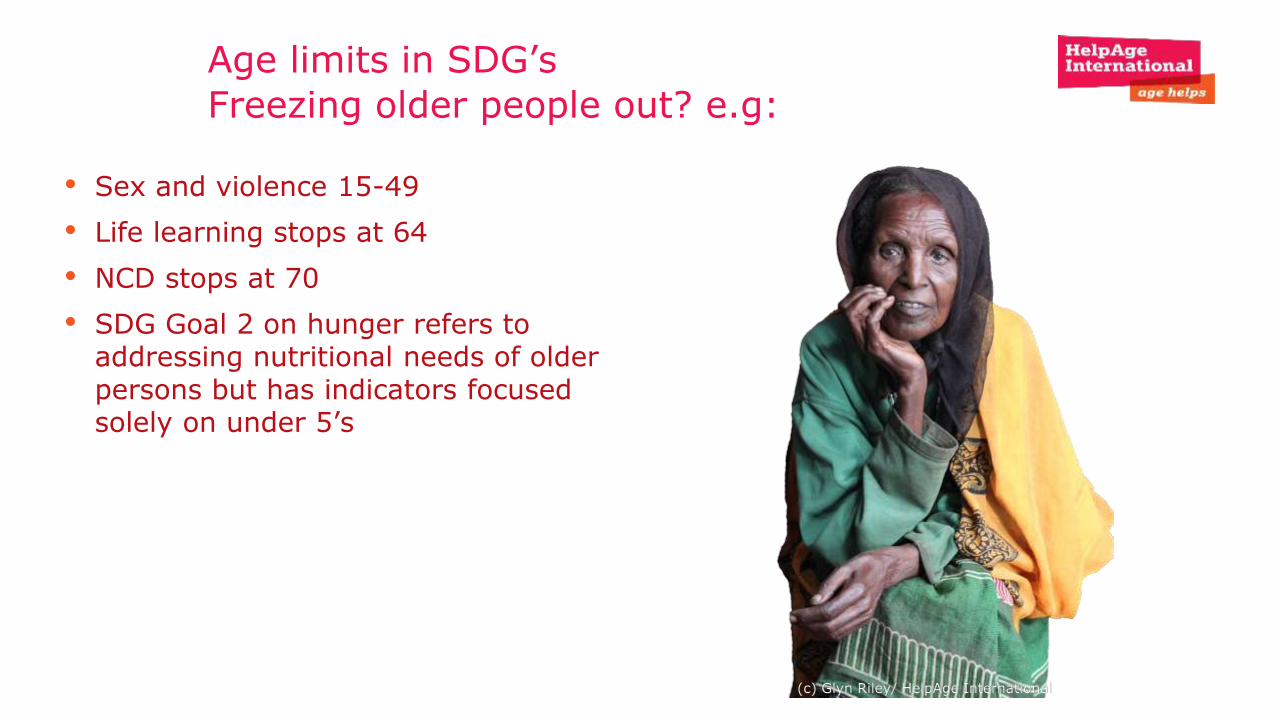
Age limits in SDG’s
Freezing older people out? e.g:
• Sex and violence 15-49
• Life learning stops at 64
• NCD stops at 70
• SDG Goal 2 on hunger refers to addressing nutritional needs of older persons but has indicators focused solely on under 5’s
(c) Glyn Riley/ HelpAge International
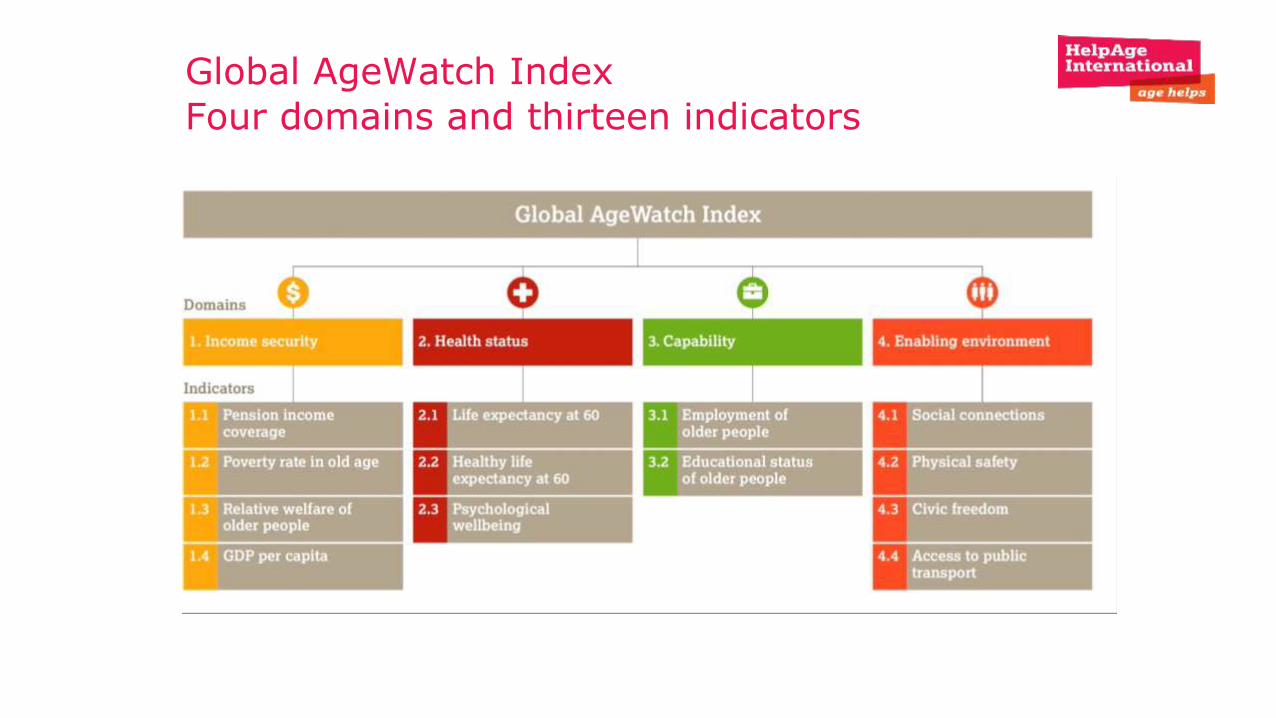
Global AgeWatch Index
Four domains and thirteen indicators
Challenges : multidimensional
framework of well-being
• How to capture well-being?
• The Index framework was developed based on
• Human Development Index
• Recommendations of the Stiglitz Commission, Madrid International Plan of Actions on Ageing, UNFPA/HelpAge International report ‘Ageing in the XXI century’
• Consultations with more than 30 International experts
• Ongoing process
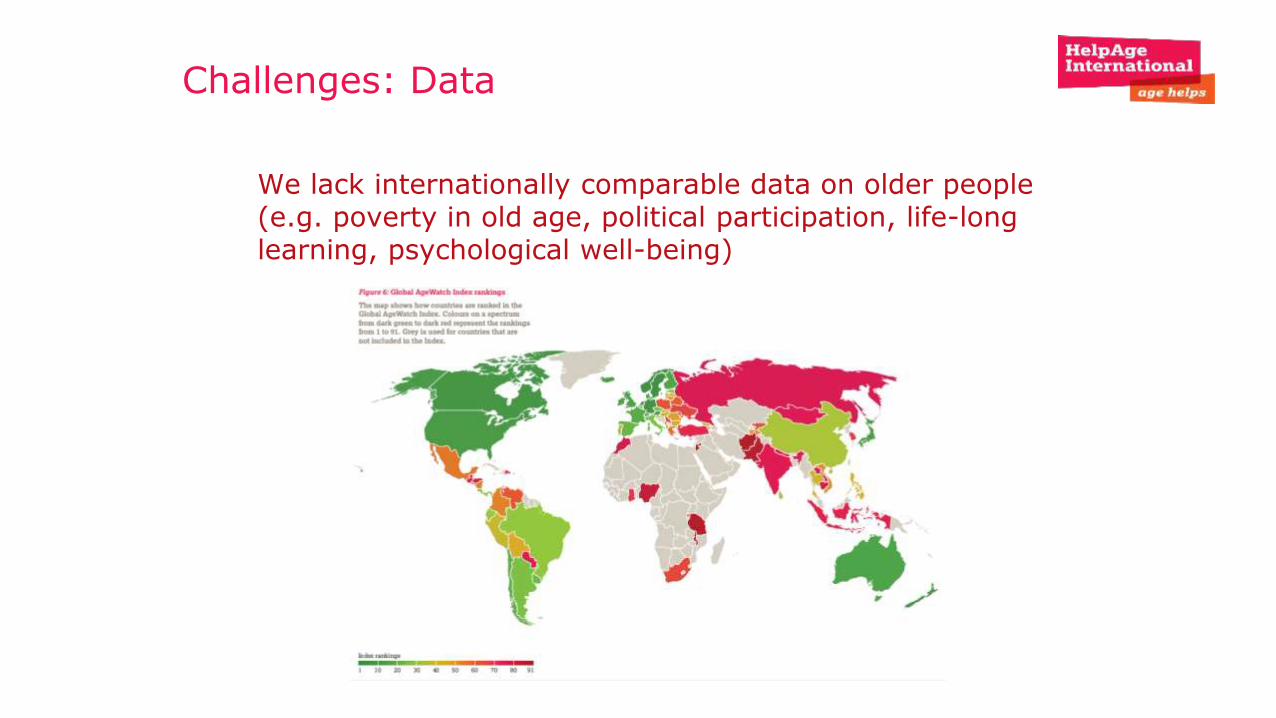
Challenges: Data
We lack internationally comparable data on older people (e.g. poverty in old age, political participation, life-long learning, psychological well-being)
Challenges: Data
• Data available for only 96 countries
• Some indicators not available by gender
• Time lag when national statistics makes it to international datasets
• No international agreement on methodology of measuring indicators (e.g. poverty rate: absolute vs. relative)
• Quality of subjective indicators
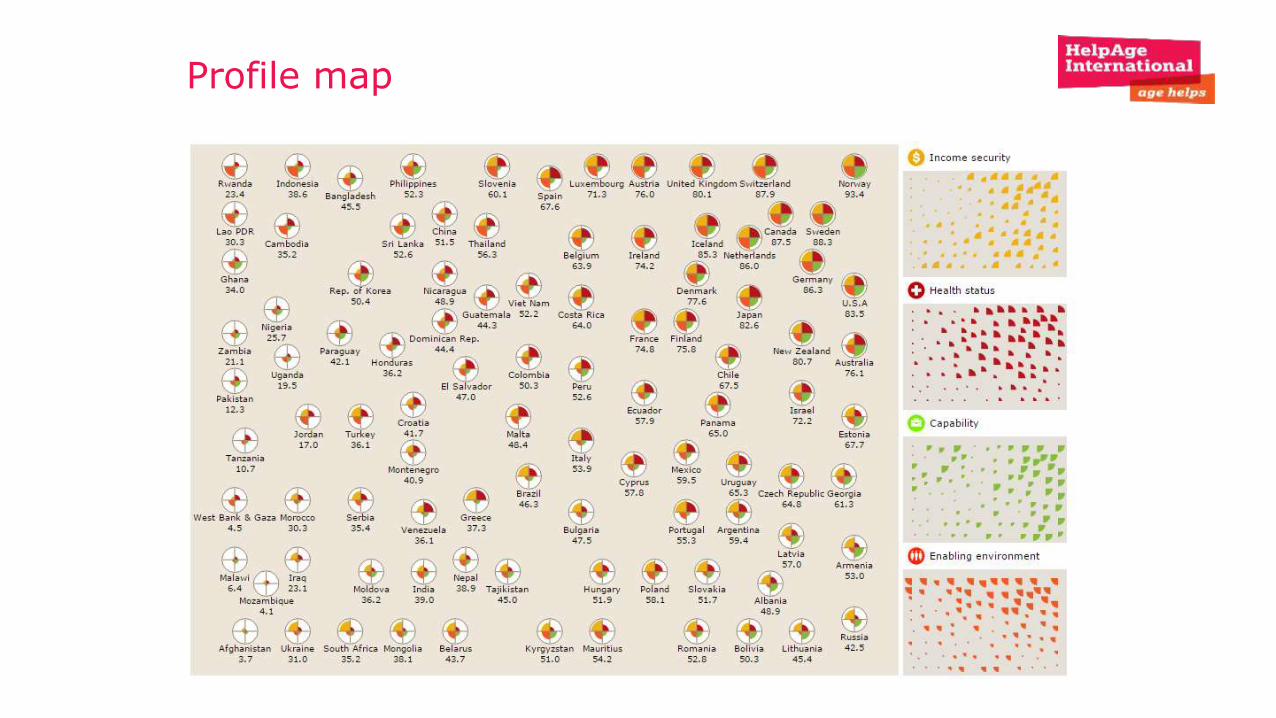
Profile map
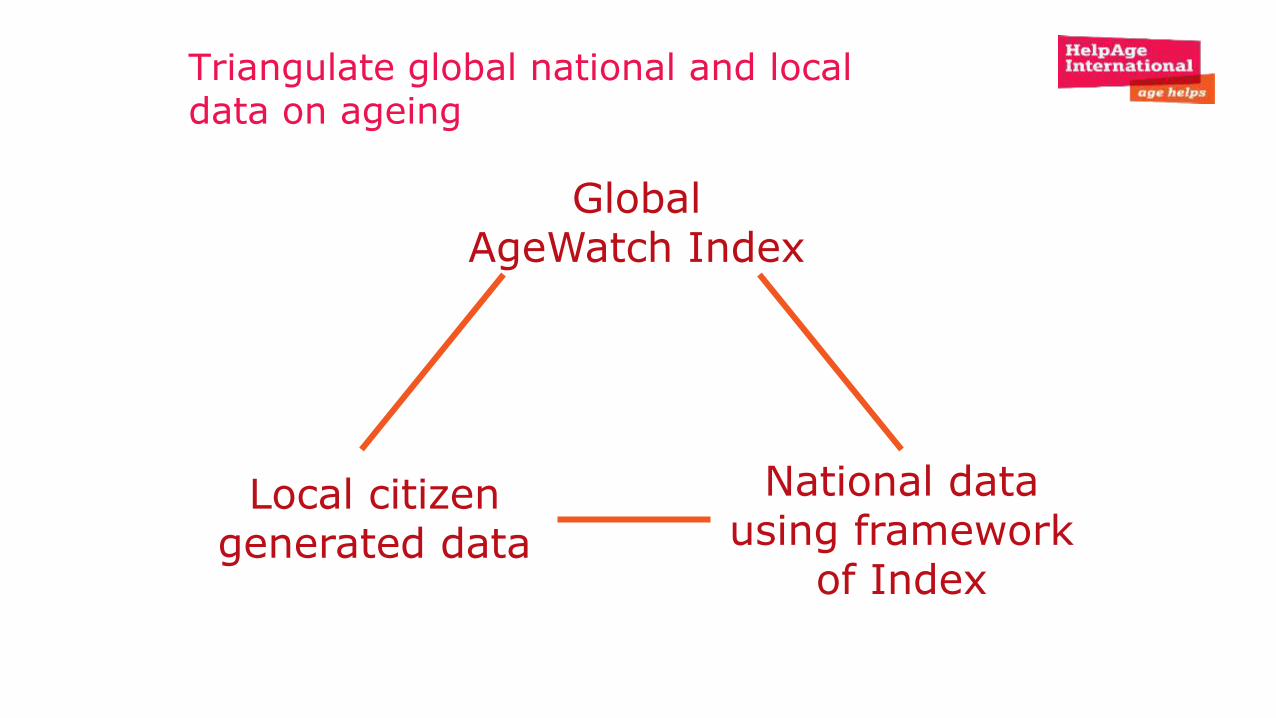
Triangulate global national and local data on ageing
Global AgeWatch Index
National data using framework
of Index
Local citizen generated data
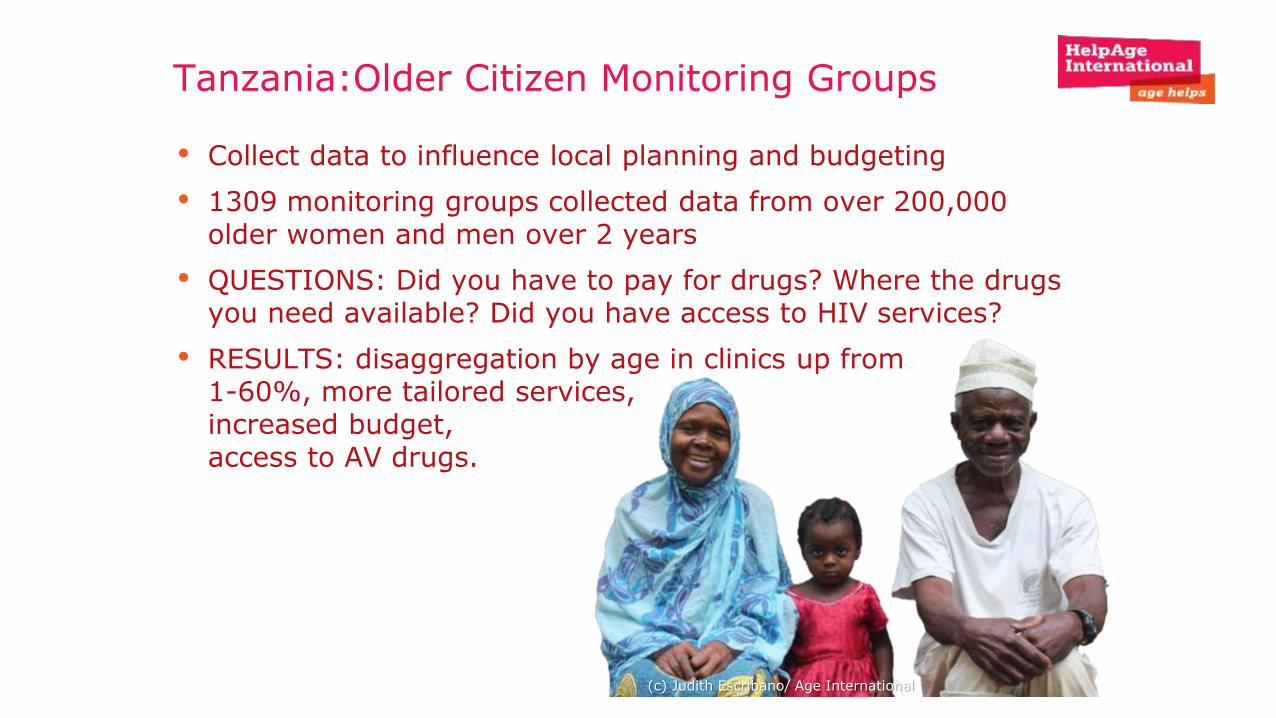
Tanzania:Older Citizen Monitoring Groups
• Collect data to influence local planning and budgeting
• 1309 monitoring groups collected data from over 200,000 older women and men over 2 years
• QUESTIONS: Did you have to pay for drugs? Where the drugs you need available? Did you have access to HIV services?
• RESULTS: disaggregation by age in clinics up from 1-60%, more tailored services,increased budget, access to AV drugs.
(c) Judith Escribano/ Age International
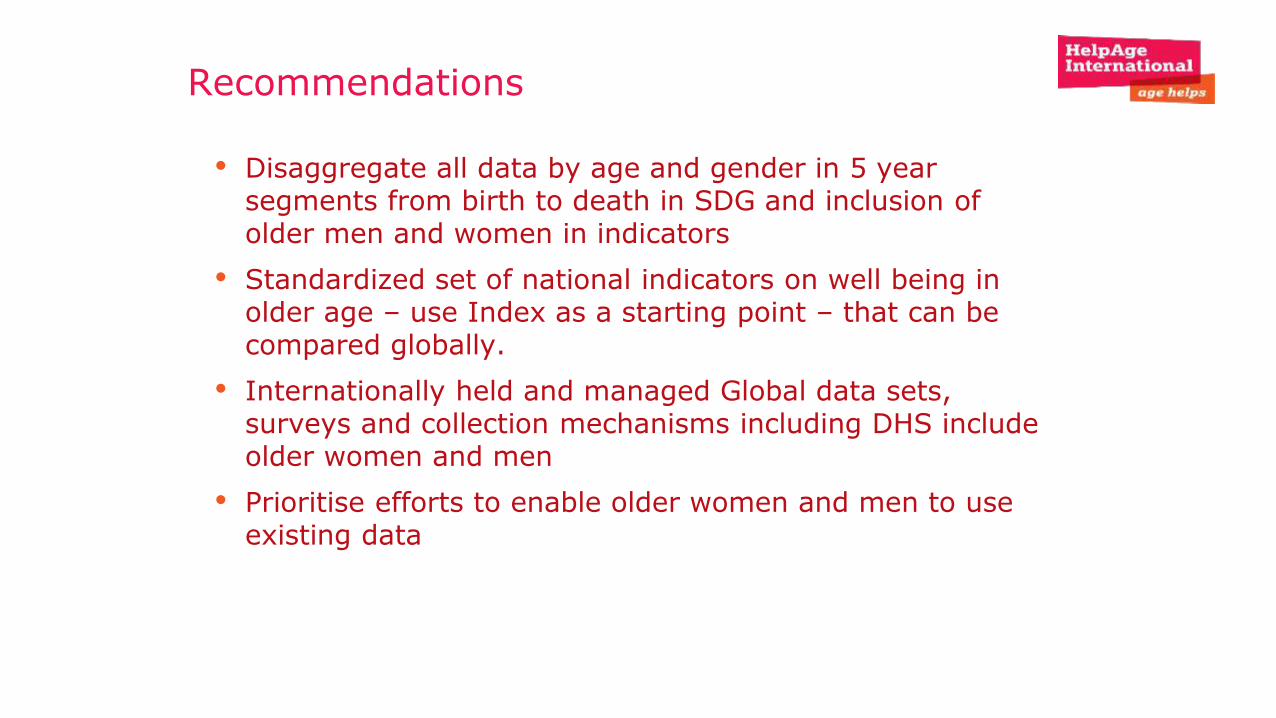
Recommendations
• Disaggregate all data by age and gender in 5 year segments from birth to death in SDG and inclusion of older men and women in indicators
• Standardized set of national indicators on well being in older age – use Index as a starting point – that can be compared globally.
• Internationally held and managed Global data sets, surveys and collection mechanisms including DHS include older women and men
• Prioritise efforts to enable older women and men to use existing data
Thank you and spread the word!
HelpAgeInternational
@helpage
#AgeingIndex
www.helpage.org
© J
onas W
resch/
Help
Age I
nte
rnational

Session 1: Global data, demographic change and inequality
Comments, questions, responses.
Wrap up: Danny Sriskandarajah.
#DATA2015
#ALLAGES
WifiUsername: Casa1537Password: Venue1537