Embed Size (px)
Citation preview
China Coal Tar Industry Report, 2016-2020
Jun. 2016
METHODOLOGY
Both primary and secondary research methodologies were used
in preparing this study. Initially, a comprehensive and exhaustive
search of the literature on this industry was conducted. These
sources included related books and journals, trade literature,
marketing literature, other product/promotional literature, annual
reports, security analyst reports, and other publications.
Subsequently, telephone interviews or email correspondence
was conducted with marketing executives etc. Other sources
included related magazines, academics, and consulting
companies.
INFORMATION SOURCES
The primary information sources include Company Reports,
and National Bureau of Statistics of China etc.
STUDY GOAL AND OBJECTIVES
This report provides the industry executives with strategically significant
competitor information, analysis, insight and projection on the
competitive pattern and key companies in the industry, crucial to the
development and implementation of effective business, marketing and
R&D programs.
REPORT OBJECTIVES To establish a comprehensive, factual, annually updated and cost-
effective information base on market size, competition patterns,
market segments, goals and strategies of the leading players in the
market, reviews and forecasts.
To assist potential market entrants in evaluating prospective
acquisition and joint venture candidates.
To complement the organizations’ internal competitor information
gathering efforts with strategic analysis, data interpretation and
insight.
To suggest for concerned investors in line with the current
development of this industry as well as the development tendency.
To help company to succeed in a competitive market, and
understand the size and growth rate of any opportunity.
Room 502, Block 3, Tower C, Changyuan Tiandi Building, No. 18, Suzhou Street, Haidian District, Beijing, China 100080 Phone: +86 10 82600828 ● Fax: +86 10 82601570 ● www.researchinchina.com ● [email protected]
Copyright 2012 ResearchInChina
AbstractCoal tar is a by-product of coke production, and its output varies with coke output.
In 2007-2014, China's coke output continued to grow, but the growth rate had been declining since 2010. In 2015, due to a downturn in the steel industry, the coke demand shrank sharply, with the output sliding 6.7% year on year. The change in coal tar output was basically the same as that of coke. In 2015, the coal tar output in China approximated 17.7 million tons.
In 2015, China's coal tar production converged in North China and East China, which contributed an aggregate of 57% of the total nationwide. By province, Shanxi, Hebei and Shandong ranked among the top three in terms of coal tar output. Among them, Shanxi constituted China’s largest coal and coke producing area, whose coal tar output occupied 17.9%.
In China, coal tar is mainly consumed in deep-processed products (including phenol, anthracene, industrial naphthalene, coal tar pitch, etc.) and carbon black, with 2015’s consumption in the two markets accounting for 76% and 22%, respectively.
In 2015, China's coal tar processing capacity totaled 25.5 million tons, and there were a large number of coal tar deep-processing enterprises that went into fierce competition. To promote sound development of the industry and by degrees eliminate backward capacity, the Ministry of Industry and Information Technology (MIIT) issued in 2014the Access Conditions of Coking Industry, which stipulates that anhydrous coal tar processing capacity of single facility shall be no less than 150 kt/a. It is expected that in the upcoming years China's coal tar processing capacity will slow down, and that capacity concentration will improve.
The Chinese coal tar processing enterprises mainly include Henan Baoshun Chemical Technology, Shanghai Baosteel Chemical, and HuanghuaXinnuoLixing Fine Chemical, whose capacity reached respectively 1.05 million tons, 950,000 tons, and 900,000 tons in 2015. Among them, Baoshun Chemical has three major coal tar bases—Henan headquarters, Shandong Baoshun, and Xinjiang Baoshun, which have the processing capacity of 450,000t/a, 300,000 t/a, and 300,000 t/a, respectively.
Room 502, Block 3, Tower C, Changyuan Tiandi Building, No. 18, Suzhou Street, Haidian District, Beijing, China 100080 Phone: +86 10 82600828 ● Fax: +86 10 82601570 ● www.researchinchina.com ● [email protected]
Copyright 2012ResearchInChina
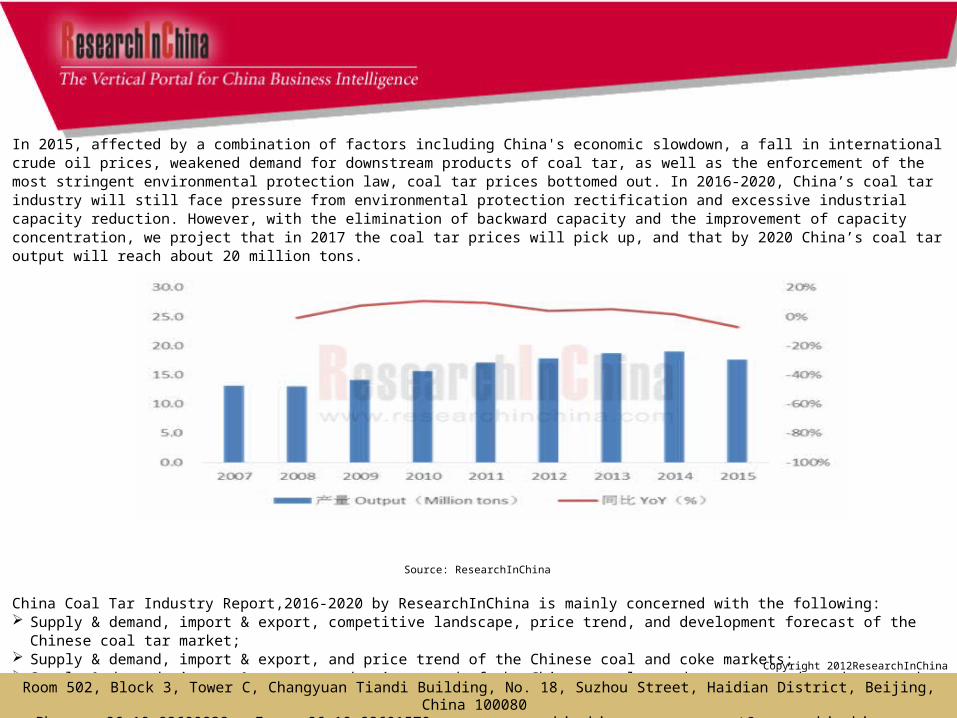
In 2015, affected by a combination of factors including China's economic slowdown, a fall in international crude oil prices, weakened demand for downstream products of coal tar, as well as the enforcement of the most stringent environmental protection law, coal tar prices bottomed out. In 2016-2020, China’s coal tar industry will still face pressure from environmental protection rectification and excessive industrial capacity reduction. However, with the elimination of backward capacity and the improvement of capacity concentration, we project that in 2017 the coal tar prices will pick up, and that by 2020 China’s coal tar output will reach about 20 million tons.
Coal Tar Output and Growth Rate in China, 2007-2015
Source: ResearchInChina
China Coal Tar Industry Report,2016-2020 by ResearchInChina is mainly concerned with the following: Supply & demand, import & export, competitive landscape, price trend, and development forecast of the Chinese coal tar market; Supply & demand, import & export, and price trend of the Chinese coal and coke markets; Supply & demand, import & export, and price trend of the Chinese coal tar deep-processed products market (phenol oil, industrial
naphthalene, etc.); Operation, coal tar business, and development forecast of 15 global and Chinese coal tar processing companies.
Room 502, Block 3, Tower C, Changyuan Tiandi Building, No. 18, Suzhou Street, Haidian District, Beijing, China 100080 Phone: +86 10 82600828 ● Fax: +86 10 82601570 ● www.researchinchina.com ● [email protected]
Copyright 2012ResearchInChina
1. Overview of Coal Tar1.1 Definition & Classification1.2 Preparation1.3 Application1.4 Key Technologies1.4.1 Coal Tar Distillation1.4.2 Industrial Naphthalene Distillation1.4.3 Elution of Fraction from Coal tar Distillation1.4.4 Refining of Crude Anthracene1.4.5 Decomposition of Hydroxybenzene Natrium Salt 1.4.6 Preparation of Naphthalene1.4.7 Refining of Crude Hydroxybenzene1.4.8 Refining of Crude Pyridine and Crude Quinoline1.4.9 Production of Refined Anthracene, Refined Carbazole and Anthraquinone
2. Development Environment for China Coal Tar Industry2.1 Policy Environment2.2 Supply2.3 Demand2.3.1 Demand from Deep Processing2.3.2 Demand from Carbon Black2.3.3 Demand from Fuel 2.4 Import and Export2.4.1 Export
Table of contents
Room 502, Block 3, Tower C, Changyuan Tiandi Building, No. 18, Suzhou Street, Haidian District, Beijing, China 100080 Phone: +86 10 82600828 ● Fax: +86 10 82601570 ● www.researchinchina.com ● [email protected]
2.4.2 Import2.4.3 Price2.5 Market Price
3. Current Situation of China Coal and Coke Industry3.1 Coal Industry3.1.1 Output3.1.2 Import and Export3.1.3 Price3.2 Coke Industry3.2.1 Supply and Demand3.2.2 Export3.2.3 Price
4. Current Situation of Coal Tar Processing in China4.1 Coal Tar Processing Capacity4.2 Main Coal Tar Deep Processing Projects4.3 Domestic and Foreign Coal Tar Processing Techniques4.3.1 Foreign4.3.2 Domestic4.4 Phenol Oil 4.4.1 Phenol4.4.2 O-cresol4.4.3 M-cresol and P-cresol
4.4.4 Mixed Cresol4.5 Industrial Naphthalene4.5.1 Production4.5.2 Consumption4.5.3 Import and Export4.5.4 Price Trend4.6 Coal Tar Pitch4.6.1 Supply and Demand4.6.2 Application Market4.6.3 Price Trend4.7 Anthracene Oil4.8 Light Oil4.9 Wash Oil
5. Coal Tar Industry Competition in China5.1 Regional Competition5.1.1 Shanxi5.1.2 Hebei5.1.3 Shandong5.2 Enterprise Competition5.3 Product Competition
6. Major Global Coal Tar Companies6.1 Koppers
6.1.1 Profile6.1.2 Operation6.1.3 Operation of Carbon Materials & Chemicals Segment 6.1.4 Business in China6.2 RüTGERS Group6.2.1 Profile6.2.2 Operation6.3 Nippon Steel &Sumikin Chemical Co. Ltd6.3.1 Profile6.3.2 Operation6.4 Summary
7. Major Chinese Coal Tar Companies7.1 Shanxi Coking Group Co., Ltd.7.1.1 Profile7.1.2 Operation7.1.3 Revenue Structure7.1.4 Gross Margin 7.1.5 Project Investment 7.2 Shanxi Hongte Coal Chemical Industry Co., Ltd.7.2.1 Profile7.2.2 Capacity Expansion7.3 Shanghai Baosteel Chemical Co., Ltd7.3.1 Profile7.3.2 Operation
Table of contents
Room 502, Block 3, Tower C, Changyuan Tiandi Building, No. 18, Suzhou Street, Haidian District, Beijing, China 100080 Phone: +86 10 82600828 ● Fax: +86 10 82601570 ● www.researchinchina.com ● [email protected]
7.3.3 Key Projects7.4 Baoshun Technology Co., Ltd.7.4.1 Profile7.4.2 Operation7.4.3 Revenue Structure7.4.4 Gross Margin7.4.5 Coal Tar Business7.5 Wuhan Iron and Steel (Group) Corp.7.5.1 Profile7.5.2 Operation7.5.3 Coal Tar Business7.6 Jiangxi Black Cat Carbon Black Inc., Ltd.7.6.1 Profile7.6.2 Operation7.6.3 Revenue Structure7.6.4 Gross Margin7.6.5 Development Prospect and Forecast7.7 Guanghui Energy Co., Ltd.7.7.1 Profile7.7.2 Operation7.7.3 Coal Tar Business7.8 HuanghuaXinnuolixing Fine Chemical Stock Company Limited7.8.1 Profile7.8.2 Operation
7.8.3 Revenue Structure7.8.4 Gross Margin 7.8.5 Customers and Suppliers7.8.6 Key Projects7.8.7 Development and Forecast7.9 ShenmuTianyuan Chemical Co., Ltd.7.9.1 Profile7.9.2 Coal Tar Business7.10 JFE Zhenxing Shandong Chemical Company Ltd 7.10.1 Profile7.10.2 Capacity7.11 Shanxi Yongdong Chemistry Industry Co., Ltd.7.11.1 Profile7.11.2 Operation7.11.3 Revenue Structure7.11.4 Gross Margin7.12 QitaiheBaotailong Coal & Coal Chemicals Public Co., Ltd.7.13 Summary
8. Summary and Forecast8.1 Summary8.2 Forecast
• Main Products Extracted from High-temperature Coal Tar and Their Applications• Policies on Coal Chemical Industry in China• Output of Coke and Machine Coke in China, 2007-2015• Coal Tar Output and Growth Rate in China, 2007-2015• Coal Tar Output Structure in China by Region, 2015• Consumption Structure of Coal Tar in China, 2015• Amount of Coal Tar Processed in China, 2007-2015• Carbon Black Output and Coal Tar Consumption in China, 2007-2015• China’s Coal Tar Export Volume, 2007-2015• Export Destinations of Coal Tar from China by Export Volume, 2015• China’s Coal Tar Import Volume, 2007-2015• Import Sources of Coal Tar in China by Import Volume, 2015• Average Import and Export Price of Coal Tar in China, 2010-2015• Price Trend of Coal Tar in North China, 2009-2016• China’s Raw Coal Output, 2007-2015• China’s Coal Import and Export Volume, 2007-2015• Coal Price Indexes in China, 2006-2016E• China’s Coke Output and Apparent Consumption, 2007-2015• China’s Coke Import and Export Volume, 2007-2015• Price Trend of Coke in North China, 2012-2016• China’s Coal Tar Processing Capacity, 2007-2015• Internationally Famous Coal Tar Deep Processing Techniques and Their Characteristics• Coal Tar Processing Procedure in China• Phenol Producers and Their Capacities in China, 2015 • Operating Rate of Phenol Installations in China, 2013-2016
Selected Charts
Room 502, Block 3, Tower C, Changyuan Tiandi Building, No. 18, Suzhou Street, Haidian District, Beijing, China 100080 Phone: +86 10 82600828 ● Fax: +86 10 82601570 ● www.researchinchina.com ● [email protected]
• Phenol Capacity Planed/under Construction in China, 2016 • China’s Phenol Export & Import Volume, 2009-2015• Average Import and Export Price of Phenol in China, 2009-2015• China’s O-cresol Import and Export Volume, 2009-2015• Average Import and Export Price of O-cresol in China, 2009-2015• China’s Industrial Naphthalene Output, 2007-2015• China’s Consumption Structure of Industrial Naphthalene, 2015• China’s Industrial Naphthalene Import and Export Volume, 2009-2015• Average Import and Export Price of Industrial Naphthalene in China, 2009-2015• Price Trend of Industrial Naphthalene in North China, 2009-2016• China’s Coal Tar Pitch Import and Export Volume, 2009-2015• Average Import and Export Price of Coal Tar Pitch in China, 2009-2015• Price Trend of Coal Tar Pitch in North China, 2012-2016• Geographical Distribution of Coal Tar Output in China, 2013-2015• Coal Tar Output and Growth Rate in Shanxi Province, 2012-2015• Capacity of Main Coal Tar Deep-processing Companies in Shanxi, 2015• Coal Tar Output and Growth Rate inHebei Province, 2012-2015• Capacity of Main Coal Tar Deep-processing Companies in Hebei, 2015• Coal Tar Output and Growth Rate inShandong Province, 2012-2015• Capacity of Main Coal Tar Deep-processing Companies in Shandong, 2015• Capacity of Main Coal Tar Deep-processing Companies in China, 2015• Carbon Materials and Chemicals of Koppers• Net Sales and Net Income of Koppers, 2010-2016• Net Sales Structure (%) of Koppers by Division, 2012-2016• Net Sales Structure (%) of Koppers by Region, 2012-2015
Selected Charts
Room 502, Block 3, Tower C, Changyuan Tiandi Building, No. 18, Suzhou Street, Haidian District, Beijing, China 100080 Phone: +86 10 82600828 ● Fax: +86 10 82601570 ● www.researchinchina.com ● [email protected]
• Net Sales and Operating Income of Koppers’ Carbon Materials & Chemicals Division, 2010-2016• Distribution of Production Bases of Koppers’ Carbon Materials & Chemicals Division• Revenue Breakdown (by Product) of Koppers’ Carbon Materials & Chemicals Division, 2011-2015 • Revenue Structure (by Product) of Koppers’ Carbon Materials & Chemicals Division, 2011-2015 • Subsidiaries and Capacity of Rutgers• Net Sales and Net Income of Nippon Steel &Sumikin Chemical, FY2009-FY2014• Major Products of Nippon Steel &Sumikin Chemical• Statistics on Capacity and Products of Global Coal Tar Companies, 2015• Revenue and Net Income of Shanxi Coking Group, 2010-2016• Output (by Product) of Shanxi Coking Group, 2013-2015• Sales Volume (by Product) of Shanxi Coking Group, 2013-2015• Revenue Breakdown (by Product) of Shanxi Coking Group, 2012-2015• Revenue Structure (by Product) of Shanxi Coking Group, 2012-2015• Shanxi Coking Group’s Revenue from Main Chemicals, 2012-2014• Gross Margin (by Product) of Shanxi Coking Group, 2010-2015• Sales of Shanghai Baosteel Chemical, 2007-2013• Development Course of Shanghai Baosteel Chemical• Industrial Layout of Baoshun Technology• Revenue of Henan Baoshun Technology Technology, 2011-2014• Revenue Breakdown of Baoshun Technology by Product, 2011-2014• Revenue Structure of Baoshun Technology by Product, 2011-2014• Gross Margin of Baoshun Technology by Product, 2011-2014• Production Bases and Product Capacity of Henan Baoshun Chemical Technology, 2015• Output Breakdown of Baoshun Chemical by Product, 2011-2014• Revenue and Net Income of Wuhan Iron and Steel (Group), 2010-2016
Selected Charts
Room 502, Block 3, Tower C, Changyuan Tiandi Building, No. 18, Suzhou Street, Haidian District, Beijing, China 100080 Phone: +86 10 82600828 ● Fax: +86 10 82601570 ● www.researchinchina.com ● [email protected]
• Revenue and Net Income of Jiangxi Black Cat Carbon Black, 2010-2016• Revenue Breakdown (by Product) of Jiangxi Black Cat Carbon Black, 2012-2015• Revenue Structure (by Product) of Jiangxi Black Cat Carbon Black, 2012-2015• Revenue Breakdown (by Region) of Jiangxi Black Cat Carbon Black, 2012-2015• Revenue Structure (by Region) of Jiangxi Black Cat Carbon Black, 2012-2015• Gross Margin (by Product) of Jiangxi Black Cat Carbon Black, 2010-2015• Revenue and Net Income of Jiangxi Black Cat Carbon Black, 2015-2020E• Revenue and Net Income of Guanghui Energy, 2010-2016• Revenue and Net Income of HuanghuaXinnuolixing Fine Chemical, 2013-2015• Revenue Breakdown (by Product) of HuanghuaXinnuolixing Fine Chemical, 2013-2015• Revenue Structure (by Product) of HuanghuaXinnuolixing Fine Chemical, 2013-2015• Revenue Breakdown (by Region) of HuanghuaXinnuolixing Fine Chemical, 2013-2015• Revenue Structure (by Region) of HuanghuaXinnuolixing Fine Chemical, 2013-2015• Gross Margin of Main Products of HuanghuaXinnuolixing Fine Chemical, 2013-2015• HuanghuaXinnuolixing Fine Chemical’s Revenue from Top 5 Clients and % of Total Revenue, 2013-2015• Name List and Revenue Contribution of HuanghuaXinnuolixing Fine Chemical’s Top 5 Clients, 2015• HuanghuaXinnuolixing Fine Chemical’s Procurement from Top 5 Suppliers and % of Total Procurement, 2013-2015• Name List and Procurement Contribution of HuanghuaXinnuolixing Fine Chemical’s Top 5 Suppliers, 2015• Revenue and Net Income of HuanghuaXinnuolixing Fine Chemical, 2015-2020E• Revenue and Net Income of Shanxi Yongdong Chemistry Industry, 2012-2015• Revenue Breakdown (by Product) of Shanxi Yongdong Chemistry Industry, 2013-2015• Revenue Structure (by Product) of Shanxi Yongdong Chemistry Industry, 2013-2015• Revenue Breakdown (by Regiont) of Shanxi Yongdong Chemistry Industry, 2013-2015• Revenue Structure (by Region) of Shanxi Yongdong Chemistry Industry, 2013-2015• Gross Margin of Main Products of Shanxi Yongdong Chemistry Industry, 2012-2015
Selected Charts
Room 502, Block 3, Tower C, Changyuan Tiandi Building, No. 18, Suzhou Street, Haidian District, Beijing, China 100080 Phone: +86 10 82600828 ● Fax: +86 10 82601570 ● www.researchinchina.com ● [email protected]
• Output and Sales Volume of Coal Tar Deep-processed Products of Shanxi Yongdong Chemistry Industry, 2012-2015• Revenue and Net Income of Shanxi Yongdong Chemistry Industry, 2015-2020E• Revenue and Net Income of QitaiheBaotailong Coal & Coal Chemicals Public, 2011-2015• Capacity of Major Coal Tar Deep-processing Companies in China, 2015• China’s Coal Tar Capacity and Deep-processing Amount, 2007-2015• Coal Tar Output in China, 2016-2020E• Output of Coal Tar Deep-processed Products in China, 2016-2020E
Selected Charts
Room 502, Block 3, Tower C, Changyuan Tiandi Building, No. 18, Suzhou Street, Haidian District, Beijing, China 100080 Phone: +86 10 82600828 ● Fax: +86 10 82601570 ● www.researchinchina.com ● [email protected]
You can place your order in the following alternative ways:
1. Order online at www.researchinchina.com
2. Fax order sheet to us at fax number:+86 10 82601570
3. Email your order to: [email protected]
4. Phone us at +86 10 82600828/ 82601561
Party A:Name:Address:Contact Person: TelE-mail: Fax
Party B:Name: Beijing Waterwood Technologies Co., Ltd (ResearchInChina)Address: Room 502, Block 3, Tower C, Changyuan Tiandi Building, No. 18,
Suzhou Street, Haidian District, Beijing, China 100080Contact Person:
Liao Yan Phone:
86-10-82600828
E-mail: [email protected] Fax: 86-10-82601570Bank details:
Beneficial Name: Beijing Waterwood Technologies Co., LtdBank Name: Bank of Communications, Beijing BranchBank Address: NO.1 jinxiyuan shijicheng,Landianchang,Haidian District,BeijingBank Account No #: 110060668012015061217Routing No # : 332906Bank SWIFT Code: COMMCNSHBJG
Title Format Cost
Total
Choose type of format
PDF (Single user license) …………..2,200 USD
Hard copy ………………….……. 2,400 USD
PDF (Enterprisewide license)…....... 3,300 USD
※ Reports will be dispatched immediately
once full payment has been received.
Payment may be made by wire transfer or
credit card via PayPal.
How to Buy
Room 502, Block 3, Tower C, Changyuan Tiandi Building, No. 18, Suzhou Street, Haidian District, Beijing, China 100080 Phone: +86 10 82600828 ● Fax: +86 10 82601570 ● www.researchinchina.com ● [email protected]
About ResearchInChina
ResearchInChina (www.researchinchina.com) is a leading independent provider of China business
intelligence. Our research is designed to meet the diverse planning and information needs of businesses,
institutions, and professional investors worldwide. Our services are used in a variety of ways, including
strategic planning, product and sales forecasting, risk and sensitivity management, and as investment
research.
Our Major ActivitiesMulti-users market reportsDatabase-RICDBCustom ResearchCompany Search
For any problems, please contact our service team at:
Room 502, Block 3, Tower C, Changyuan Tiandi Building, No. 18, Suzhou Street, Haidian District, Beijing, China 100080 Phone: +86 10 82600828 ● Fax: +86 10 82601570 ● www.researchinchina.com ● [email protected]
RICDB service