Embed Size (px)
Citation preview
Data SnapShot Series 1.0March 2015
DATA SNAPSHOTClinton County
Table of contents
Introduction01Demography02
Economy03Labor Market04
Purpose
About Clinton County
01introduction

4
Purpose
This document provides information and data about Clinton County that can be used to guide local decision-making activities. The Data SnapShot showcases a variety of demographic, economic and labor market information that local leaders, community organizations and others can use to gain a better perspective on current conditions and opportunities in their county.
To strengthen the value and usability of the information, we showcase the data using a variety of visual tools, such as charts, graphs and tables. In addition, we offer key points about the data as a way of assisting the user with the interpretation of the information presented. Finally, short takeaway messages are offered at the end of each section in order to highlight some of the more salient findings.
Introduction
section 01
5
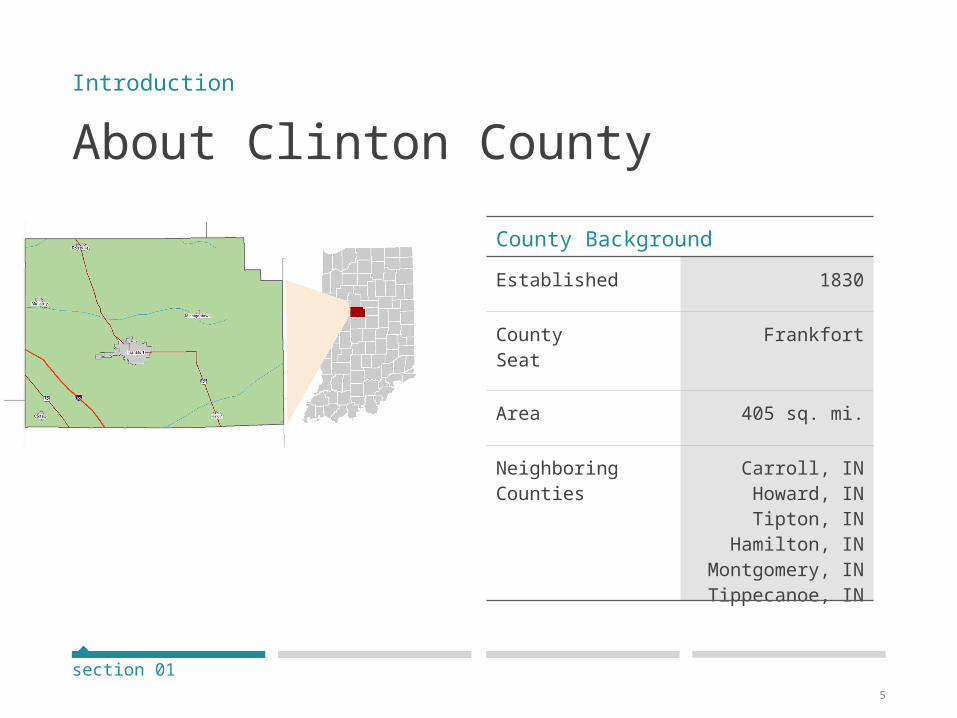
About Clinton CountyIntroduction
section 01
County Background Established 1830
CountySeat
Frankfort
Area 405 sq. mi.
NeighboringCounties
Carroll, INHoward, IN
Tipton, INHamilton, IN
Montgomery, INTippecanoe, IN
Population change
Population pyramids
Race
Ethnicity
Educational attainment
Takeaways
02demography
7
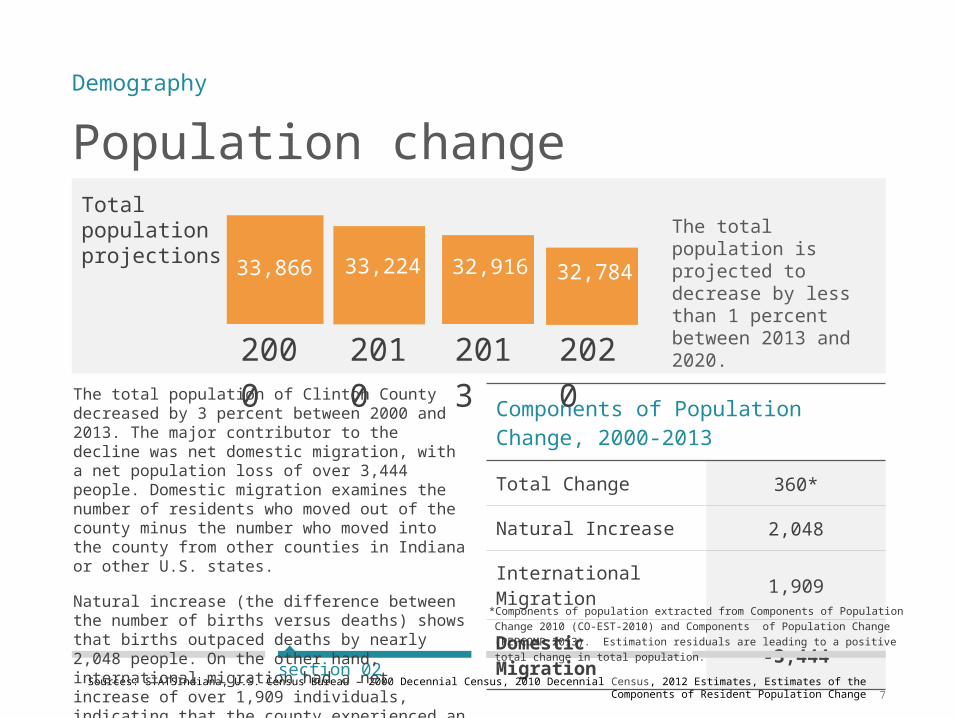
Population change
Components of Population Change, 2000-2013Total Change 360*
Natural Increase 2,048
International Migration 1,909
Domestic Migration -3,444
The total population is projected to decrease by less than 1 percent between 2013 and 2020.
Demography
Sources: STATSIndiana, U.S. Census Bureau – 2000 Decennial Census, 2010 Decennial Census, 2012 Estimates, Estimates of the Components of Resident Population Change
section 02
The total population of Clinton County decreased by 3 percent between 2000 and 2013. The major contributor to the decline was net domestic migration, with a net population loss of over 3,444 people. Domestic migration examines the number of residents who moved out of the county minus the number who moved into the county from other counties in Indiana or other U.S. states.
Natural increase (the difference between the number of births versus deaths) shows that births outpaced deaths by nearly 2,048 people. On the other hand, international migration had a net increase of over 1,909 individuals, indicating that the county experienced an influx of new people from outside the U.S.
33,866 33,224 32,784
2020
2013
2010
2000
Total population projections
*Components of population extracted from Components of Population Change 2010 (CO-EST-2010) and Components of Population Change (PEPCOMP 2013). Estimation residuals are leading to a positive total change in total population.
32,916
8
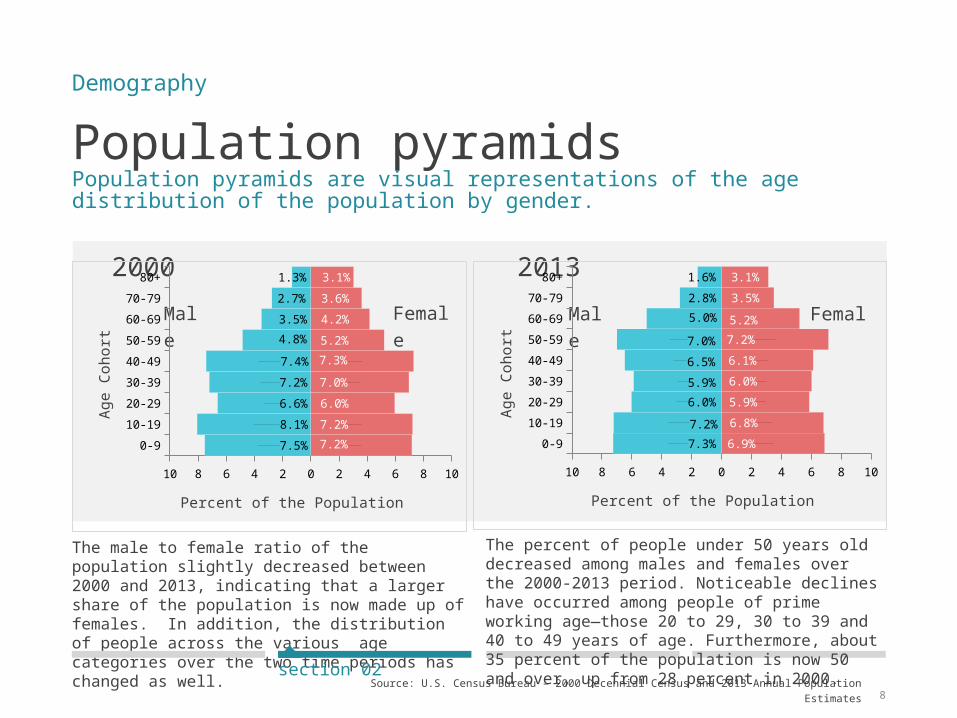
Population pyramidsPopulation pyramids are visual representations of the age distribution of the population by gender.
The male to female ratio of the population slightly decreased between 2000 and 2013, indicating that a larger share of the population is now made up of females. In addition, the distribution of people across the various age categories over the two time periods has changed as well.
Demography
Source: U.S. Census Bureau – 2000 Decennial Census and 2013 Annual Population Estimates
section 02
The percent of people under 50 years old decreased among males and females over the 2000-2013 period. Noticeable declines have occurred among people of prime working age—those 20 to 29, 30 to 39 and 40 to 49 years of age. Furthermore, about 35 percent of the population is now 50 and over, up from 28 percent in 2000.
Male
Female
20132000Male
Female
0-9
10-19
20-29
30-39
40-49
50-59
60-69
70-79
80+
10 8 6 4 2 0 2 4 6 8 10
7.5%8.1%6.6%7.2%7.4%4.8%3.5%2.7%1.3%
7.2%7.2%6.0%7.0%7.3%5.2%4.2%3.6%3.1%
Percent of the Population
Age
Coho
rt
0-9
10-19
20-29
30-39
40-49
50-59
60-69
70-79
80+
10 8 6 4 2 0 2 4 6 8 10
7.3%7.2%6.0%5.9%6.5%7.0%5.0%2.8%1.6%
6.9%6.8%5.9%6.0%6.1%7.2%5.2%3.5%3.1%
Percent of the PopulationAg
e Co
hort
9
Race
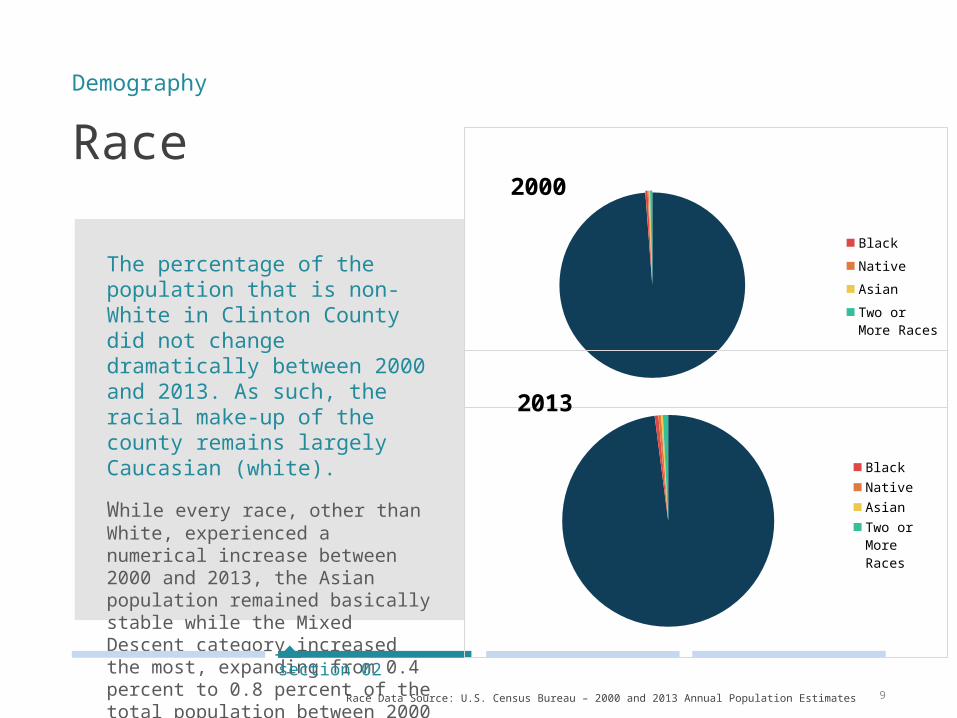
The percentage of the population that is non-White in Clinton County did not change dramatically between 2000 and 2013. As such, the racial make-up of the county remains largely Caucasian (white). While every race, other than White, experienced a numerical increase between 2000 and 2013, the Asian population remained basically stable while the Mixed Descent category increased the most, expanding from 0.4 percent to 0.8 percent of the total population between 2000 and 2013.
Demography
Race Data Source: U.S. Census Bureau – 2000 and 2013 Annual Population Estimates
section 02
White, 99%
2000
Black
Native
Asian
Two or More Races
White, 98%
2013
Black
Native
Asian
Two or More Races
10
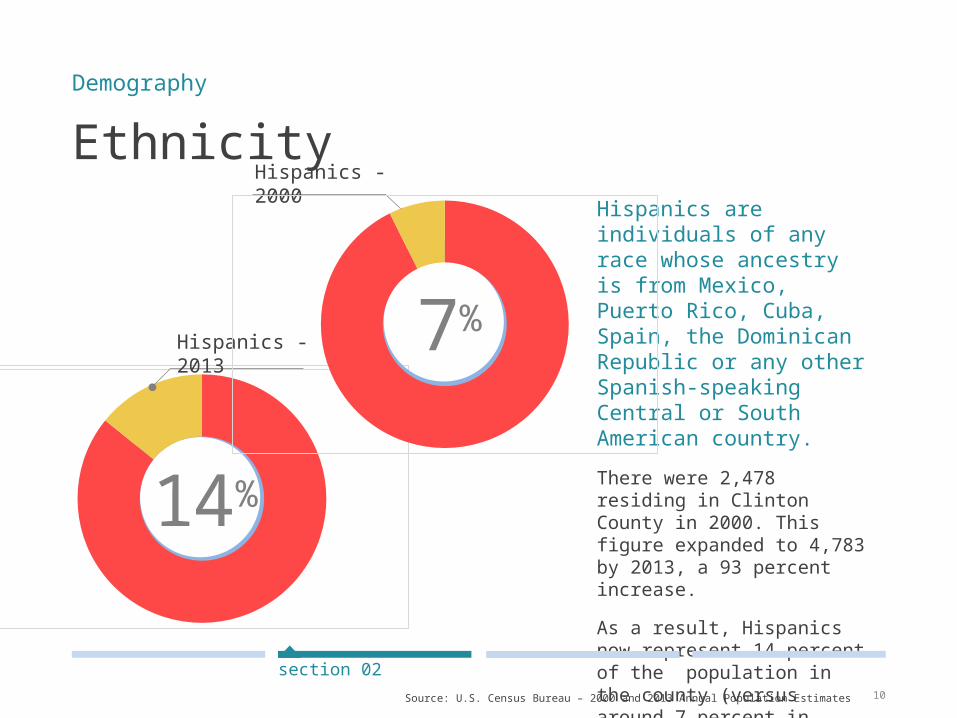
EthnicityHispanics are individuals of any race whose ancestry is from Mexico, Puerto Rico, Cuba, Spain, the Dominican Republic or any other Spanish-speaking Central or South American country.There were 2,478 residing in Clinton County in 2000. This figure expanded to 4,783 by 2013, a 93 percent increase. As a result, Hispanics now represent 14 percent of the population in the county (versus around 7 percent in 2000).
Demography
Source: U.S. Census Bureau – 2000 and 2013 Annual Population Estimates
section 02
14%
7%
Hispanics - 2000
Hispanics - 2013
11
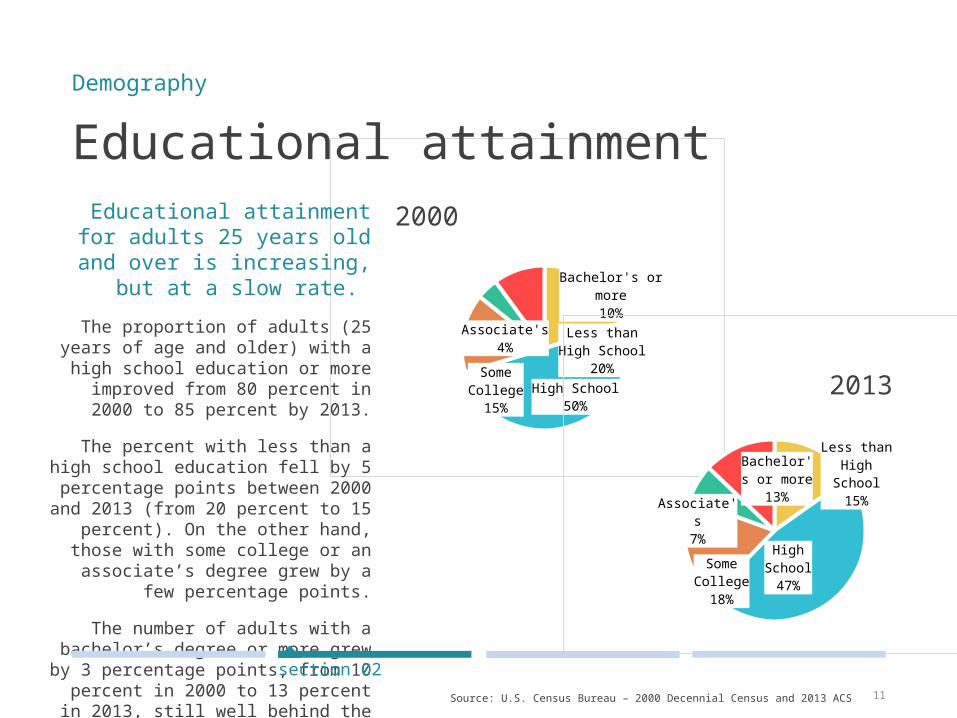
Less than High School
20%
High School50%
Some Col-lege15%
Associate's4%
Bachelor's or more10%
2000
Less than High
School15%
High School47%
Some Col-lege18%
Associate's7%
Bachelor's or more
13%
2013
Educational attainment Educational attainment for
adults 25 years old and over is increasing, but at a slow
rate. The proportion of adults (25 years of
age and older) with a high school education or more improved from 80
percent in 2000 to 85 percent by 2013.
The percent with less than a high school education fell by 5
percentage points between 2000 and 2013 (from 20 percent to 15
percent). On the other hand, those with some college or an associate’s
degree grew by a few percentage points.
The number of adults with a bachelor’s degree or more grew by 3
percentage points, from 10 percent in 2000 to 13 percent in 2013, still well behind the statewide figure of
over 23 percent.
Demography
Source: U.S. Census Bureau – 2000 Decennial Census and 2013 ACS
section 02
12
Takeaways
The population of Clinton County is expected to decrease over the next few years, and if past trends hold, that decrease will be largely due to out-migration. Were it not for natural increase or the influx of international migrants into Clinton County, the county’s total population loss would have been much larger over the past decade or more. With the changing population has come shifts in the age structure of the county. Since 2000, the county has experienced a relative growth of older residents (50 years of age or older), Worthy of attention is the falling percentage of people in the county of prime working age, individuals in the 20 to 29, 30 to 39 and 40 to 49 age groupings.
While the racial make-up of the county remains largely Caucasian (i.e., white), it has become more ethnically diverse as a result of the expansion of its Hispanic population – doubling from 7 percent to 14 percent of the population between 2000 and 2013. It is likely that the Hispanic population will continue to expand its presence in the coming years. The educational attainment of the county’s adult population (25 and over) has improved with more people completing a four-year college education or more. However, the percent of people with only a high school education remains quite sizable at 47 percent, suggesting that securing jobs that require high skilled, higher educated workers may be difficult to achieve in the near future.
Demography
section 02
Establishments
Industries
Occupations
Income and poverty
Takeaways
03economy
14
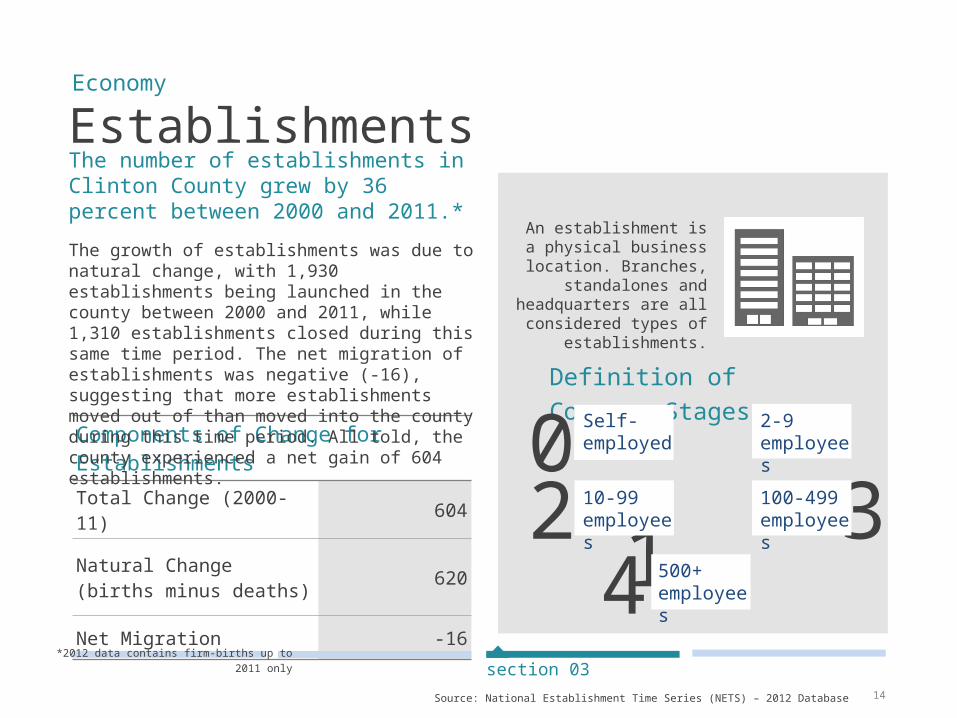
Establishments
Components of Change for EstablishmentsTotal Change (2000-11) 604
Natural Change (births minus deaths) 620
Net Migration -16
The number of establishments in Clinton County grew by 36 percent between 2000 and 2011.* The growth of establishments was due to natural change, with 1,930 establishments being launched in the county between 2000 and 2011, while 1,310 establishments closed during this same time period. The net migration of establishments was negative (-16), suggesting that more establishments moved out of than moved into the county during this time period. All told, the county experienced a net gain of 604 establishments.
Economy
Source: National Establishment Time Series (NETS) – 2012 Database
section 03
An establishment is a physical business
location. Branches, standalones and
headquarters are all considered types of
establishments.
Definition of Company Stages0 12 3
4
Self-employed
2-9 employees
10-99employees
100-499employees
500+employees
*2012 data contains firm-births up to 2011 only
15
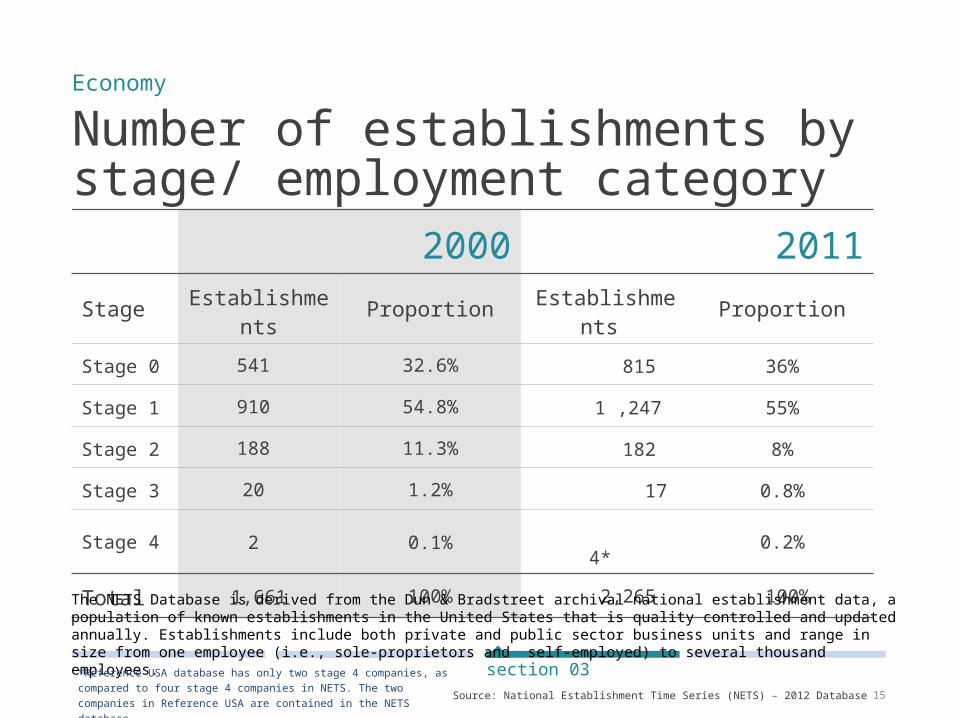
Number of establishments by stage/ employment category
Economy
Source: National Establishment Time Series (NETS) – 2012 Database
section 03
2000 2011Stage Establishme
nts Proportion Establishments Proportion
Stage 0 541 32.6% 815 36%
Stage 1 910 54.8% 1 ,247 55%
Stage 2 188 11.3% 182 8%
Stage 3 20 1.2% 17 0.8%
Stage 4 2 0.1% 4* 0.2%
Total 1,661 100% 2,265 100%The NETS Database is derived from the Dun & Bradstreet archival national establishment data, a population of known establishments in the United States that is quality controlled and updated annually. Establishments include both private and public sector business units and range in size from one employee (i.e., sole-proprietors and self-employed) to several thousand employees.
*Reference USA database has only two stage 4 companies, as compared to four stage 4 companies in NETS. The two companies in Reference USA are contained in the NETS database.
16
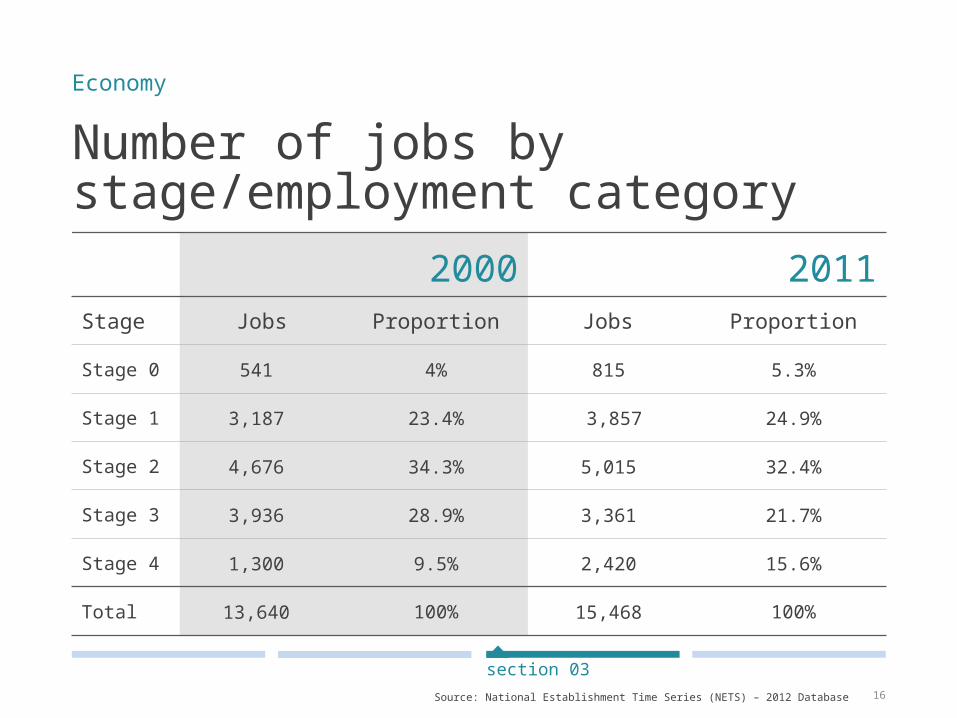
Number of jobs by stage/employment category
Economy
Source: National Establishment Time Series (NETS) – 2012 Database
section 03
2000 2011Stage Jobs Proportion Jobs Proportion
Stage 0 541 4% 815 5.3%
Stage 1 3,187 23.4% 3,857 24.9%
Stage 2 4,676 34.3% 5,015 32.4%
Stage 3 3,936 28.9% 3,361 21.7%
Stage 4 1,300 9.5% 2,420 15.6%
Total 13,640 100% 15,468 100%
17
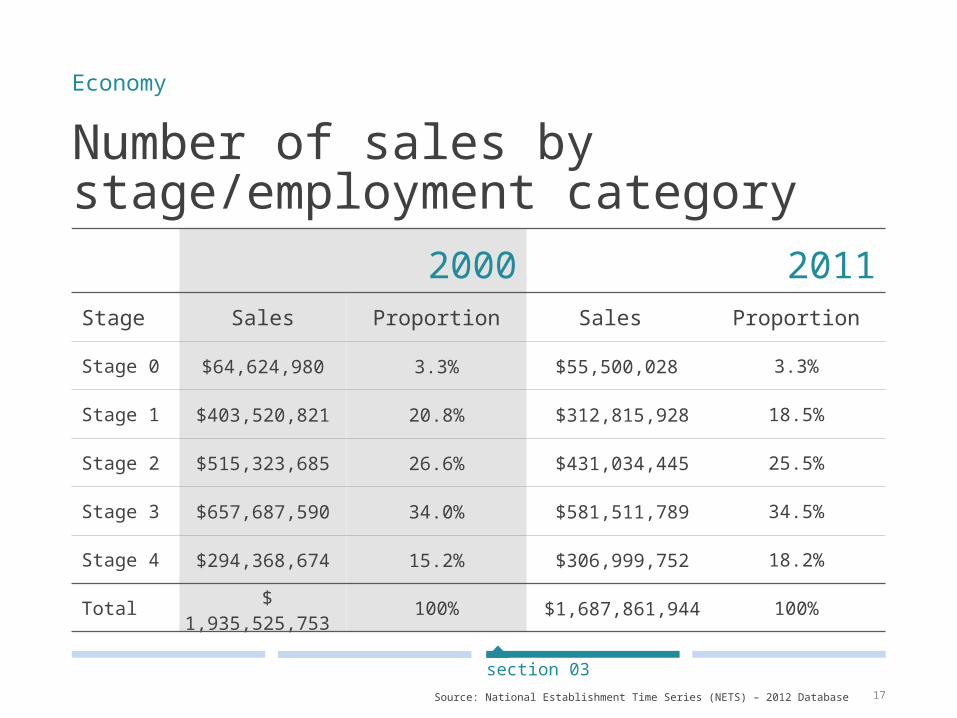
Number of sales by stage/employment category
Economy
Source: National Establishment Time Series (NETS) – 2012 Database
section 03
2000 2011Stage Sales Proportion Sales Proportion
Stage 0 $64,624,980 3.3% $55,500,028 3.3%
Stage 1 $403,520,821 20.8% $312,815,928 18.5%
Stage 2 $515,323,685 26.6% $431,034,445 25.5%
Stage 3 $657,687,590 34.0% $581,511,789 34.5%
Stage 4 $294,368,674 15.2% $306,999,752 18.2%
Total $ 1,935,525,753 100% $1,687,861,944 100%
18
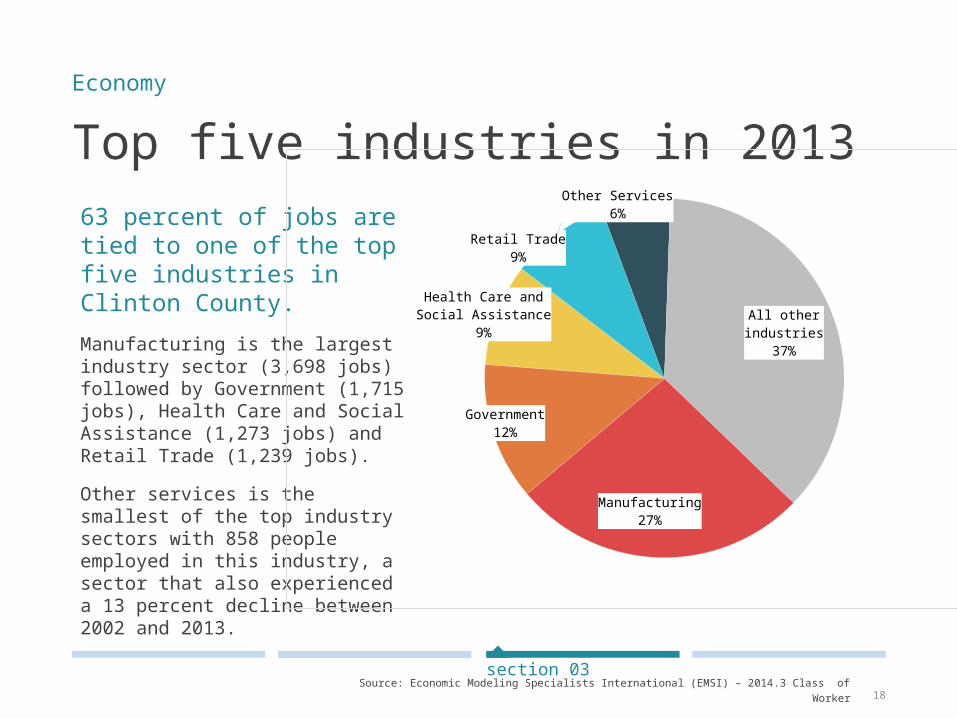
Top five industries in 201363 percent of jobs are tied to one of the top five industries in Clinton County.Manufacturing is the largest industry sector (3,698 jobs) followed by Government (1,715 jobs), Health Care and Social Assistance (1,273 jobs) and Retail Trade (1,239 jobs).Other services is the smallest of the top industry sectors with 858 people employed in this industry, a sector that also experienced a 13 percent decline between 2002 and 2013.
Economy
section 03
Manufacturing27%
Government12%
Health Care and Social Assistance
9%
Other Services6%
Retail Trade9%
All other industries37%
Source: Economic Modeling Specialists International (EMSI) – 2014.3 Class of Worker
19
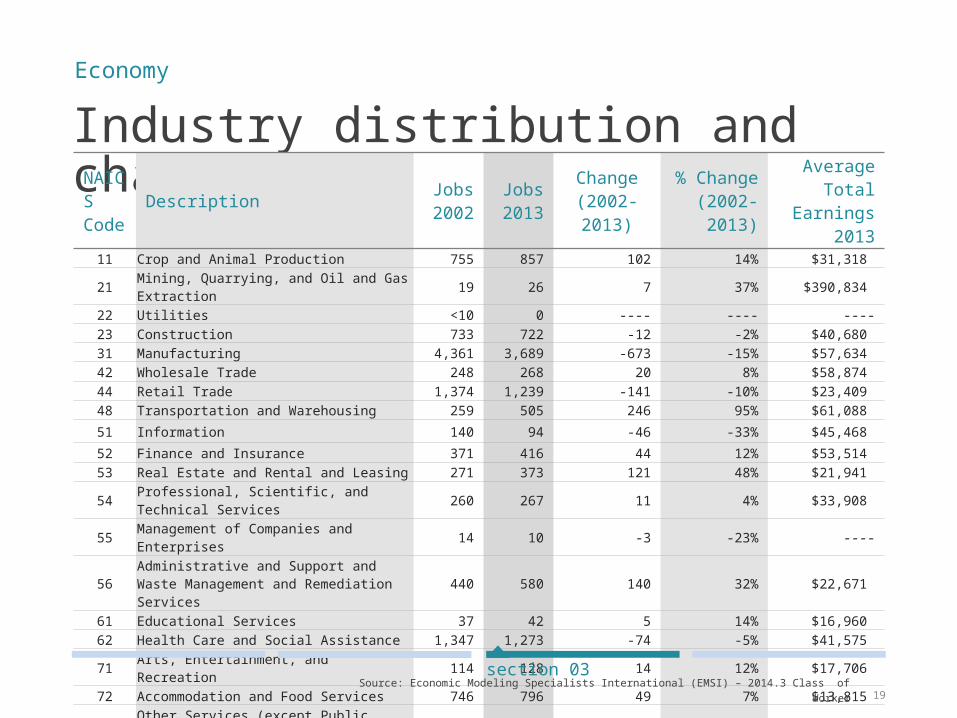
Industry distribution and changeNAICS Code
Description Jobs 2002
Jobs 2013
Change (2002-2013)
% Change (2002-2013)
Average Total
Earnings 2013
11 Crop and Animal Production 755 857 102 14% $31,318 21 Mining, Quarrying, and Oil and Gas
Extraction 19 26 7 37% $390,834 22 Utilities <10 0 ---- ---- ----23 Construction 733 722 -12 -2% $40,680 31 Manufacturing 4,361 3,689 -673 -15% $57,634 42 Wholesale Trade 248 268 20 8% $58,874 44 Retail Trade 1,374 1,239 -141 -10% $23,409 48 Transportation and Warehousing 259 505 246 95% $61,088 51 Information 140 94 -46 -33% $45,468 52 Finance and Insurance 371 416 44 12% $53,514 53 Real Estate and Rental and Leasing 271 373 121 48% $21,941 54 Professional, Scientific, and Technical
Services 260 267 11 4% $33,908
55 Management of Companies and Enterprises 14 10 -3 -23% ----
56 Administrative and Support and Waste Management and Remediation Services 440 580 140 32% $22,671
61 Educational Services 37 42 5 14% $16,960 62 Health Care and Social Assistance 1,347 1,273 -74 -5% $41,575 71 Arts, Entertainment, and Recreation 114 128 14 12% $17,706 72 Accommodation and Food Services 746 796 49 7% $13,815 81 Other Services (except Public
Administration) 963 858 -131 -13% $19,466 90 Government 1,689 1,715 26 2% $44,322 99 Unclassified Industry ---- ---- 0 0% ----
All Total 14,148 13,859 -301 -2% $41,252
Economy
section 03 Source: Economic Modeling Specialists International (EMSI) – 2014.3 Class of Worker
20
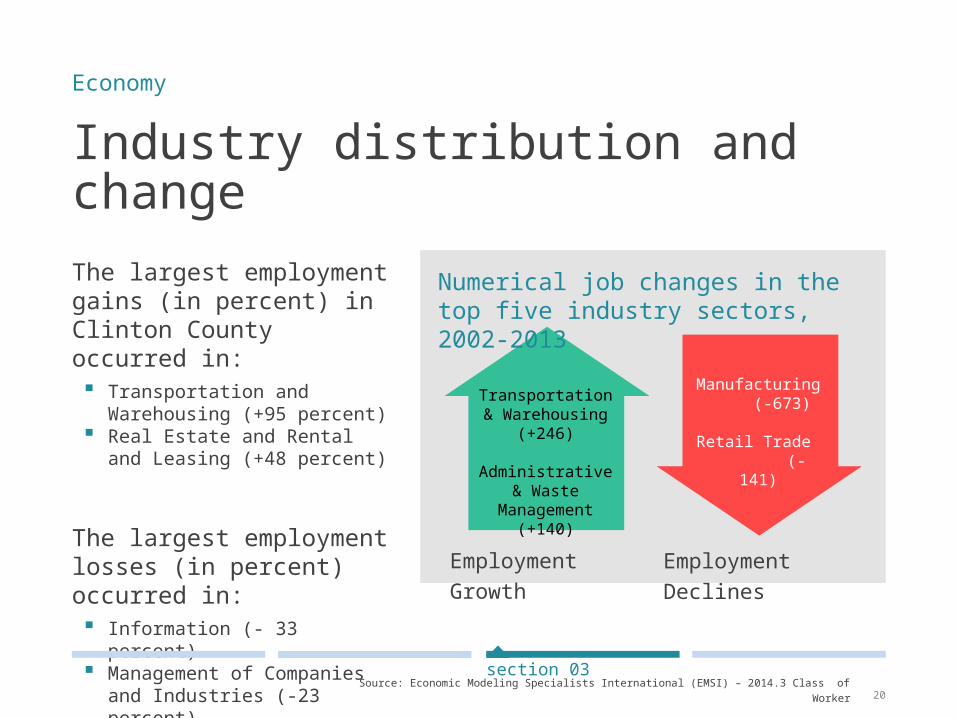
Industry distribution and change
The largest employment gains (in percent) in Clinton County occurred in: Transportation and
Warehousing (+95 percent) Real Estate and Rental and
Leasing (+48 percent)
The largest employment losses (in percent) occurred in: Information (- 33 percent) Management of Companies
and Industries (-23 percent)
Economy
section 03
Employment Growth
Employment Declines
Numerical job changes in the top five industry sectors, 2002-2013
Transportation & Warehousing
(+246)
Administrative & Waste
Management(+140)
Manufacturing (-673)
Retail Trade (-141)
Source: Economic Modeling Specialists International (EMSI) – 2014.3 Class of Worker
21
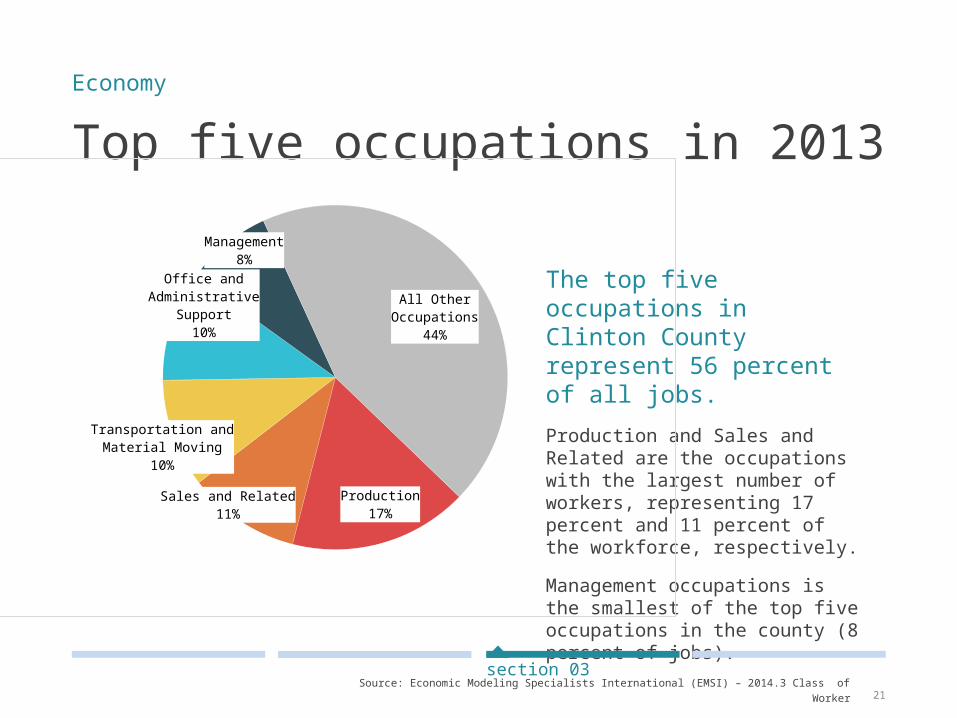
Top five occupations in 2013
The top five occupations in Clinton County represent 56 percent of all jobs.Production and Sales and Related are the occupations with the largest number of workers, representing 17 percent and 11 percent of the workforce, respectively.Management occupations is the smallest of the top five occupations in the county (8 percent of jobs).
Economy
section 03
Production17%
Sales and Related11%
Transportation and Material Moving
10%
Office and Adminis-trative Support
10%
Management8%
All Other Occupations44%
Source: Economic Modeling Specialists International (EMSI) – 2014.3 Class of Worker
22
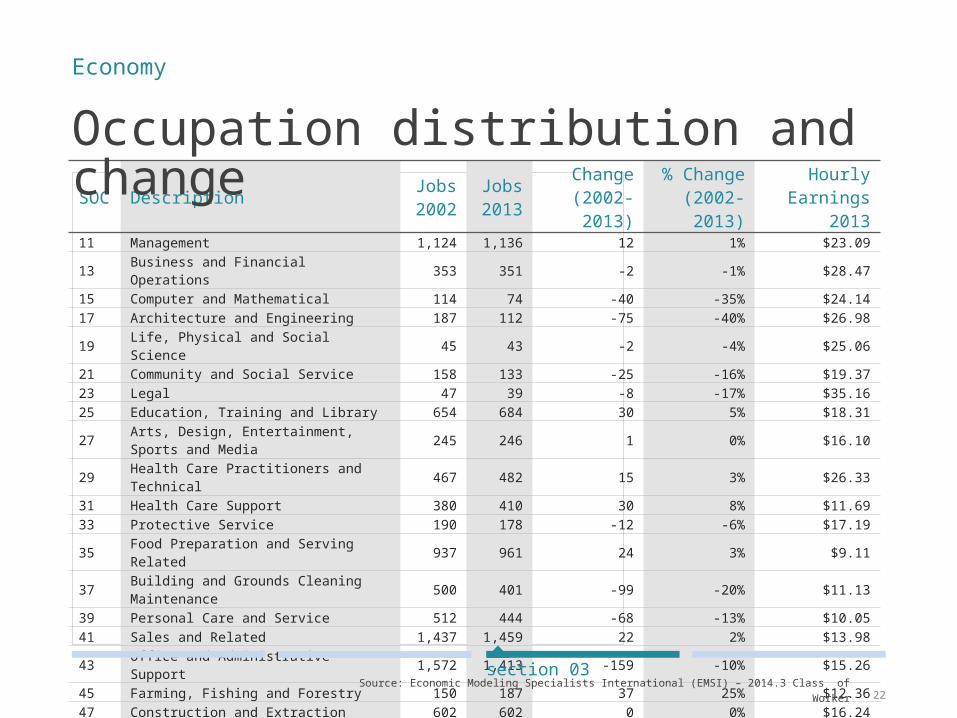
SOC Description Jobs
2002Jobs
2013Change(2002-2013)
% Change (2002-2013)
Hourly Earnings
201311 Management 1,124 1,136 12 1% $23.0913 Business and Financial Operations 353 351 -2 -1% $28.4715 Computer and Mathematical 114 74 -40 -35% $24.1417 Architecture and Engineering 187 112 -75 -40% $26.9819 Life, Physical and Social Science 45 43 -2 -4% $25.0621 Community and Social Service 158 133 -25 -16% $19.3723 Legal 47 39 -8 -17% $35.1625 Education, Training and Library 654 684 30 5% $18.3127 Arts, Design, Entertainment, Sports
and Media 245 246 1 0% $16.10
29 Health Care Practitioners and Technical 467 482 15 3% $26.33
31 Health Care Support 380 410 30 8% $11.6933 Protective Service 190 178 -12 -6% $17.1935 Food Preparation and Serving Related 937 961 24 3% $9.1137 Building and Grounds Cleaning
Maintenance 500 401 -99 -20% $11.1339 Personal Care and Service 512 444 -68 -13% $10.0541 Sales and Related 1,437 1,459 22 2% $13.9843 Office and Administrative Support 1,572 1,413 -159 -10% $15.2645 Farming, Fishing and Forestry 150 187 37 25% $12.3647 Construction and Extraction 602 602 0 0% $16.2449 Installation, Maintenance and Repair 573 547 -26 -5% $18.5051 Production 2,472 2,324 -148 -6% $15.6553 Transportation and Material Moving 1,273 1,417 144 11% $15.6655 Military 112 107 -5 -4% $18.9999 Unclassified 57 108 51 89% $11.01All Total 14,160 13,859 -301 -2% $16.36
Occupation distribution and change
Economy
section 03 Source: Economic Modeling Specialists International (EMSI) – 2014.3 Class of Worker
23
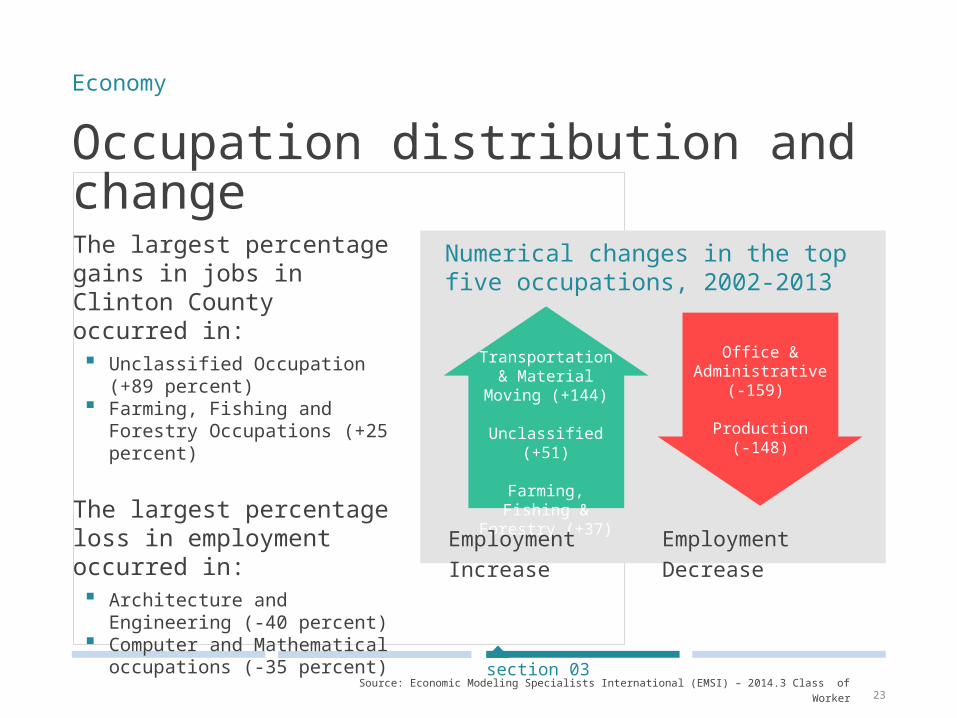
Occupation distribution and change
Economy
Source: Economic Modeling Specialists International (EMSI) – 2014.3 Class of Worker
section 03
The largest percentage gains in jobs in Clinton County occurred in: Unclassified Occupation (+89
percent) Farming, Fishing and Forestry
Occupations (+25 percent)
The largest percentage loss in employment occurred in: Architecture and Engineering
(-40 percent) Computer and Mathematical
occupations (-35 percent)
Numerical changes in the top five occupations, 2002-2013
Transportation & Material Moving
(+144)
Unclassified (+51)
Farming, Fishing & Forestry (+37)
Office & Administrative
(-159)
Production(-148)
Employment Increase
Employment Decrease
24
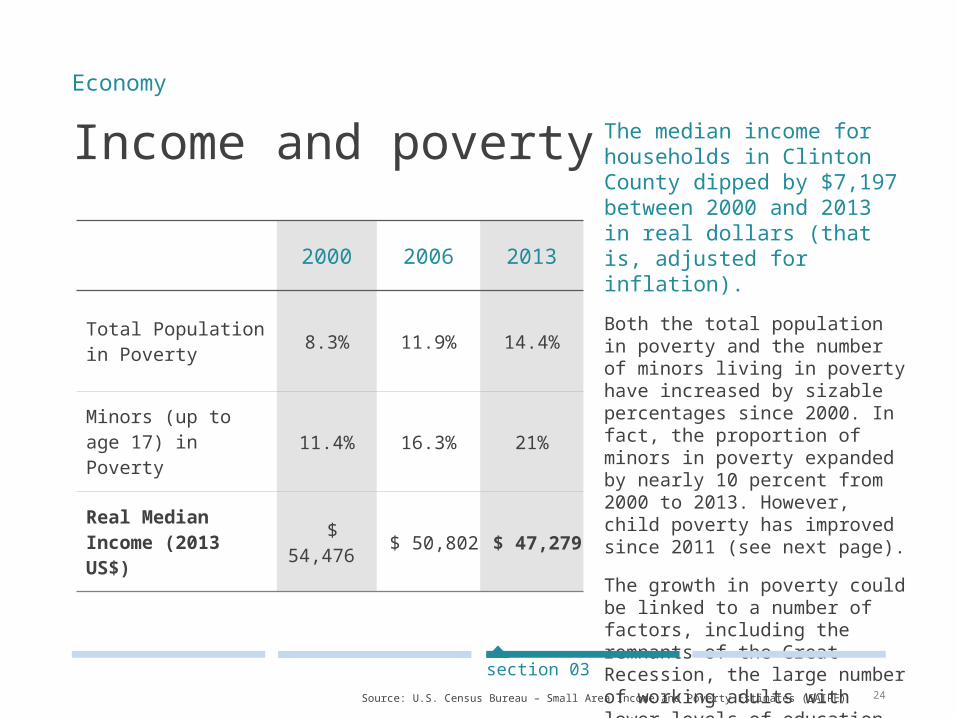
Income and poverty
2000 2006 2013
Total Population in Poverty 8.3% 11.9% 14.4%
Minors (up to age 17) in Poverty 11.4% 16.3% 21%
Real Median Income (2013 US$)
$ 54,476 $ 50,802 $ 47,279
The median income for households in Clinton County dipped by $7,197 between 2000 and 2013 in real dollars (that is, adjusted for inflation).Both the total population in poverty and the number of minors living in poverty have increased by sizable percentages since 2000. In fact, the proportion of minors in poverty expanded by nearly 10 percent from 2000 to 2013. However, child poverty has improved since 2011 (see next page).The growth in poverty could be linked to a number of factors, including the remnants of the Great Recession, the large number of working adults with lower levels of education, and the loss of higher paying jobs in the manufacturing sector.
Economy
Source: U.S. Census Bureau – Small Area Income and Poverty Estimates (SAIPE)
section 03
25
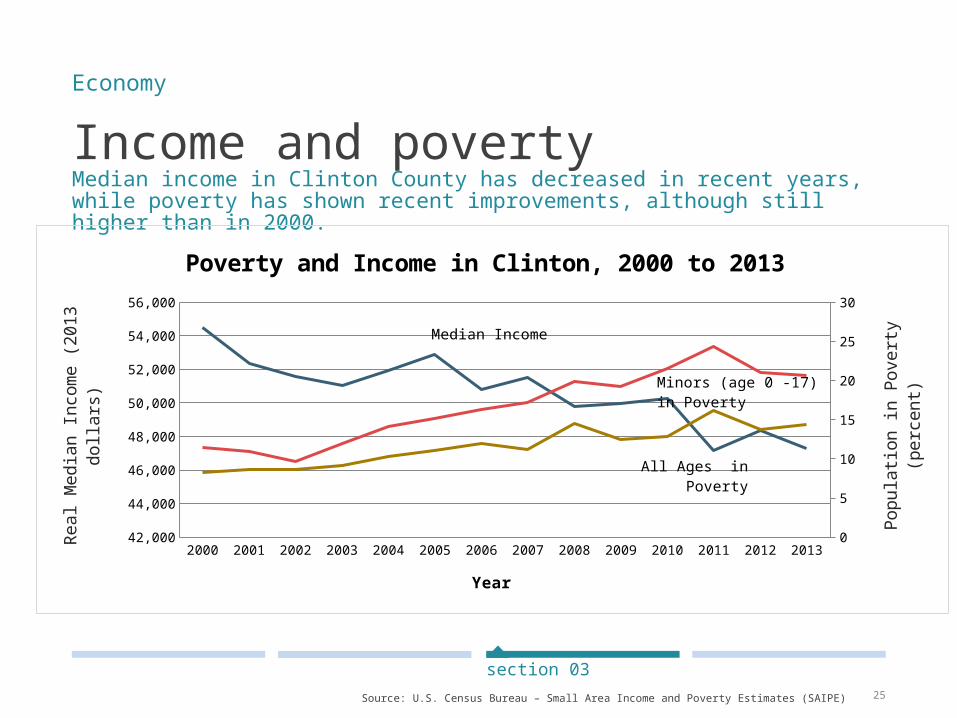
Income and povertyMedian income in Clinton County has decreased in recent years, while poverty has shown recent improvements, although still higher than in 2000.
Economy
Source: U.S. Census Bureau – Small Area Income and Poverty Estimates (SAIPE)
section 03
2000 2001 2002 2003 2004 2005 2006 2007 2008 2009 2010 2011 2012 201342,000
44,000
46,000
48,000
50,000
52,000
54,000
56,000
0
5
10
15
20
25
30
Poverty and Income in Clinton, 2000 to 2013
Year
Real
Med
ian
Inco
me
(201
3 do
llars
)
Popu
latio
n in
Pov
erty
(per
cent
)
Median Income
All Ages in Poverty
Minors (age 0 -17) in Poverty
26
Takeaways The greatest growth in establishments in Clinton County occurred in businesses having fewer than 10 employees. So, focusing on the needs of the self-employed (Stage 0) and Stage 1 establishments (those with 2 to 9 employees) may be worth considering. At the same time, Stage 2 firms, while experiencing a small decline in the number of establishments over the 2000 to 2011 time period, added nearly 340 jobs. So, attending to the growth possibilities of Stage 2 establishments would be a smart move. Of course, the impressive job gains among Stage 4 establishments in the county is worthy of note; they added over 1,110 jobs to the County’s economy between 2000 and 2011. In sum, it is important for Clinton County to continue pursuing a balanced economic development portfolio. This includes a concerted effort to promote the growth of Stage 1 and 2 companies in the area.
Among the top five industries in Clinton County, only government experienced growth between 2002 and 2013, a modest 2 percent increase. While median income decreased over the past decade, the percentage of people in poverty grew, although recent data suggest that poverty rates for both adults and children have experienced modest declines since 2011. Promoting job growth for occupations requiring educated workers could be a good way to retain working adults with higher levels of educational attainment. Moreover, it would help boost the median income of individuals in the county. In light of the number of people falling below the poverty line, it will be important to target services to these individuals, especially those with children. Efforts to expand training and work opportunities for those able to move into the workforce will be something worth considering.
Economy
section 03

Labor force and unemployment
Commuteshed
Laborshed
Takeaways
04labormarket
28
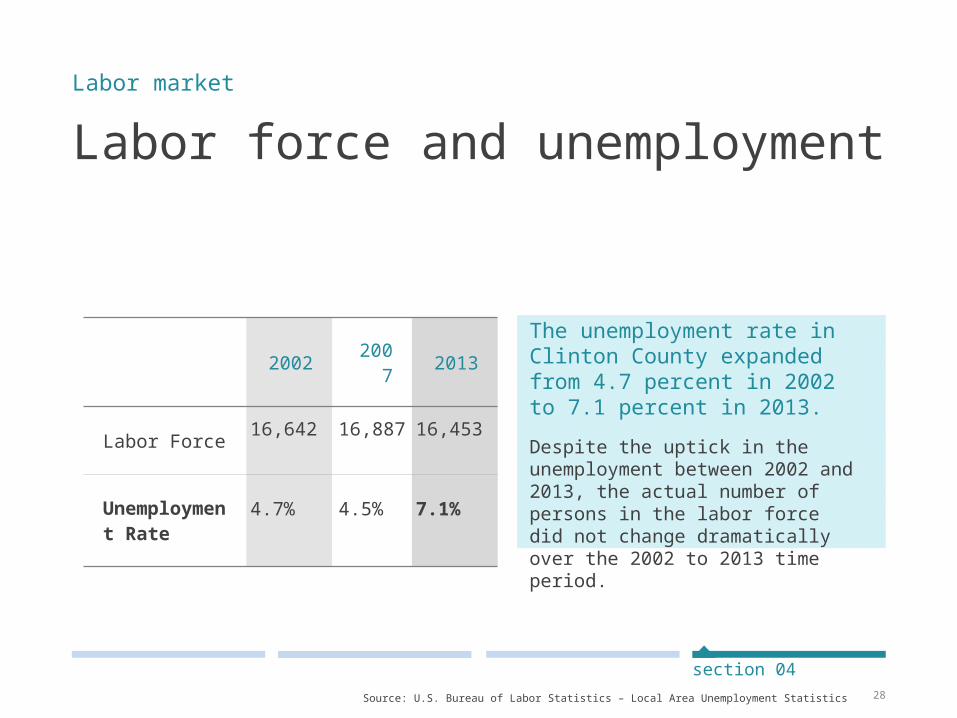
Labor force and unemployment
2002 2007 2013
Labor Force 16,642
16,887 16,453
Unemployment Rate 4.7% 4.5% 7.1%
The unemployment rate in Clinton County expanded from 4.7 percent in 2002 to 7.1 percent in 2013. Despite the uptick in the unemployment between 2002 and 2013, the actual number of persons in the labor force did not change dramatically over the 2002 to 2013 time period.
Labor market
Source: U.S. Bureau of Labor Statistics – Local Area Unemployment Statistics
section 04
29
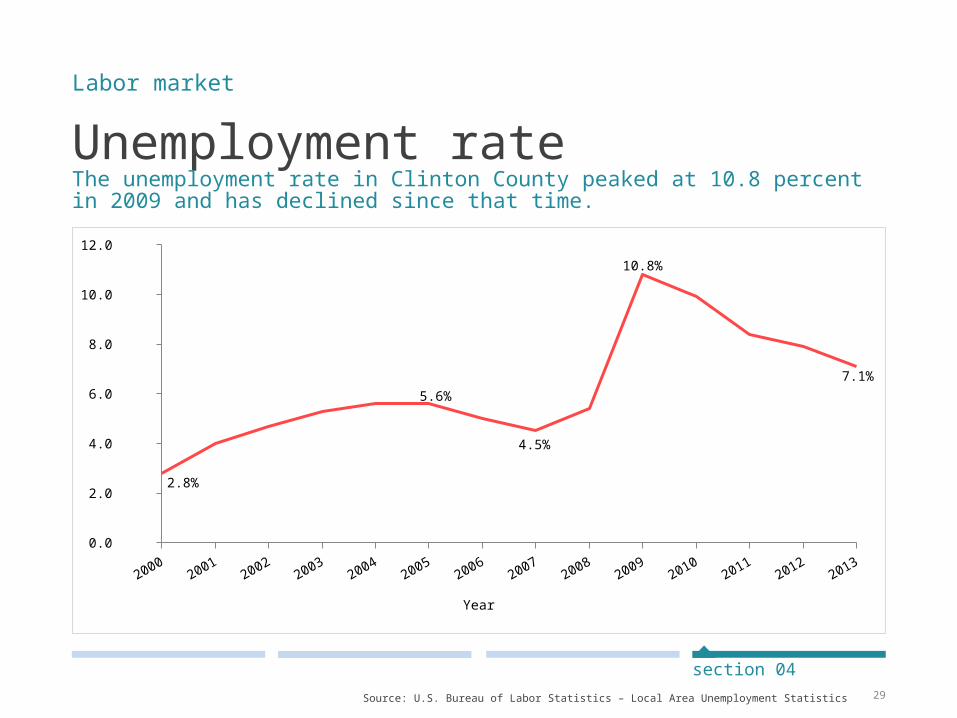
Unemployment rateThe unemployment rate in Clinton County peaked at 10.8 percent in 2009 and has declined since that time.
Labor market
Source: U.S. Bureau of Labor Statistics – Local Area Unemployment Statistics
section 04
20002001
20022003
20042005
20062007
20082009
20102011
20122013
0.0
2.0
4.0
6.0
8.0
10.0
12.0
2.8%
5.6%
4.5%
10.8%
7.1%
Year
30
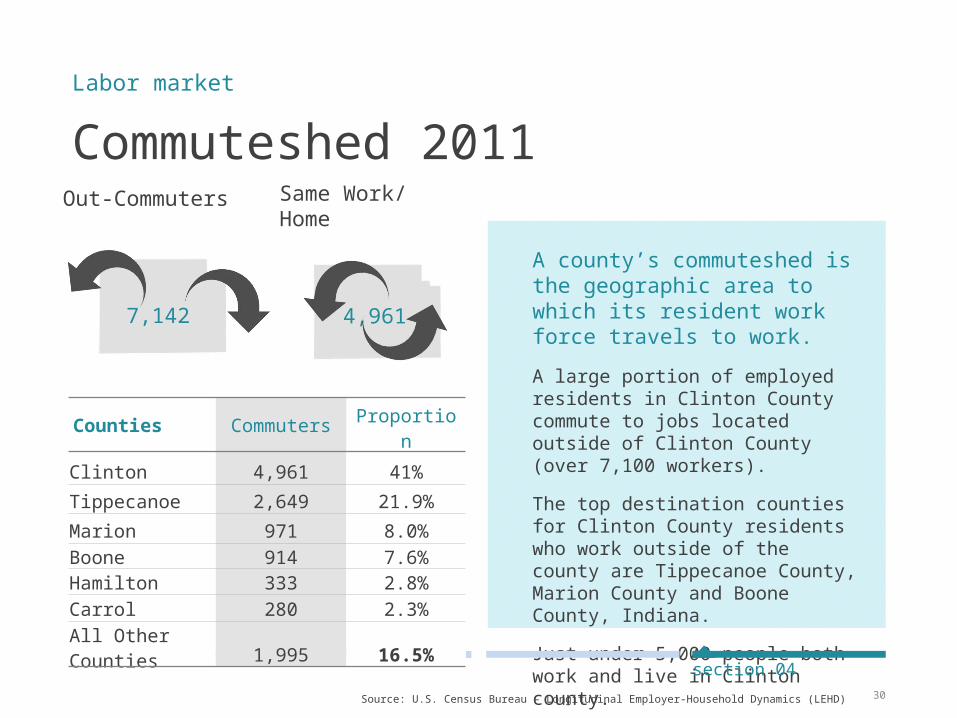
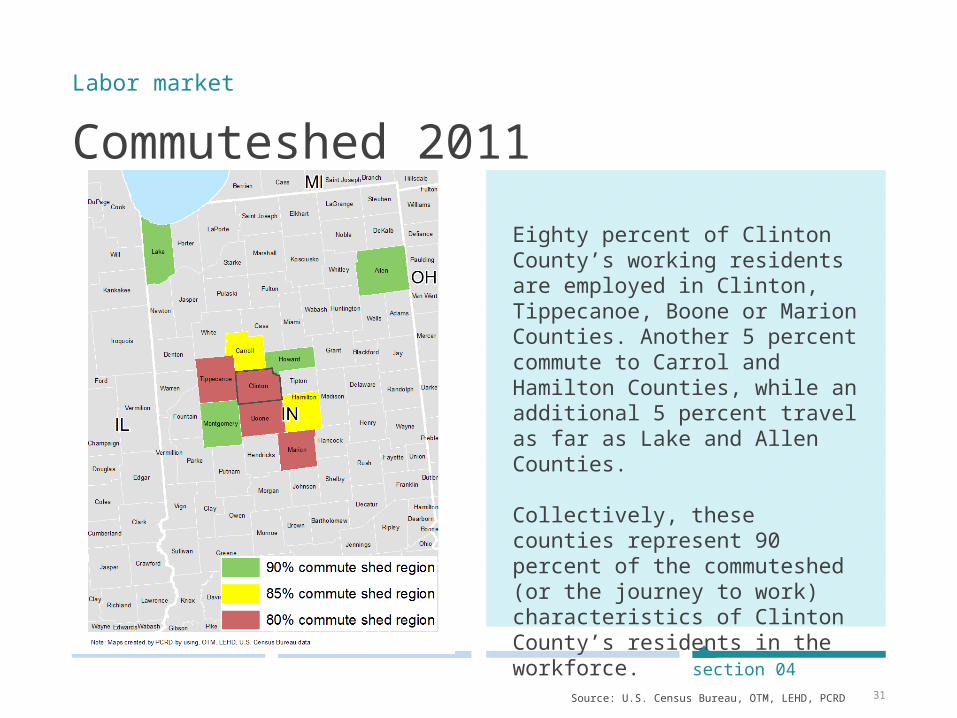
Commuteshed 2011
A county’s commuteshed is the geographic area to which its resident work force travels to work.A large portion of employed residents in Clinton County commute to jobs located outside of Clinton County (over 7,100 workers). The top destination counties for Clinton County residents who work outside of the county are Tippecanoe County, Marion County and Boone County, Indiana. Just under 5,000 people both work and live in Clinton county.
Labor market
Source: U.S. Census Bureau – Longitudinal Employer-Household Dynamics (LEHD)
section 04
7,142
Out-Commuters
4,961
Same Work/Home
Counties Commuters ProportionClinton 4,961 41%Tippecanoe 2,649 21.9%Marion 971 8.0%Boone 914 7.6%Hamilton 333 2.8%Carrol 280 2.3%All Other Counties 1,995 16.5%
31
Commuteshed 2011Labor market
section 04 Source: U.S. Census Bureau, OTM, LEHD, PCRD
Eighty percent of Clinton County’s working residents are employed in Clinton, Tippecanoe, Boone or Marion Counties. Another 5 percent commute to Carrol and Hamilton Counties, while an additional 5 percent travel as far as Lake and Allen Counties.
Collectively, these counties represent 90 percent of the commuteshed (or the journey to work) characteristics of Clinton County’s residents in the workforce.
32
Laborshed 2011
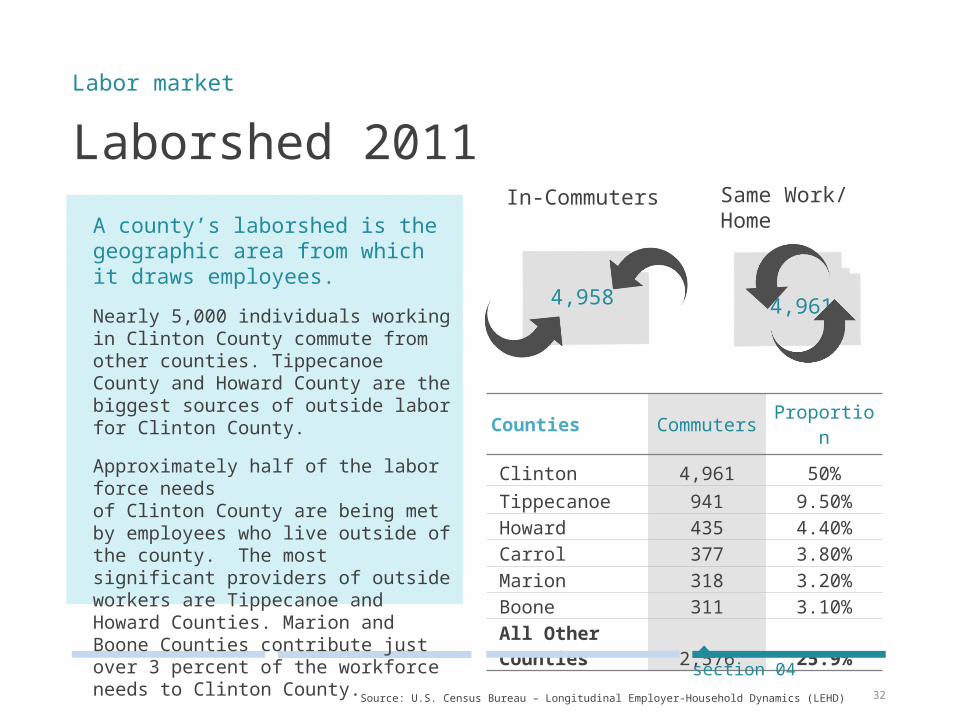
Counties Commuters Proportion
Clinton 4,961 50%Tippecanoe 941 9.50%Howard 435 4.40%Carrol 377 3.80%Marion 318 3.20%Boone 311 3.10%All Other Counties 2,576 25.9%
Labor market
Source: U.S. Census Bureau – Longitudinal Employer-Household Dynamics (LEHD)
section 04
4,958
In-Commuters
4,961
Same Work/HomeA county’s laborshed is the
geographic area from which it draws employees.Nearly 5,000 individuals working in Clinton County commute from other counties. Tippecanoe County and Howard County are the biggest sources of outside labor for Clinton County.Approximately half of the labor force needs of Clinton County are being met by employees who live outside of the county. The most significant providers of outside workers are Tippecanoe and Howard Counties. Marion and Boone Counties contribute just over 3 percent of the workforce needs to Clinton County.
33
Laborshed 2011Labor market
section 04 Source: U.S. Census Bureau, OTM, LEHD, PCRD
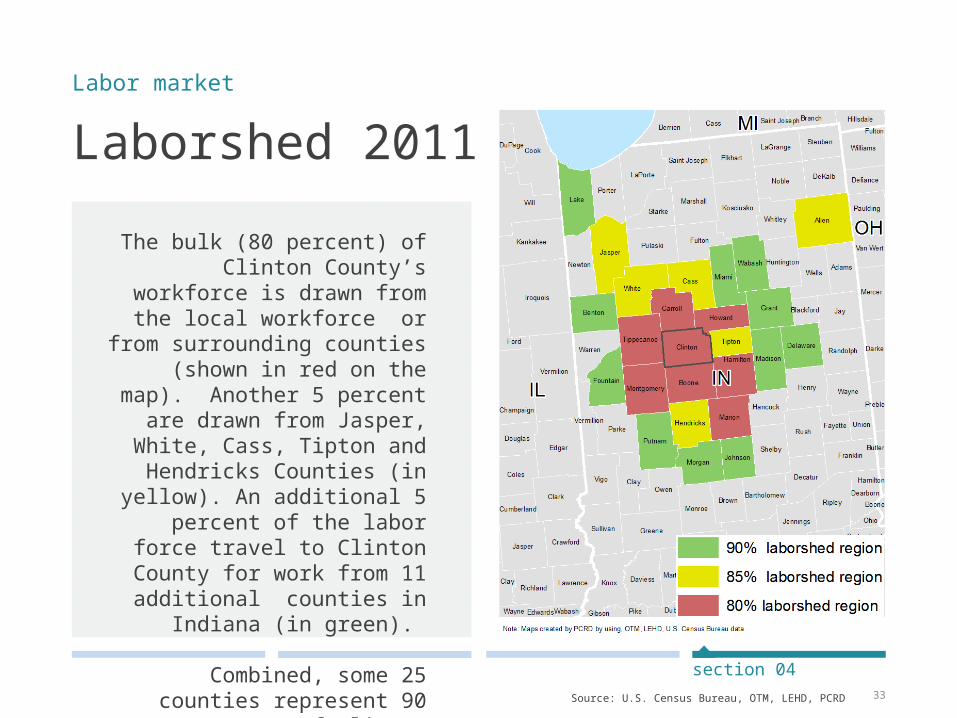
The bulk (80 percent) of Clinton County’s workforce is
drawn from the local workforce or from
surrounding counties (shown in red on the map). Another 5
percent are drawn from Jasper, White, Cass, Tipton and Hendricks Counties (in
yellow). An additional 5 percent of the labor force
travel to Clinton County for work from 11 additional
counties in Indiana (in green).
Combined, some 25 counties represent 90 percent of
Clinton County’s laborshed.
34
Takeaways Clinton County’s unemployment rate swelled between 2000 and 2009 but has since declined. The major uptick in unemployment was linked, in no small way, to the economic challenges associated with the Great Recession. With the improving economic forces in the nation and state of Indiana, there is every reason to believe that unemployment rate will continue to improve in the county. Over 7,100 labor members who live in Clinton County are employed outside of the county, while approximately 5,000 workers from outside the county work in Clinton County. In essence, this means that the county is experiencing a net loss of over 2,100 workers. Determining the human capital attributes of workers who commute to jobs outside the county
could be insightful. It could provide the information needed to determine how best to reduce the leakage of educated and skilled workers to surrounding counties. In light of the strong economic connection of Clinton County to surrounding counties, it may make sense to explore regional economic development strategies that build on the economic assets of the entire region. Given the decline in the county’s median income, finding ways to improve the skills of the workforce could be critical. The recent expansion of Ivy Tech in the county could be an important conduit for expanding workforce development opportunities for current and future labor force participants.
Labor market
section 04
35
Report ContributorsThis report was prepared by the Purdue Center for Regional Development in partnership with Purdue University Extension.
section 04
Data AnalysisIndraneel Kumar, Ph.D.Ayoung KimMichael Wilcox. Ph.D.
Report AuthorsElizabeth DobisFrancisco ScottBo Beaulieu, Ph.D.
Report DesignTyler WrightAdeline Jackson
It is the policy of the Purdue University Cooperative Extension Service that all persons have equal opportunity and access to its educational programs, services, activities, and facilities without regard to race, religion, color, sex, age, national origin or ancestry, marital status, parental status, sexual orientation, disability or status as a veteran. Purdue University is an Affirmative Action institution. This material may be available in alternative formats.

FOR MORE INFORMATION
Purdue Center for Regional Development (PCRD) . . .seeks to pioneer new ideas and strategies that contribute to regional collaboration, innovation and prosperity.
Purdue Extension Community Development (CD) . . . works to strengthen the capacity of local leaders, residents and organizations to work together to develop and sustain strong, vibrant communities.
Please contact
Melinda GrismerCounty Extension Director & Community Development Educator765-659-6380 [email protected] OR