Embed Size (px)
Citation preview
Clinical and Translational Science Institute / CTSI Accelerating Research to Improve Health S F U C
Deconstructing a Dashboard:Inside the UCSF Profiles Team’s Monthly Key Metrics Anirvan Chatterjee, Brian Turner, MBA
Clinical and Translational Science Institute, University of California, San Francisco
This work was supported by the National Center for Advancing Translational Sciences, National Institutes of
Health, through UCSF-CTSI Grant Number UL1 TR000004.Its contents are solely the responsibility of the authors and do not necessarily represent the official views of the NIH.
As research networking platforms like VIVO and Profiles RNS become commoditized, our focus shifts from building technology to enabling and tracking meaningful use. The UCSF Profiles team at UC San Francisco’s Clinical & Translational Science Institute has published a monthly dashboard of key website metrics for over three years. The data is derived from Google Analytics reports and pulled into Excel, where it’s presented as a simple dashboard showing the latest metrics and ongoing trends. This is emailed to about a dozen stakeholders every month, along with 1-3 paragraphs of commentary. This might include discussions of traffic issues, links to Profiles from news sources, upcoming areas of concern, and updates on previously reported issues. Our key metrics change over time, based on current needs, but we rely heavily on the CTSA Research Networking Affinity Group’s Recommendations for RNS Usage Tracking released at VIVO 2013. In addition to website usage metrics, we also collect metrics on UCSF Profiles customization rates on a separate automatically-updated online dashboard. As of July 2014: • 6,831 users on UCSF Profiles • 71% (4,507) have publications • 52% (3,329) have web links • 30% (1,928) have a photo • 19% (1,184) have a narrative/bio • 14% (910) have NIH grants listed • 10% (647) have news story links • 9% (594) have awards/honors • 8% (504) have global health profiles • 7% (471) have user-generated keywords • 1% (48) have Twitter accounts • 1% (93) have featured publications
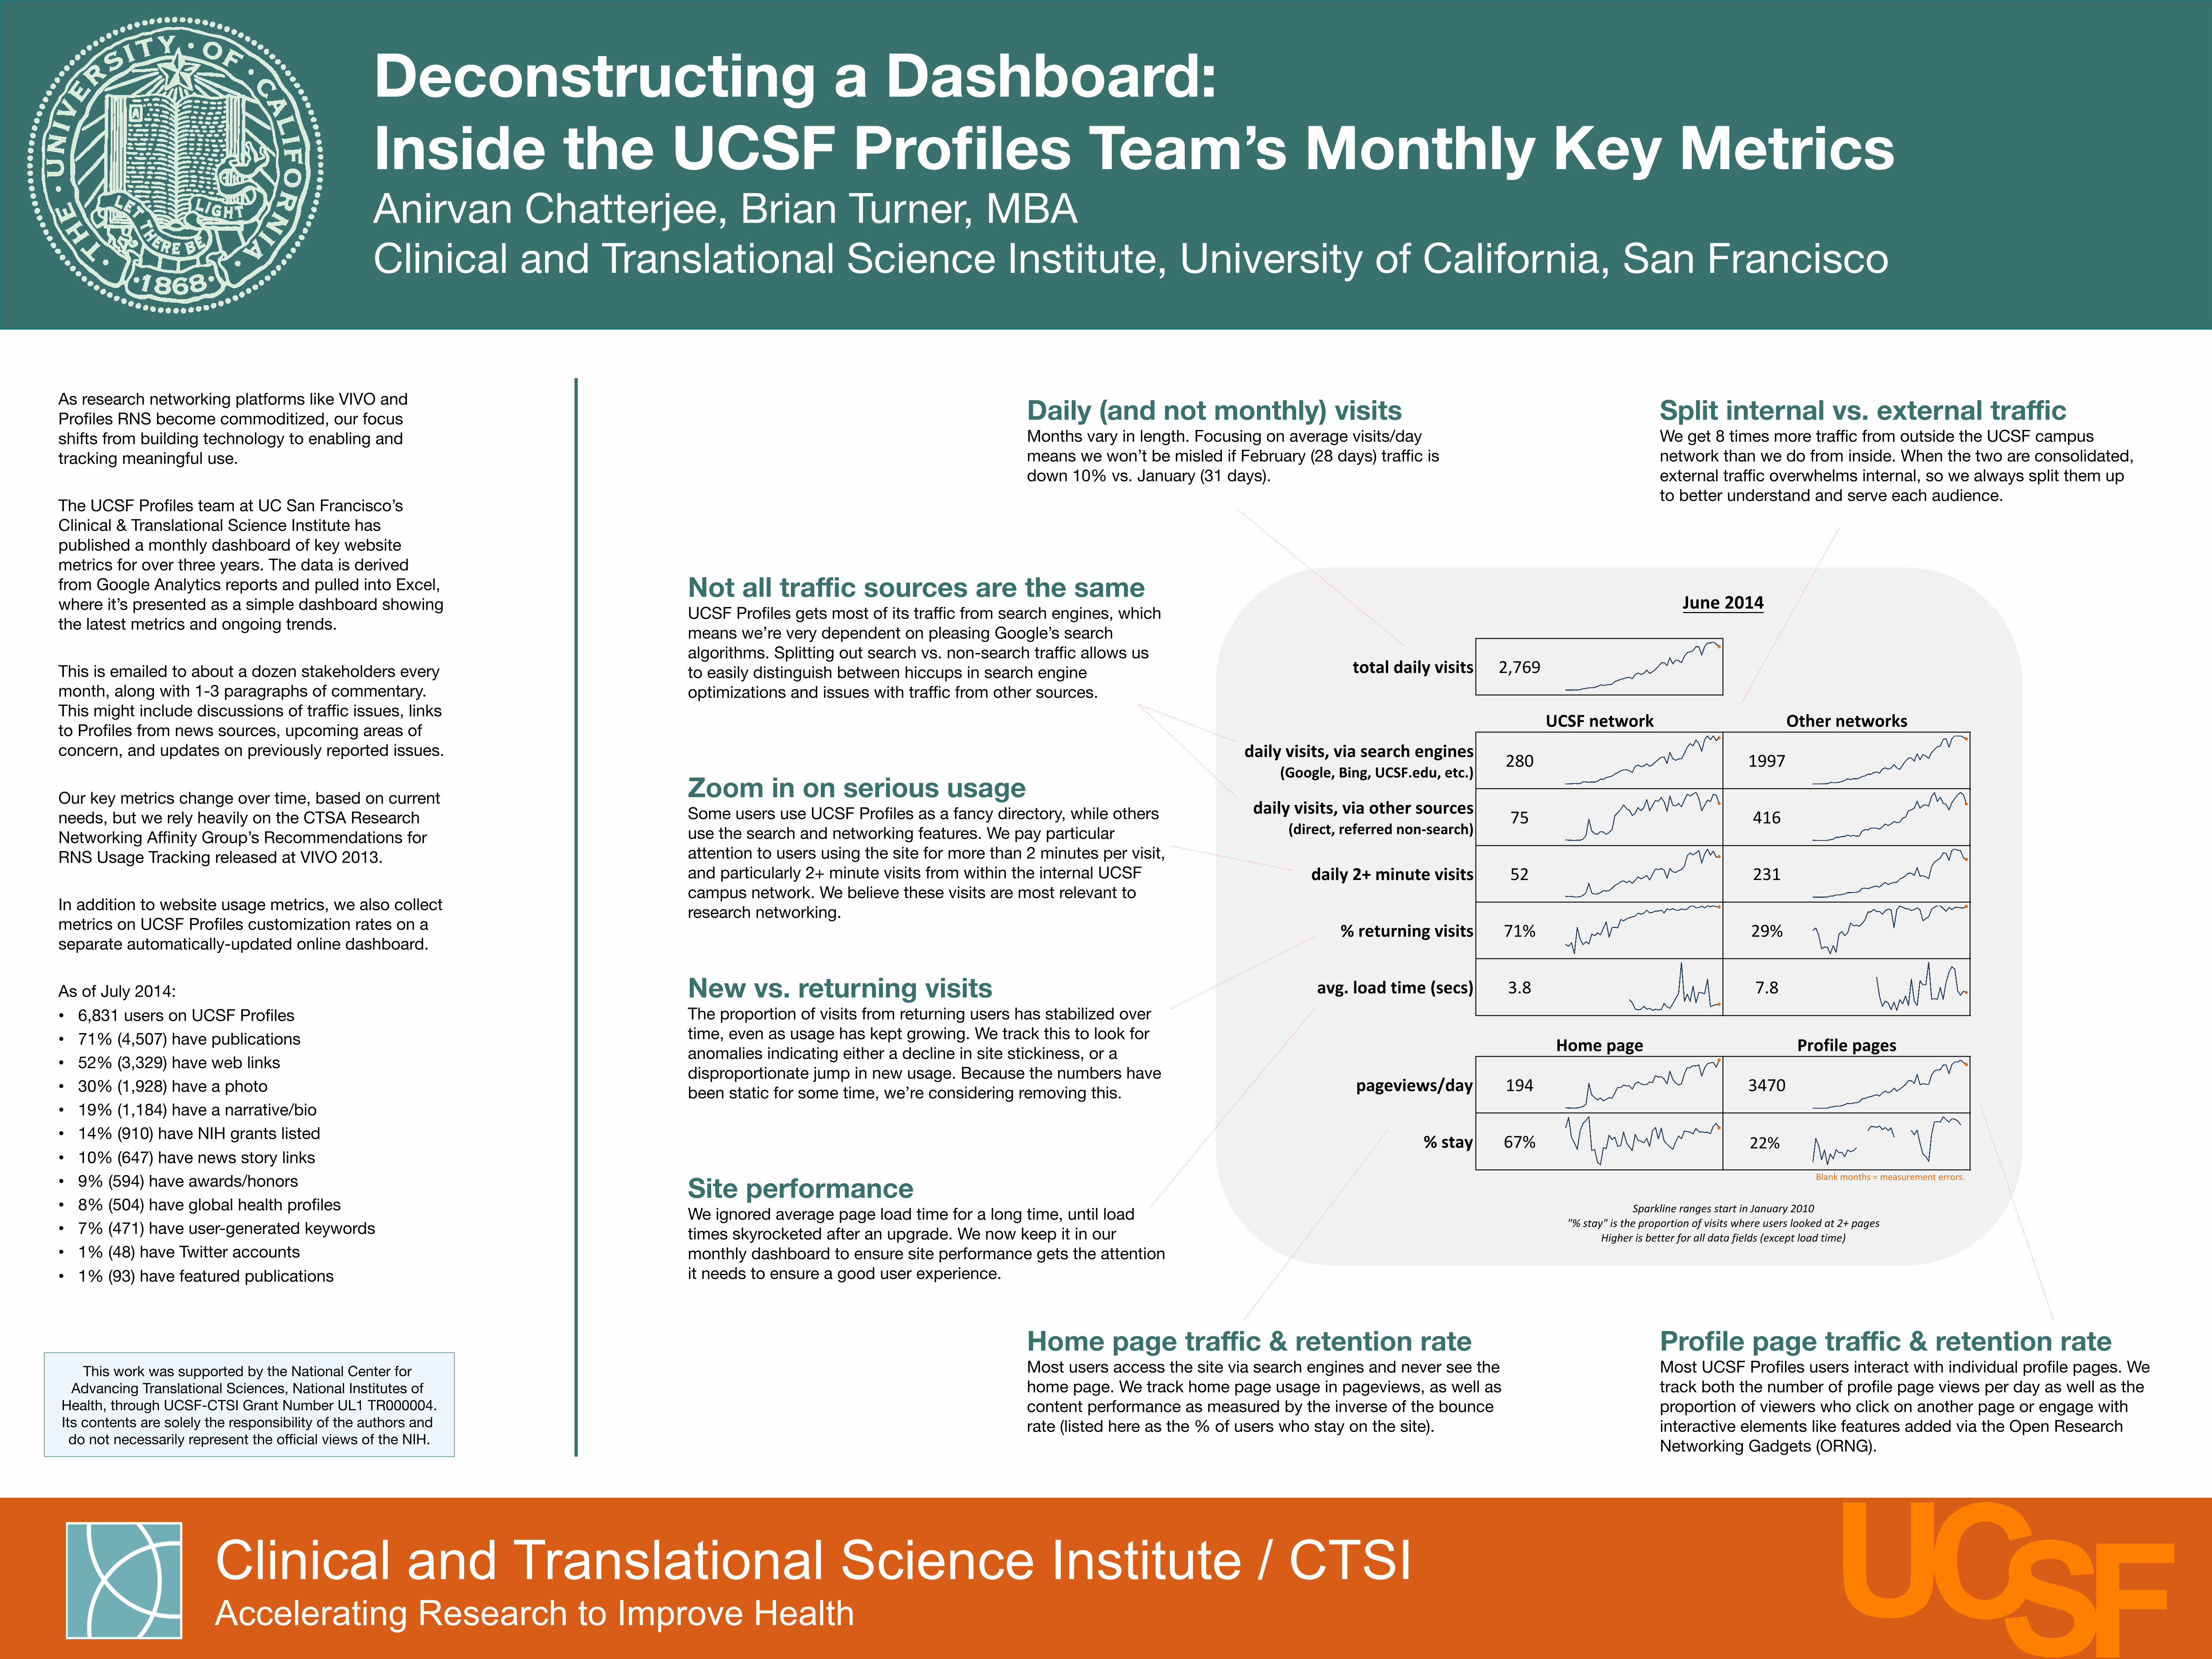
total%daily%visits 2,769
daily%visits,%via%search%engines(Google,%Bing,%UCSF.edu,%etc.)
280 1997
daily%visits,%via%other%sources(direct,%referred%non=search)
75 416
daily%2+%minute%visits 52 231
%%returning%visits 71% 29%
avg.%load%time%(secs) 3.8 7.8
pageviews/day 194 3470
%%stay 67% 0%
Blank3months3=3measurement3errors.
Higher'is'better'for'all'data'fields'(except'load'time)"%'stay"'is'the'proportion'of'visits'where'users'looked'at'2+'pages
Sparkline'ranges'start'in'January'2010
June%2014
UCSF%network Other%networks
Home%page Profile%pages
Daily (and not monthly) visits Months vary in length. Focusing on average visits/day means we won’t be misled if February (28 days) traffic is down 10% vs. January (31 days).
Split internal vs. external traffic We get 8 times more traffic from outside the UCSF campus network than we do from inside. When the two are consolidated, external traffic overwhelms internal, so we always split them up to better understand and serve each audience.
Zoom in on serious usage Some users use UCSF Profiles as a fancy directory, while others use the search and networking features. We pay particular attention to users using the site for more than 2 minutes per visit, and particularly 2+ minute visits from within the internal UCSF campus network. We believe these visits are most relevant to research networking.
New vs. returning visits The proportion of visits from returning users has stabilized over time, even as usage has kept growing. We track this to look for anomalies indicating either a decline in site stickiness, or a disproportionate jump in new usage. Because the numbers have been static for some time, we’re considering removing this.
Home page traffic & retention rate Most users access the site via search engines and never see the home page. We track home page usage in pageviews, as well as content performance as measured by the inverse of the bounce rate (listed here as the % of users who stay on the site).
Profile page traffic & retention rate Most UCSF Profiles users interact with individual profile pages. We track both the number of profile page views per day as well as the proportion of viewers who click on another page or engage with interactive elements like features added via the Open Research Networking Gadgets (ORNG).
Not all traffic sources are the same UCSF Profiles gets most of its traffic from search engines, which means we’re very dependent on pleasing Google’s search algorithms. Splitting out search vs. non-search traffic allows us to easily distinguish between hiccups in search engine optimizations and issues with traffic from other sources.
Site performance We ignored average page load time for a long time, until load times skyrocketed after an upgrade. We now keep it in our monthly dashboard to ensure site performance gets the attention it needs to ensure a good user experience.
22%