Embed Size (px)
Citation preview

Detecting Discontinuitiesin Large-Scale Systems
Haroon MalikSoftware Architecture Group (SWAG)
University of Waterloo, Waterloo, Canada
Ian John DavisSoftware Architecture Group (SWAG)
University of Waterloo, Waterloo, Canada
Michael GodfreySoftware Architecture Group (SWAG)
University of Waterloo, Waterloo, Canada
Douglas Neuse & Serge Mankovskii
Capacity Planning GroupCA Technologies, USA

2Datacenters Require Good Forecasts
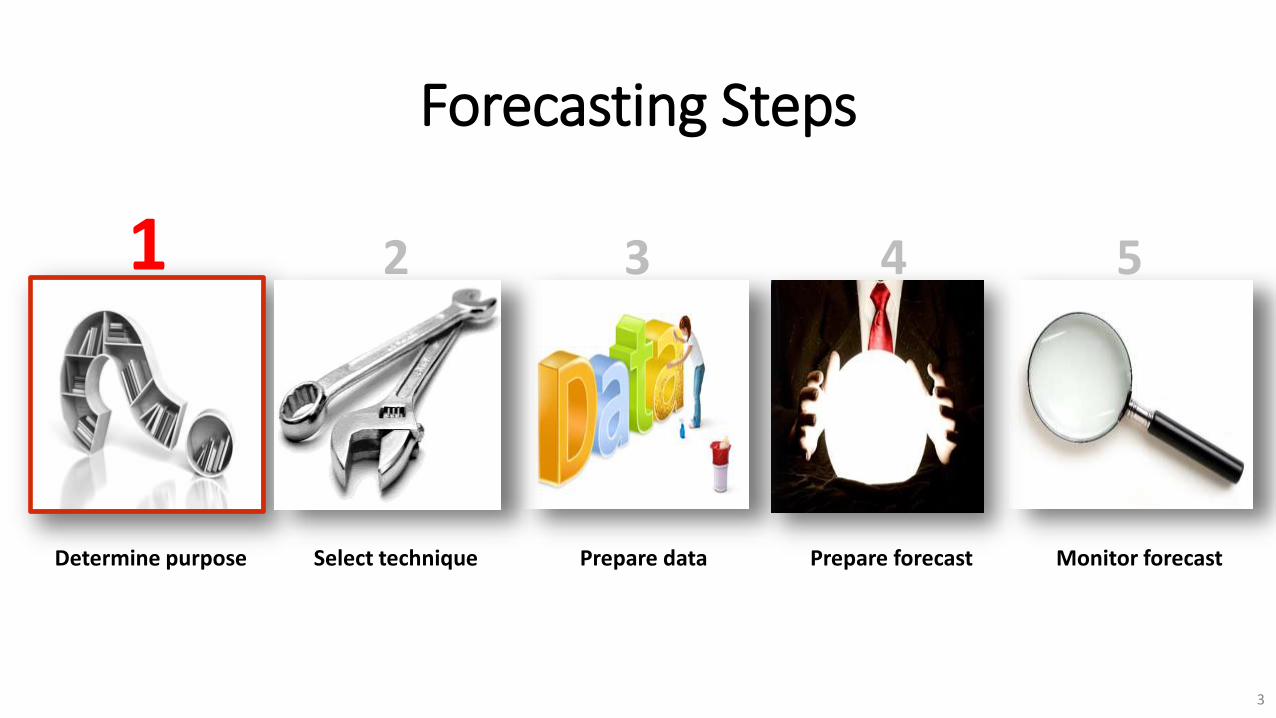
Forecasting Steps
1 2 3 4 5
Determine purpose Select technique Prepare data Prepare forecast Monitor forecast
3

Forecasting Steps
1 2 3 4 5
Determine purpose Select technique Prepare data Prepare forecast Monitor forecast
4

Forecasting Steps
1 2 3 4 5
Determine purpose Select technique Prepare data Prepare forecast Monitor forecast
5

Forecasting Steps
1 2 3 4 5
Determine purpose Select technique Prepare data Prepare forecast Monitor forecast
6

Forecasting Steps
1 2 3 4 5
Determine purpose Select technique Prepare data Prepare forecast Monitor forecast
7

Forecasting Steps
1 2 3 4 5
Determine purpose Select technique Prepare data Prepare forecast Monitor forecast
Challenges (a) Large volumes of performance data, (b) Limited time, (c) Domain knowledge
8

Discontinuities
0
1
2
3
4
5
6
1 4 7
10
13
16
19
22
25
28
31
34
37
40
43
46
49
52
55
58
61
64
67
70
73
76
79
82
85
88
91
94
97
10
0
10
3
10
6
10
9
11
2
11
5
11
8
12
1
12
4
12
7
13
0
13
3
13
6
13
9
14
2
Mag
nit
ud
e
Time (Days)
Discontinuity
Anomalies
9

Discontinuities
Reasons:
1. Company merge
2. Hardware upgrade
3. Software change (new release)
4. Workload change
5. Promotional customers
10
(a)
T1 T2 T3
(b)
Transition Period
(c) (d)
Symptoms:

Why Care About Discontinuities?
• Measurements taken before the discontinuity canskew the forecast.
• Detecting a discontinuity provide analysts with areference point to retrain their forecasting modelsand make necessary adjustments.
We propose an automated approach to help analyst identify discontinuities in
performance data
11

Steps Involved in The Proposed Approach
12
Performance
logs
Report
(discontinuities)Data
preparation
Metric
selection
Anomaly
detection
Discontinuity
identification
1 2 3 4
InputApproach
Output

1. Data PreparationThe performance logs from theproduction have noise:
o Missing counters
o Empty counters
o Different numerical ranges
13
We used statistical techniques to filter noise in the data
Data
preparation
Metric
selectionAnomaly
detection
Discontinuity
identification

2.Metric SelectionProduction logs containthousands of counters that are:
o Highly correlated
o Invariants
o Configuration constants
14
We used Principal-Component-Analysis (PCA) to
select important metrics
Data
preparation
Metric
selectionAnomaly
detection
Discontinuity
identification

3. Anomaly DetectionQuadratic Modelling
o Quadratic Function thatminimize LSE
o A greedy algorithm toreplace performancecounter time series data
o Cost metric to reflectdata fit
15
Largest costs suggest positions intime series value where the mostegregious anomalies anddiscontinuities occur
Data
preparation
Metric
selection
Anomaly
detection
Discontinuity
identification

3. Anomaly Detection (Quadratic Model)
Co
un
ter
Val
ue
16

3. Anomaly Detection (Quadratic Model)
Co
un
ter
Val
ue
17
Co
st

4. Discontinuity Identification
Distribution comparisono Difference of mean between
two population
o Quantify the difference ofmean between two population
18
Data
preparation
Metric
selection
Anomaly
detection
Discontinuity
identification

19
Transition Period Transition Period
Anomaly Anomaly
Discontinuity
% C
PU
Uti
lizat
ion
Difference of Mean Between Two Populations

Difference of Mean Between Two Populations
20
Transition Period Transition Period
Anomaly Anomaly
Discontinuity
% C
PU
Uti
lizat
ion
Co
st

Difference of Mean Between Two Populations
21
Transition Period Transition Period
Anomaly Anomaly
Discontinuity
% C
PU
Uti
lizat
ion
21
Transition Period Transition Period
% C
PU
Uti
lizat
ion
Wilcoxon Rank-Sum Test H0 = The two distributions are same

Difference of Mean Between Two Populations
22
Transition Period Transition Period
Anomaly Anomaly
Discontinuity
% C
PU
Uti
lizat
ion
22
Transition Period Transition Period
% C
PU
Uti
lizat
ion
Wilcoxon Rank-Sum Test H0 = The two distributions are same

Difference of Mean Between Two Populations
23
Transition Period Transition Period
Anomaly Anomaly
Discontinuity
% C
PU
Uti
lizat
ion
23
Transition Period Transition Period
% C
PU
Uti
lizat
ion
Wilcoxon Rank-Sum Test H0 = The two distributions are same

Quantify the Difference of Mean Between Two Populations
COHEN’S-D A tunable threshold
𝒆𝒇𝒇𝒆𝒄𝒕 𝒔𝒊𝒛𝒆 =
𝒕𝒓𝒊𝒗𝒊𝒂𝒍𝒔𝒎𝒂𝒍𝒍
𝒎𝒆𝒅𝒊𝒖𝒎𝒍𝒂𝒓𝒈𝒆
𝒊𝒇 𝑪𝒐𝒉𝒆𝒏′𝒔 𝒅 ≤ 𝟎. 𝟐
𝒊𝒇 𝟎. 𝟐 < 𝑪𝒐𝒉𝒆𝒏′𝒔 𝒅 ≤ 𝟎. 𝟓
𝒊𝒇 𝟎. 𝟓 < 𝑪𝒐𝒉𝒆𝒏′𝒔 𝒅 ≤ 𝟎. 𝟖
𝒊𝒇 𝟎. 𝟖 < 𝑪𝒐𝒉𝒆𝒏′𝒔 𝒅
24
Analysts based on their domain trends and required granularity set the effect size
Acts as a tunable threshold to reduce false positive identification of discontinuity by our
approach
Cohen’s d

Subjects of Study
DVD Store
System: Open SourceDomain: EcommerceType of Data: Performance Tests
System: SimulationDomain: Cloud ComputingType of Data: Synthetic Data
25
System: Industrial SystemDomain: Cloud ComputingType of Data: Production Data

Fault Injection
Category Types of Faults
Anomalies
CPU Stress
Memory Stress
Interfering Workload
Discontinuities
Workload as Multiplicative Factor
Change in Transaction Pattern
Hardware & Software Upgrade
26
We had NO prior knowledge of the underlying fault in the data obtained from the industrial system

Results
0.92
0.72Proposed technique has high accuracy
in detecting discontinuities
Experts verified the results for the industrial system
27
0.83
0
0.1
0.2
0.3
0.4
0.5
0.6
0.7
0.8
0.9
1
Sythetic Dell Dvd Store IndustiralSystem (CA)
F-m
eas
ure

Results
0.92
0.72Proposed technique has high accuracy
in detecting discontinuities
Experts verified the results for the industrial system
28
0.83
0
0.1
0.2
0.3
0.4
0.5
0.6
0.7
0.8
0.9
1
Sythetic Dell Dvd Store IndustiralSystem (CA)
F-m
eas
ure

Results
0.92
0.72Proposed technique has high accuracy
in detecting discontinuities
Experts verified the results for the industrial system
29
0.83
0
0.1
0.2
0.3
0.4
0.5
0.6
0.7
0.8
0.9
1
Sythetic Dell Dvd Store IndustiralSystem (CA)
F-m
eas
ure

Limitations of Our Approach
o We can tune the sensitivity of our approach by adjusting effect size.
oUsing large effect size reduces false alarms, this may result in an analyst overlooking significantdiscontinuities.
oAnalysts have to conduct multiple experiments
30
Sensitivity
Determining a threshold value is a problem Anautomated techniques, generally can not decidewhether identified discontinuity is important or is noise.

Limitations of Our Approach
The approach can not distinguish between o Overlapping discontinuities and
o Different type of discontinuities.
31
Distinguisibility
Analysts have to manually inspect the identified discontinuity and take actions
Distinguishability

32

33
QUESTIONS……