Embed Size (px)
Citation preview

GIS @ DUSPINTRODUCTIONS
WHAT IS GIS?REQUIREMENTS AND TESTOUT
GIS TESTOUT REVIEW
FALL 2015SEPTEMBER 3, 2015
ROOM 4-237 - 3:00-5:00PM

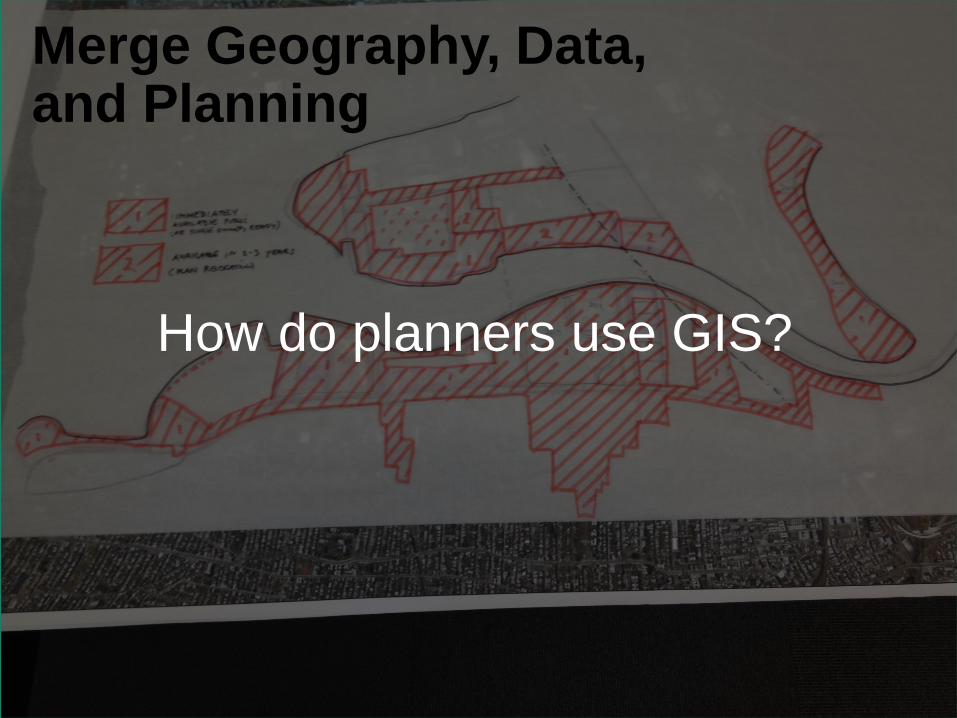
Merge Geography, Data, and Planning

Promote Literacy in Spatial Technology

Research latest mapping technologies

Support Lab Projects and Initiatives

Support Students, Faculty, and Research Staff

Today’s Outline• Introductions• What is GIS?• How is GIS used in Planning?• DUSP GIS Requirements• DUSP GIS Resources• Testout Review
• Making Maps• Relational Databases• Descriptive Stats• Geoprocessing• Data Extraction
• Open Lab Session (Room 9-251)
Merge Geography, Data, and Planning
How do planners use GIS?
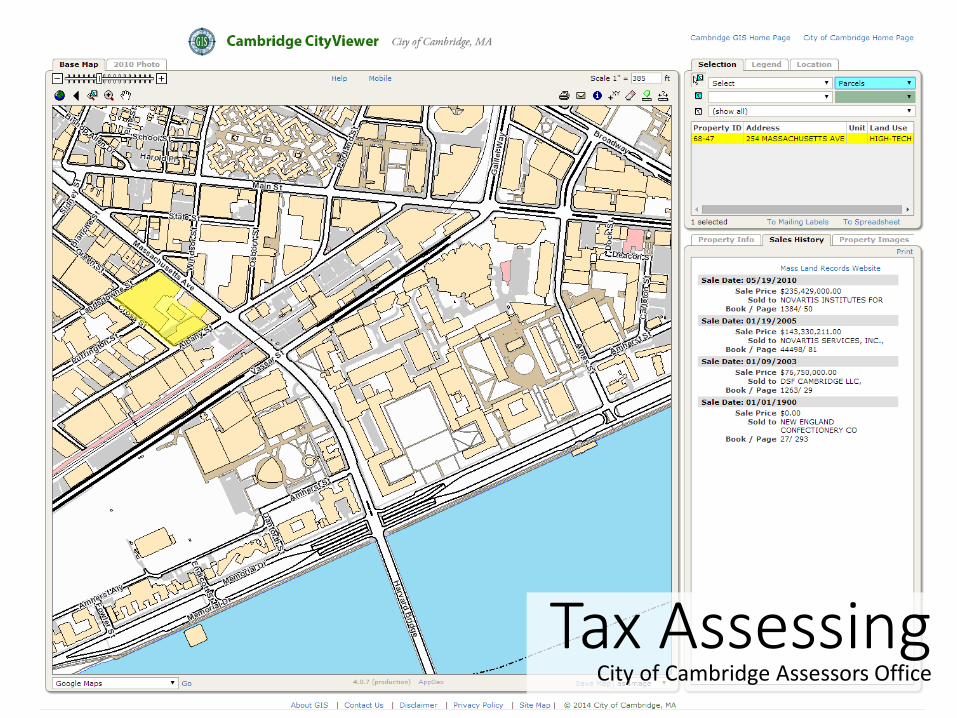
Tax AssessingCity of Cambridge Assessors Office

Master PlansMAPC

Power and EnergyPlatts Oil and Gas Data
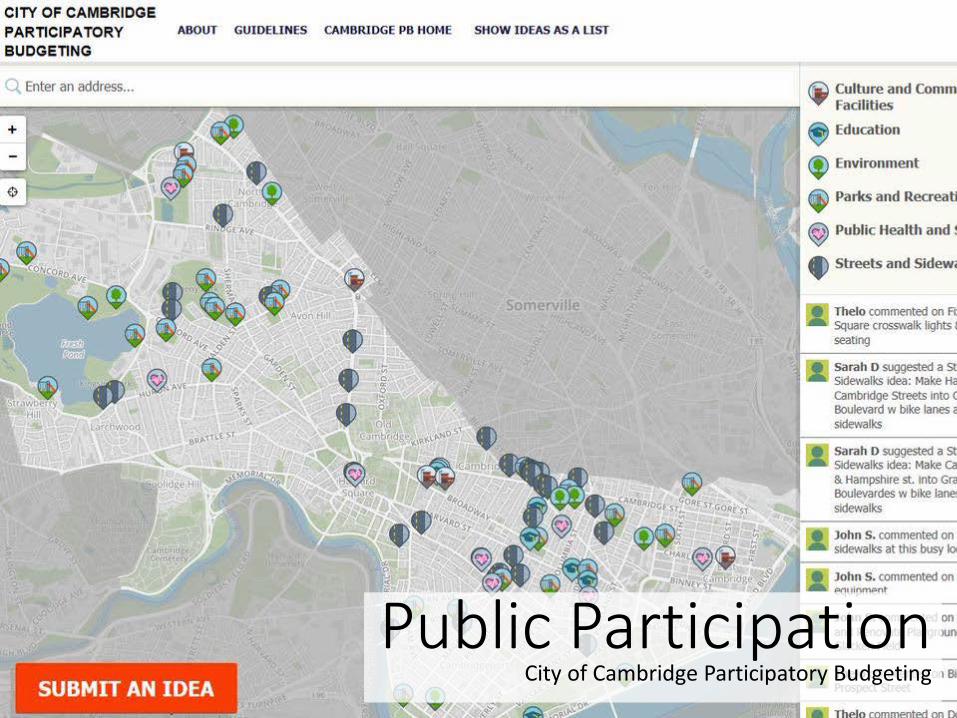
Public ParticipationCity of Cambridge Participatory Budgeting

Crime MappingCity of Cambridge Police Department

Sewer and WaterUniversity of Minnesota Facilities

Environmental ManagementNOAA Sea Level Rise Viewer

ResearchCity Digits – Civic Data Design Lab

GIS@DUSP
Geographic Information Systems (GIS) have become an essential tool for understanding the
urban and built environment.

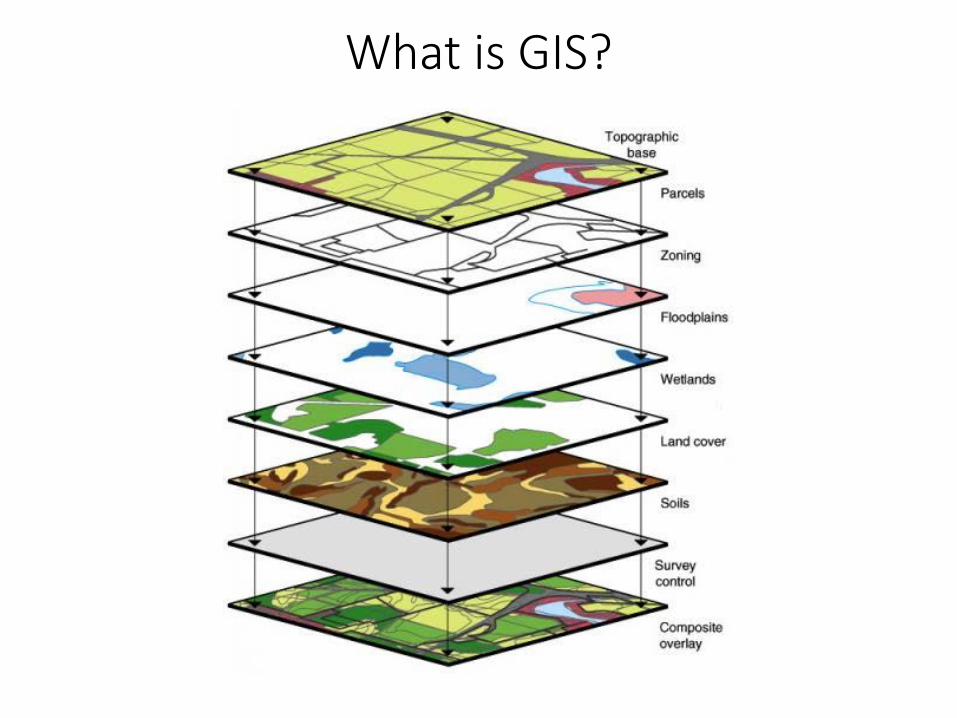
What is GIS?
• Geographic Information System• A system designed to capture, store, manipulate,
analyze, manage, and present all types of spatial data• What is spatial data?
• Any data that sits somewhere in space!• But, it’s not just a system…
… it is also a science.GIS is a discipline consisting of complex analyticalmethods, concepts, and technology that seek to answer spatial questions.
What is GIS?

What is GIS?
• Urban and Regional Planners use GIS all the time!• Planning, specifically planning data, is inherently
spatial• Knowledge of spatial analyis concepts and methods
is fundamental to high-level research and analysis

What is GIS?
Data Sandwich

GIS@DUSP
GIS at DUSP is not just learning software, it is training your mind to utilize spatial problem
solving methods.
“The art and science of asking spatial questions and arriving at solutions to problems using spatial
methods.”

DUSP GIS RequirementsDUSP Intro to GIS series consists of two modular
courses, 11.205 and 11.520.11.205 Intro to GIS (first half) introduces basic spatial
analysis and is required by all MCP students.11.520 GIS Workshop (second half) focuses on developing a GIS research project and further
develops skills.

DUSP GIS Requirements

GIS Test OutIntroduction to Spatial Analysis (11.205) is required
by the MCP Degree. It introduces basic concepts, terminology, and technology of GIS, spatial analysis,
and mapping.
Students who have a previous background in GIS can test-out of this course.
Test Out ExaminationTomorrow, September 4, 2015
2:30-5:00pm, Room 9-251

GIS Test OutWe will cover and review GIS topics the second half
of this session.
Test Out ExaminationTomorrow, September 4, 2015
2:30-5:00pm, Room 9-251

HandoutsCOMPUTING ENVIRONMENTDon’t run over the network!
Set all folders folders and files you are working in to local or USB locations (i.e. external hard drive).
See instructions for that here:
GIS@DUSP Computing Environment

Get an External Hard Drive
You will acquire and use lots of data, and you will move from computer to computer.
We highly recommend acquiring an external hard drive.
1 Terabyte Hard Drives are available on Amazon for approximately $60, which is an amazing amount of
data for a good price!

HandoutsDUSP DATA DRIVE
There are a lot of places to find data. Some datasets exclusive to DUSP can be found on the DUSP GIS
Data Drive.
See instructions for that here:
http://duspviz.mit.edu/data

Installing GIS on your MachineGIS is NOT required on your own machine or laptop.
You can do everything in labs and on CRON workstations.
However…It is recommended if you want to work outside class or from home, CRON site has software with patches.
CRON ArcGIS Install Site:http://cronlasso.mit.edu/cron/p.lasso?t=8:5:5

So I have a Mac…ArcGIS ONLY runs on Windows
To run Windows on a Mac, you have two options:
• Install Bootcamp (dual boot)• Install a Virtual Machine (windows runs in a
“window”)
We recommend for those with sufficient hardware that you run a Virtual Machine.
Message cron for more information or come to the GIS installation sessions for more information.
ARCGIS INSTALLATION SESSIONSLUNCH TIME ARCGIS INSTALLATIONS
12:00-1:00PMMONDAY, SEPT 14 – FRIDAY, SEPT 18
SECOND WEEK OF CLASS
ROOM 9-524 (LAB NEAR CRON)

DESKTOP GIS SOFTWAREEsri ArcGIS
• RECOMMENDED SOFTWARE• Desktop GIS Software developed by Esri• Software suite, many components
• ArcMap – mapping and analysis• ArcCatalog – data cataloging• ArcScene – 3D visualization• etc.
• Many extensions• Network Analyst, 3D Analyst, Spatial Analyst, etc.
• Supports data, analysis, and map production
PRIMARY SOFTWARE IN 11.205,REQUIRES MIT SITE LICENSE

DESKTOP GIS SOFTWARE
QGIS• Free and Open Source Desktop GIS Software
• Built and maintained by large open source community
• Runs on Mac and Windows• Not as robust, well supported, or full featured, but very
capable desktop GIS for data management, spatial analysis, and map creation
• Especially good for data conversion
• Good alternative if ArcGIS is not available• NOT USED IN 11.205 EXERCISES, BUT CONCEPTS THE
SAME

Need help?• DUSP GIS Specialist - Mike Foster
• email – [email protected]• office - Building 9-528 (right near CRON)• Office Hours – Tuesdays, 2:00-4:30pm
• Any of your GIS instructors and TAs!• Office Hours – will be announced next week
• [email protected] (MIT Libraries GIS)• GIS Lab – Mon-Thurs 1-5pm, Fri 2-4pm
• Rotch Library, Building 7 Floor 2
DUSPVIZ
A DUSP initiative to improve departmental capacity in data analysis, visual representation, and
technological communication tools.Workshops and sessions are lead by students, staff,
and faculty.Goal is to share knowledge on GIS, Design, and other
tech specific topics.http://duspviz.mit.edu

DUSPVIZ SESSIONS
Adobe Illustrator, Photoshop, InDesignArcGIS Tools
Design Tools (Rhino, etc.)Web Maps and Websites
Poster DesignQGIS
… and more.

GIS Testout Review
• Making Maps• Relational Databases• Descriptive Statistics
• Geoprocessing• Data Extraction

Part 1 – Making Maps
• GIS is not only making maps, but spatial data is often most easily consumed through a map.
• A good map is a communication piece and tells a story.
• The way you classify, normalize, symbolize, and present your data can completely change your story.

Basic Map Elements
1. Informative Title2. Legend3. Data Source4. Scale Bar5. Date6. North Arrow7. Author
Different Types of Maps• Reference Map
• General Reference• Portray the earth’s surface with as much accuracy as possible.
• Thematic Map• Designed to show a particular theme or communicate a
particular message• Choropleth• Proportional Symbol• Isarithmic or Isopleth (contour)• Dot• Dasymetric
• Know what to use to best show your data!• Each has its positives and negatives

When you map your data…• Remember, your map is a communication tool, it is
your goal to tell a story, as simple as it may sound.• Consider the best methods, and read each and
every map with an intelligent eye.• The way you classify, normalize, and symbolize your
data can completely change your message.• How to Lie with Maps
• Mark Monmonier, 2nd Ed. (1996)
• Maps are powerful tools, treat them as such!

Symbology• The quality of a map’s design affects its readers
ability to extract information and to learn from the map.
• Symbology has been developed to portray the world accurately and effectively convey information to the map reader.
• The symbols should be intuitive, easy-to-understand, and follow standards whenever possible.
• i.e. don’t use a picture of ship to show a train station, and make water blue!

Color on your Maps• Color is important on your maps.• Choose an appropriate scheme based on your data.
Divergent
Sequential
Qualitative/Categorical

Quantile Equal Interval
Natural Breaks Unique
Data Classification

Part 2 - Relational Databases
• A database of multiple tables that can be joined on unique IDs

Consists of a collection of tables. Each table contains a headingdefining the columns, and a body containing the rows of the table. Each row in the table has one or more columns that are unique to that specific row.
These ‘Unique IDs’ exist in multiple tables, matching values represent a relationship between the two tables.
Tables can be combined and joined on these Unique IDs.
Joining tables is fundamental to GIS.
Joining and Relational Databases

Part 3 – Descriptive Statistics
• The first step in any analysis, including spatial analysis, is to look at the distribution of the data.
• Definition: The arrangement of values that one or more variables take in a dataset. Data is ‘binned’
• Describing the distribution:• For interval data, a histogram is a good
way to do this• For ordinal and nominal data,
frequency tables or bar charts are appropriate
• Mean, Median, and Mode• Range and Standard Deviation

Descriptive Statistics…• Using GIS in an Urban Planning
setting, you are going to use descriptive summary stats all the time, and there are important things to remember... data is just a part of the puzzle, focusing on trends and averages, not the individual.
• Ecological Fallacy• While working with spatial data,
remember to be careful to not simply ascribe an attribute of the group to the individual
• You will get plenty more of this in your courses…

Export to Excel• Exporting attribute tables to Excel is one way to
access, summarize, and manipulate datasets.• Do this from
Table Options -> Export

Part 4 – Geoprocessing• Geoprocessing is a general term given to a variety
of operations on spatial data in which data layers are combined or transformed in different ways to yield new geometric or attribute information.
• Typical geoprocessing tasks produce new datasets based on set criteria.

Geoprocessing• So, this begs the question, what is a “GIS Operation”?• GIS Operations are closely related to the database
operations we discussed earlier in this lecture.• Common Geoprocessing Operations
• Buffer• Clip• Intersect• Spatial Join• Union• Merge• Calculate Geometry• Field Calculator• Table Join

Buffer• Used for proximity analysis. • Creates polygon covering area within a specific distance of a
feature.• Example case use –
• Locating all features near or within a certain distance of a feature.

Clip• Clips features from one dataset to the extent of another
dataset.• Example case use –
• Trimming a road dataset down to contain only the roads within a certain city.
• Clip does not change underlying data. You will need to double check and likely recalculate areas and other attributes after clipping.

Intersect• Finds common areas between two datasets.• Example case use –
• You have a dataset showing income and a dataset showing land uses. You want to find all areas where the two datasets cover the same geographical area.
• Intersect does not change underlying data but does apply attributes from the intersecting dataset to the input dataset.

Dissolve• Creates new dataset with new polygons based on common
attributes in original dataset.• Example case use –
• You have a parcel dataset, you want to create a new dataset of land use based on an attribute associated with the parcels. You run dissolve and get new polygons based on the parcels.
• IMPORTANT – Dissolve runs to the least common denominator, and gets rid of all attributes not common to original polygons.

Union• Uses to create a union of two datasets.• Example case use –
• You have a data showing landcover types from two sources, you want the two datasets in one all encompassing dataset.

Spatial Join

MergeUsed to merge two adjacent datasets into one.
Example case use –◦ You have two area datasets, adjacent to one another, you
want to create a completely new dataset with both of them.
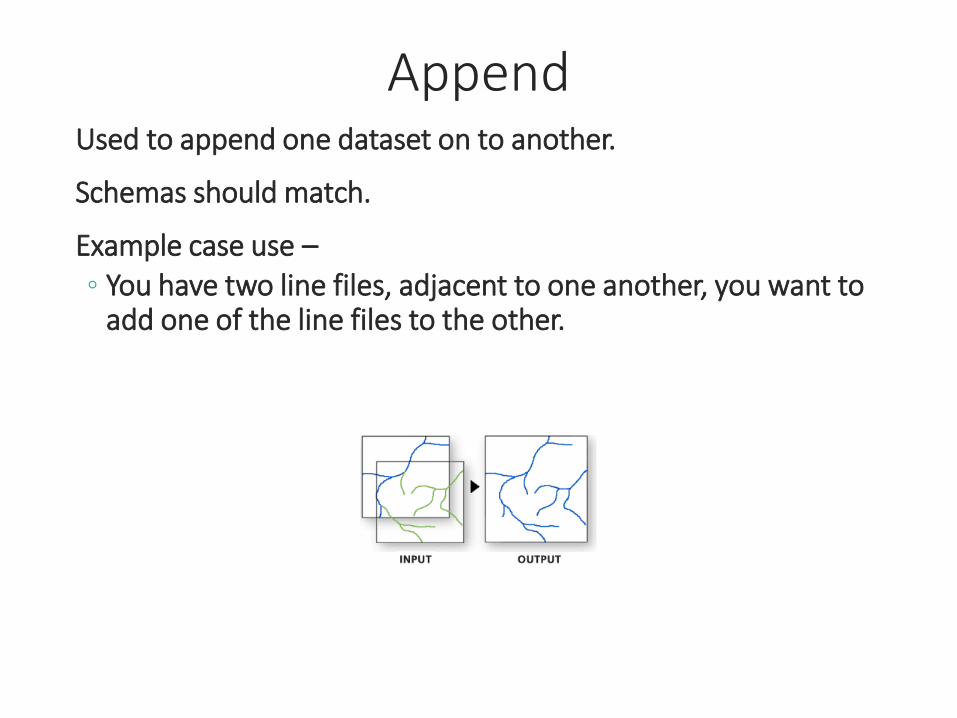
AppendUsed to append one dataset on to another.
Schemas should match.
Example case use –◦ You have two line files, adjacent to one another, you want to
add one of the line files to the other.

Part 5 – Data Extraction MethodsData extraction, or spatial extraction, makes it possible to look at rich disaggregated datasets, such as census data, and extract data and information.
Methods of extraction, for example, involve taking census unit level data, which has been aggregated by tract, block, or other, and combining it or modifying it systematically to derive new information and data.
(Schlossberg, 2003)

Extraction MethodsMethods used to extract data when you have multiple varying sources and geographies
• These are the most common, many exist…
Intersecting Completely Within Centroids Within Proportional Split

Proportional SplitSplits polygons to fit shapes or within buffers.
• Example: Study area splits census block groups, but you still need estimated numbers.

• Intersecting• Pro – Exhaustive / Con – Too inclusive
• Completely within• Pro – Good targeting / Con – Too exclusive
• Centroids within• Pro – Good compromise / Con – imprecise, adds error
• Proportional Split• Pro – forces polygons to mirror study area / Con –
assumes uniform distribution
Data Extraction MethodsPros and Cons

GIS Open Lab
Immediately following this session in Room 9-251 until 7pm.
Set up your environment, test your skills, play with data.