Embed Size (px)
Citation preview

Global Border and Maritime Security Market Assessment Human-Intensive Security on the Border and Maritime Domain Will
Increase the Demand for New Technology
M965-16
February 2014

2 M965-16
Research Team
Krzysztof Rutkowski
Research Analyst
Aerospace, Defence, and Security
(+48) 22 481 62 12
Lead Analyst
Research Director
Anthony Leather
Research Analyst
Aerospace, Defence, and Security
(+44) 207 343 8334
Strategic Review Committee Leader
Steven Webb
Vice President
Aerospace, Defence, and Security
(+44) 207 915 7842

3 M965-16
Contents
Section Slide Numbers
Executive Summary 6
Market Overview 11
Total Border and Maritime Security Market -
• External Challenges: Drivers and Restraints 17
• Forecast and Trends 26
• Market Share and Competitive Analysis 37
Segment Breakdown -
• Border Security Segment 50
• Maritime Security Segment 57
Regional Breakdown -
• Africa 64
• Asia-Pacific 72
• Europe 80
• Latin America 88
• Middle East 96

4 M965-16
Contents
Section Slide Numbers
• North America 104
Country Breakdown -
• Algeria 112
• Australia 116
• Brazil 120
• China 125
• Egypt 129
• India 133
• Israel 137
• Jordan 141
• Malaysia 145
• Nigeria 149
• Oman 153
• Russia 157

5 M965-16
Contents
Section Slide Numbers
• Saudi Arabia 161
• Spain 165
• Turkey 169
• The United Arab Emirates 173
• The United States of America 177
The Last Word 183
Appendix 186

6 M965-16
Executive Summary

7 M965-16
Executive Summary
• Market expenditure has reached $29.33 billion in 2012. Frost & Sullivan anticipates that
this market will grow at a CAGR of 6.8% reaching $56.52 billion in 2022.
• Border security is the larger domain in the border and maritime security market
generating 55.5% of the expenditure while maritime security generates 44.5%.
• North America has possessed the highest expenditure in 2012 (38.9% of the entire
market) and will continue to be the highest by 2022 (30.0%).
• Asia-Pacific will continue to overtake North America’s market share and will increase its
share from 23.1% (2012) to 27.4% (2022).
• The highest CAGR from 2012 to 2022 will be held by the Middle East (10.5%), followed
by APAC (8.7%). Africa will follow with a CAGR of 8.4%.
• Technology revenue is expected to generate $4,165.0 million in 2012. We expect this
revenue to grow at a CAGR of 6.7% reaching $7,951.3 million by 2022.
Source: Frost & Sullivan

8 M965-16
Executive Summary (continued)
• Terrorism, piracy, more advanced technologies, inter-agency collaboration, and nations’
prioritising border security are driving the market.
• Difficulty in connecting border security incidents with domestic threats, budget cuts, and
many stakeholders in the border and maritime domain restrain exponential growth in this
sector.
Source: Frost & Sullivan
9 M965-16
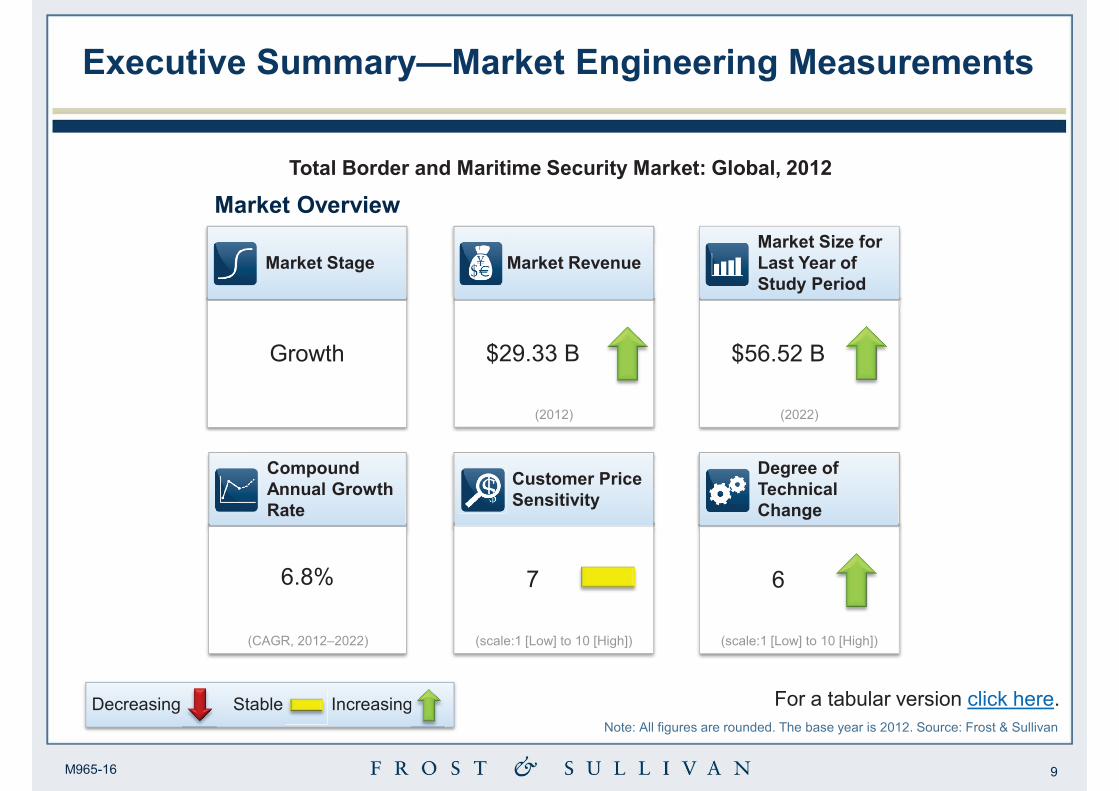
Compound
Annual Growth
Rate
6.8%
(CAGR, 2012–2022)
Executive Summary—Market Engineering Measurements
Market Stage
Growth
Market Revenue
$29.33 B
(2012)
Market Size for
Last Year of
Study Period
$56.52 B
(2022)
Total Border and Maritime Security Market: Global, 2012
For a tabular version click here.
Degree of
Technical
Change
6
(scale:1 [Low] to 10 [High])
Stable Increasing Decreasing g
Customer Price
Sensitivity
7
(scale:1 [Low] to 10 [High])
Market Overview
Note: All figures are rounded. The base year is 2012. Source: Frost & Sullivan

10 M965-16
Executive Summary—CEO’s Perspective
2 Inter-agency participation is happening, but
we do not see any spending from private
companies to increase border security.
3 Expensive border security operations, which
are labour intensive, will be partially
substituted by technology.
4
Majority of goods transported around the
world uses waterways. This occurrence
makes it essential to deploy advanced state-
of-the-art technology to secure transport.
5
There is a chance for public–private
partnerships but only in coast guard and
harbour security. Most harbours are privately
owned.
1 Each nation needs a unique solution since its
issues and geographies cannot be replicated.
Source: Frost & Sullivan