Embed Size (px)
Citation preview

INFORMATION MANAGEMENT IN BIOPHARMA INDUSTRIES CHALLENGES AND OPPORTUNITIES
Frank Wang [email protected], www.linkedin.com/in/frankfangwang

• Challenges of Pharmaceutical R&D and Clinical, Sales and Marketing Productivity
• Evolving Biopharma Value Chain
• Information Management in Pharmaceutical R&D and Clinical Value Chain
• Information Management in Pharmaceutical S&M and Managed Care
• Information Management in Manufacturing and Distribution (Supply Chain Optimization)
• Information Management to help IT Organization to run like a Business
TOPICS

PHARMACEUTICAL INDUSTRY IS AT A CROSS-ROAD. WHILE R&D PRODUCTIVITY SAGS, EMERGING MARKETS, RECESSIONS, HEALTHCARE REFORMS AND DEMOGRAPHICS ARE FUNDAMENTALLY CHANGING THE LANDSCAPE.
• Rising demographic pressures as populations age. Mature countries large impact in 3-5 years, BRIC countries in 15-25 years.
• Large scale entry of developing nations with adequate infrastructure leading to new market share opportunities (>50% of growth from emerging markets).
• Research productivity dropped significantly while R&D expenses dramatically increased. Fewer blockbusters, more extensions; patent cliffs with generics; precision medicine.
• The rise of biologics and genome-based therapies seen as new source of innovation but genome based research has not yet fulfilled its promise.
• Conflict of interest and fear of corporate influence driving new regulations affecting corporate-physician relationships.
• Recession and Healthcare Reform mandate require clear value prepositions of new molecular entities, new commercial business models and increased supply chain agility.
• R&D
― Focus on precision medicine to find segmented populations for line extensions, off-label and new specialty drug uses; the rise of disease management programs
― Large scale pipeline renewal (process, organization, technology and therapeutic area focus) through R&D reorgs and M&A to refresh future funding sources. Shift R&D to developing nations and outsource to reduce costs and efficiencies
•Manufacturing and Supply Chain
― Reduce manufacturing footprint; outsource more manufacturing
― Revitalize supply chain by adopting best of the breed manufacturing supply chain excellence such as lean manufacturing, demand forecasting and inventory optimization
• Sales and Marketing
― Differentiated sales and marketing strategies (segmentation) required to reach emerging markets, mature vs. novel products and therapeutic-specific patients; tailored communications by segment by channel
― Socialized medicine cost pressures increase regulation in EMEA and developed countries; price controls drives unified approach to legal/safety, R&D and S&M
― Reduced access to Primary care as well as Specialty Physicians and Managed care in US markets requires new S&M approaches
Market and Industry Forces Impact
1
3
5 6
4
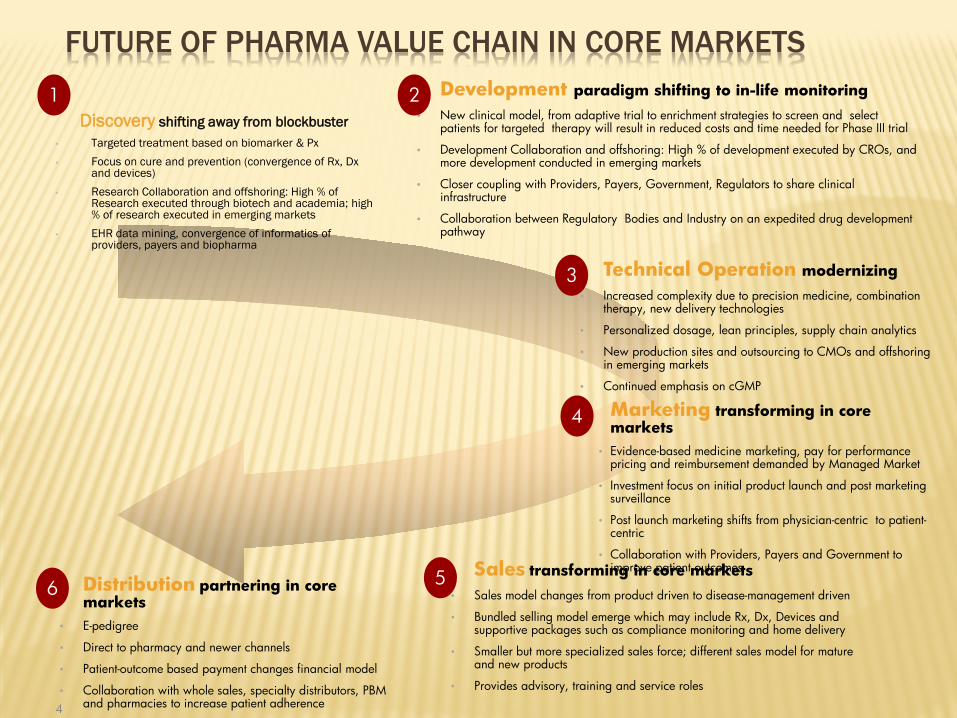
FUTURE OF PHARMA VALUE CHAIN IN CORE MARKETS
Discovery shifting away from blockbuster • Targeted treatment based on biomarker & Px • Focus on cure and prevention (convergence of Rx, Dx
and devices) • Research Collaboration and offshoring: High % of
Research executed through biotech and academia; high % of research executed in emerging markets
• EHR data mining, convergence of informatics of providers, payers and biopharma
Development paradigm shifting to in-life monitoring • New clinical model, from adaptive trial to enrichment strategies to screen and select
patients for targeted therapy will result in reduced costs and time needed for Phase III trial
• Development Collaboration and offshoring: High % of development executed by CROs, and more development conducted in emerging markets
• Closer coupling with Providers, Payers, Government, Regulators to share clinical infrastructure
• Collaboration between Regulatory Bodies and Industry on an expedited drug development pathway
4
2
Technical Operation modernizing • Increased complexity due to precision medicine, combination
therapy, new delivery technologies
• Personalized dosage, lean principles, supply chain analytics
• New production sites and outsourcing to CMOs and offshoring in emerging markets
• Continued emphasis on cGMP
Sales transforming in core markets • Sales model changes from product driven to disease-management driven
• Bundled selling model emerge which may include Rx, Dx, Devices and supportive packages such as compliance monitoring and home delivery
• Smaller but more specialized sales force; different sales model for mature and new products
• Provides advisory, training and service roles
Marketing transforming in core markets
• Evidence-based medicine marketing, pay for performance pricing and reimbursement demanded by Managed Market
• Investment focus on initial product launch and post marketing surveillance
• Post launch marketing shifts from physician-centric to patient-centric
• Collaboration with Providers, Payers and Government to improve patient outcomes
Distribution partnering in core markets
• E-pedigree
• Direct to pharmacy and newer channels
• Patient-outcome based payment changes financial model
• Collaboration with whole sales, specialty distributors, PBM and pharmacies to increase patient adherence

PHARMA R&D AND CLINICAL
• Business Processes
• Paradigm Shift
• Information Management Challenges and Maturity Model
• Information Management Opportunities

Target ID Validation
Lead Identification (Assay Dev/Screening)
Lead Optimization
Preclinical Animal Testing
Clinical Support
Information Management and Knowledge Sharing along the Pharmaceutical R&D Value Chain
Genomics
Proteomics
Bioinformatics
Images
Pathways
Systems Biology
Compound Registration
Compound Inventory
Screening Databases
Project Mart
Computational Chemistry
Cheminformaitcs (e-ADME)
Rational Drug Design
Biology Therapeutic Centric DW
Corp R&D Knowledge Managment
Corp Compound Management
IND Submission
GLP/GMP
Validation
Part 11 CRF 21
Content Management Documentum
Stability
Scale-up
TotalChrom
LIMS
Process Control
CMC Strategies
Project Portfolio Managment
Collaboration, Portal, IP Management, CTI
Data Governance, Data Integration, Information Management and Knowledge Sharing
Tox LIMS
Bioanalytics LIMS
Animal Pharmacology
PK/PD
Toxicogenomics
Metabonomics
Non Clinical Development
Clinical Trial Supply
Clinical PK
Manufacturing R&D

Phase I Phase II Phase III Regulatory NDA Submission Phase IV
Information Management Along the Pharmaceutical Clinical Operation, Regulatory Affairs and Post-marketing Surveillance
Web-based EDC in traditional phases and adaptive trials
Design and Plan
Start-up (Distribute Drug info, Site Selection)
Recruiting Patients/Investigators
Trial Management and Monitoring
Conduct, Reports and Closeout
CTDM CTMS Clinical Data Repository (SCE, eCDM) Clinical Data Warehouse Adverse Event Reporting System
Documentum
EDM
Document Life Cycle
Management
eCTD
E Submission
Sharepoint
Document Management, eCTD for IND/NDA
GCP/CFR 21 Part 11 Validation Data Standards (HL7/CDISC/SPL/ICSR/RPS
eClinical (trial data management, trial supplier managemnet, statistics ePRO, Clinical Trial Registry and Results Database
Effectiveness of Medicine
Long-term Safety
Life Cycle Management
Patient Registry
Observational
Outcome Research
Pharmacoeconomics
Global Registery
Data Governance, Data Integration, Information Management and Knowledge Sharing

8
PHARMA R&D BUSINESS PROCESS: TWO TYPES OF R&D. TRANSLATIONAL IS THE INDUSTRY DIRECTION BUT PRESENTS THE GREATEST SET OF CHALLENGES.
• Silos between disciplines and within and between institutions
• A number of different disciplines: Chemical, Biological, Clinical etc.
• In many ways has hit a wall in terms of efficiency and capacity for innovation
• Rich history of many applications and data-providers
• Integrates traditional discovery processes with clinical practices
• Breaks down boundaries between silos and organizations
• Closes the cycle between research and the clinic, and between different research disciplines
• Requires collaborative infrastructures and data access
• Process is circular (closed loop)
Basic Research
Discovery and Development
Clinical Trials
Manufacture and Distribute Primary
Care
Extended Acute
Health Management
Payment
Translational R&D Traditional R&D

9
VIRTUAL R&D, COLLABORATION AMONG ACADEMIC MEDICINE, PHARMACEUTICAL COMPANIES AND REGULATORY BODIES MANDATE EFFECTIVE INFORMATION MANAGEMENT AND KNOWLEDGE MANAGEMENT
Basic Science
Statistics Informatician
Clinical Care & Research
Patient recruitment • Receive current standard therapy • On clinical trial of new therapy
Prospective biomarker screening in new patients
Statisticians develop tools to analyze and validate biomarkers
In vivo and in silico prospective and retrospective biomarker use in discovery
Hypothesis generation
Biopharma Companies conduct and develop putative new treatment
Bio specimen collection, clinical diagnosis and treatment to assess biological activity and hypothesis
Clinical Care
Basic Science
Informatics
Drug Discovery
Development
Disease Management
Payment Clinical
Research

THE NEED FOR DEVELOPING A 360 VIEW OF BIOPHARMA PRECLINICAL AND CLINICAL DEVELOPMENT ACTIVITIES – INFORMATION MANAGEMENT HUB AND PHARMA R&D INTELLIGENCE SYSTEM
•Animal Tox Studies •Data to support phase 1 trials •Dosing stability studies •Tox analytical method development and validation •INC support
•Patient recruitment •Site selection and monitoring •Investigator relationship management •Test sample logistics •EDC
•Phase I safety study •POC Study •Clinical data reduction •DRA
•IND Review
•Biomarker ID & Validation •Clinical Compendium Dx kits development •Phase I simulation, modelling and virtual patients •Clinical protocol development
•Analytical development •Pilot Manufacturing •Technology Transfer
•Clinical Supplies Manufacturing,QA/QC •CMC section of NDA •Dosage form Stability
Clinical PK/PD
•Phase I trial review
Design &
Planning
Start-up Recruiting patients and Investigators,
managing trial
Closeout & Report
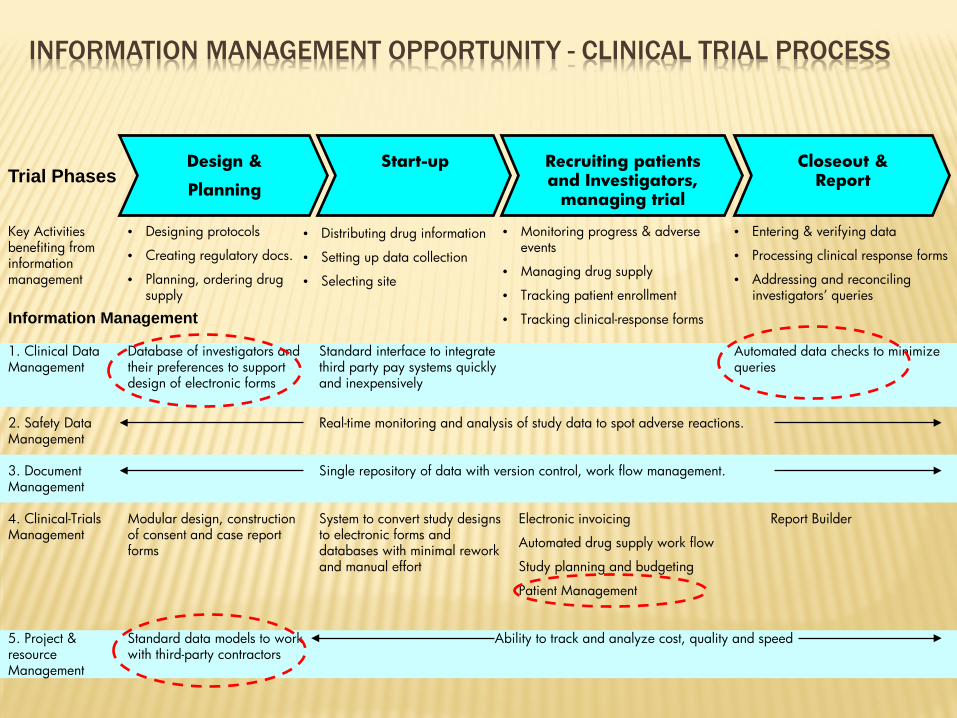
Key Activities benefiting from information management
• Designing protocols
• Creating regulatory docs.
• Planning, ordering drug supply
• Distributing drug information
• Setting up data collection
• Selecting site
• Monitoring progress & adverse events
• Managing drug supply
• Tracking patient enrollment
• Tracking clinical-response forms
• Entering & verifying data
• Processing clinical response forms
• Addressing and reconciling investigators’ queries
Trial Phases
1. Clinical Data Management
Database of investigators and their preferences to support design of electronic forms
Standard interface to integrate third party pay systems quickly and inexpensively
Automated data checks to minimize queries
Information Management
4. Clinical-Trials Management
Modular design, construction of consent and case report forms
System to convert study designs to electronic forms and databases with minimal rework and manual effort
Electronic invoicing
Automated drug supply work flow
Study planning and budgeting
Patient Management
Report Builder
3. Document Management
Single repository of data with version control, work flow management.
2. Safety Data Management
Real-time monitoring and analysis of study data to spot adverse reactions.
5. Project & resource Management
Ability to track and analyze cost, quality and speed Standard data models to work with third-party contractors
INFORMATION MANAGEMENT OPPORTUNITY - CLINICAL TRIAL PROCESS

INFORMATION MANAGEMENT OPPORTUNITY - CLINICAL DATA REPOSITORY (CDR) BUSINESS CASES
• New R&D model requires extracting and use data and metadata from all the transactional systems and aggregate them into a comprehensive clinical trial management environment.
• Definition of a Clinical Data Repository: a centralized metadata repository fed by all the key systems (EDC, CTMS, IVRS, CDMS, Labs, Genomics, Resource and Planning) to allow for retrieving, combining, analyzing and reporting on operational data for multiple purposes.
INFORMATION MANAGEMENT OPPORTUNITY – COMPREHENSIVE PHARMACOVIGILANCE SYSTEM BUSINESS CASES FOR DRUG SAFETY AND POST MARKET SURVEILLANCE SYSTEM
• Traditionally, Pharmacovigilance seen as drug adverse-event case processing, relatedness assessment and regulatory compliance reporting.
• Public safety concern and new R&D and commercial models require a comprehensive benefit-risk analysis on drug development and drug life cycle management.
• New bars on drug safety and post market surveillance require a comprehensive pharmacovigilance system
• Definition of a comprehensive pharmacovigilance system: possess ability to process safety data, to detect safety signals, to assess preclinical and clinical potential safety concerns/risks. The goal of the system is to enhance safety monitoring, to communicate identified safety risks, to provide strategies for implementing risk minimization

BUSINESS INTELLIGENCE: TRADITIONAL CORPORATE BI VS. PHARMA R&D BI
R&D BI Traditional Corporate BI
Corp DW
• Structured texts • Clear business rules • Data residing in various dbs
ERP
CRM
MRP
SFA
R&D DW
Number
Text
Images
Gene
Compound Structure
Structured DB
Predictive Models
• Heterogeneous data • Out-of-dated data • Unstructured and structured • Data resides internally and externally
Reports
Visualization
Interactive Reports
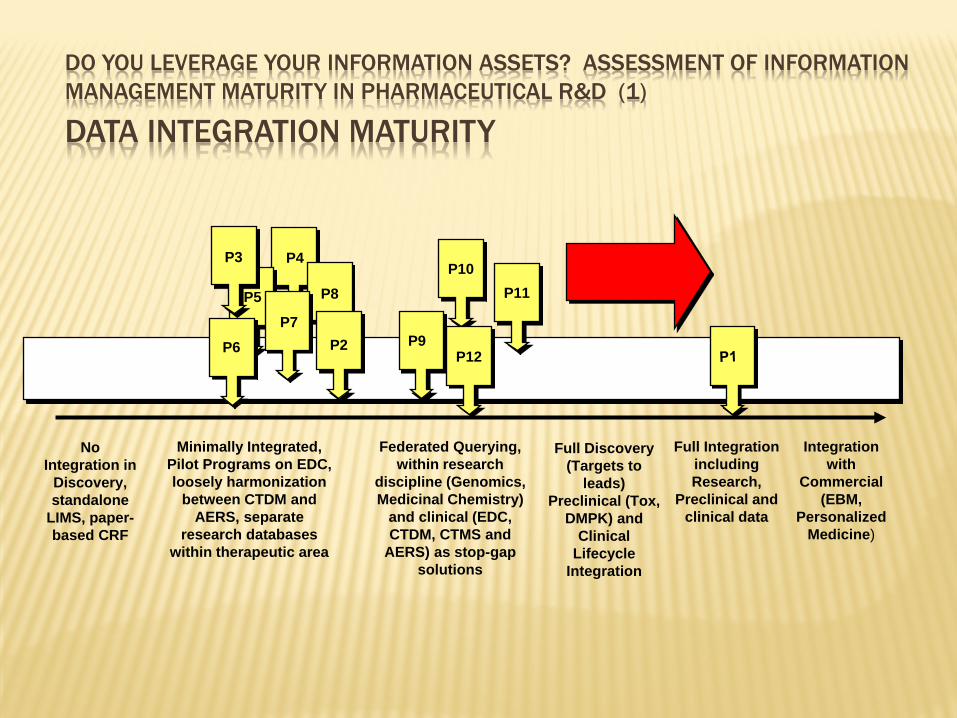
DO YOU LEVERAGE YOUR INFORMATION ASSETS? ASSESSMENT OF INFORMATION MANAGEMENT MATURITY IN PHARMACEUTICAL R&D (1)
DATA INTEGRATION MATURITY
No Integration in
Discovery, standalone
LIMS, paper-based CRF
Minimally Integrated, Pilot Programs on EDC, loosely harmonization
between CTDM and AERS, separate
research databases within therapeutic area
Federated Querying, within research
discipline (Genomics, Medicinal Chemistry)
and clinical (EDC, CTDM, CTMS and
AERS) as stop-gap solutions
Full Discovery (Targets to
leads) Preclinical (Tox,
DMPK) and Clinical
Lifecycle Integration
Full Integration including Research,
Preclinical and clinical data
Integration with
Commercial (EBM,
Personalized Medicine)
P2 P6
P5
P4 P3
P8
P7 P9
P10
P12
P11

DO YOU LEVERAGE YOUR INFORMATION ASSETS? ASSESSMENT OF INFORMATION MANAGEMENT MATURITY IN PHARMACEUTICAL R&D (2)
DATA MINING AND ANALYTICS MATURITY
No data mining and analytics
capabilities. Heavy use of
Excel spreadsheets
Some data mining and analytics capabilities, SAS in biostatistics,
various loosely-coupled informatics tools implemented in discovery, preclinical
mostly associated siloed applications
and some signal detection in safety
Data repository environment for informatics and
analytics developed in discovery,
preclinical and clinical. Analytic
results still application and
database specific. Siebel analytics
reports CRM reach of frequency but not
marketing analytics
Information Analytics
environment no longer specific to
single application
and databases. Some
dashboards capabilities
Enterprise Data Analytics
and Information Workbench
with customized dashboards
P2 P6
P5
P4 P3
P8
P7 P9
P10
P12
P11

DO YOU LEVERAGE YOUR INFORMATION ASSETS? ASSESSMENT OF
INFORMATION MANAGEMENT MATURITY IN PHARMACEUTICAL R&D (3)
INFORMATION ARCHITECTURE AND DELIVERY CAPABILITIES
No information architecture
consideration. Ad-hoc queries as needed for
single application.
Manual review of multiple queries to
answer a single question
Information architecture built mostly based on vendor supplied
standards. Siloed IT groups develop
SQL/database queries strategies based on employee skillsets. Information delivery via window/Mac/web interfaces as needed
Siloed IT initiated integration based on
SOA and portal. Example: Discovery
gene/compound databases integrated
with project portfolios. Clinical data warehouses
being built to integrate EDC, CDMS
based on industry standards
Enterprise MDM initiatives about
targets, compounds,
products, customers,
suppliers and patients along
the R&D+M value chains. SOA and web
services adopted
Enterprise MDM delivered
on-demand. Well thought-
out SOA in place and
enterprise web services
groups in place.
Information delivery based
customized portal and
access control
P2 P6
P5
P4 P3
P8
P7 P9
P10
P12
P11

DO YOU LEVERAGE YOUR INFORMATION ASSETS? ASSESSMENT OF INFORMATION MANAGEMENT MATURITY IN PHARMACEUTICAL R&D (4)
LEVERAGING EXTERNAL INFORMATION/COLLABORATION CAPABILITIES
No external collaboration
and no need to access external
information – non existent
Access external information via ftp, internet and VPN
eROOM, SharePoint, stand alone EDC,
large scale R&D and clinical project
management based on MS projects and
visios
Third party project management tools chosen. R&D and
Clinical implemented document life cycle
strategies. Documentum and
other content management tools
chosen for information
archiving and regulatory
submissions
Fully leverage industry
standards of information and apply semantic
webs and ontology
standards. External
information integrated on-demand and
based on business needs
P2 P6
P5
P4 P3
P8
P7 P9
P10
P12
P11

PHARMA SALES, MARKETING AND MANAGED CARE
• Business Challenges
• Evolving Business Models
• Information Management Opportunities

HARNESSING INFORMATION MANAGEMENT FOR PHARMACEUTICAL S&M
Information Management Opportunities
• Global IM approach provides better insights and added value from core and emerging markets
• Global shared services allow robust integration of data sources and systems to drive efficiencies, support quality decisions and reduce costs
• Consistent, and consolidated data improves performance measurement such as launch success rate, product penetration rate across regions, globally and therapeutics areas.
• Integration of pharma, hospitals and payers data help realize the vision of EBM
• Integration of pharma, hospital, retails, PBM provide a more intelligent, integrated market view across national market, and alternative distribution channels
• Comprehensive dashboards drive optimal brand management at the global level and increase brand growth through performance measurement
• Integration of marketing analytics allow for better measurement of effectiveness of DTC and online marketing
• Consolidated reporting strategies reduce market research reporting costs,
Business Challenges
• Emerging Market • Cost Containment • Generic Market • Specialty Products and
Biologics • Managed Care • New Distribution Channels • Evidence based medicine
(EBM) • DTC/Online Marketing • eDetailing • Precision Medicine

Managed Markets Formulary Strategy
Sales Territory Alignment/ Management
Marketing Segmentation & Targeting
Gov
erna
nce
Infrastructure
Data Warehousing/Information Management
Master Data Management
(Customer, Product, Organization)
REFERENCE ARCHITECTURE FRAMEWORK FOR A TYPICAL PHARMACEUTICAL SALES, MARKETING AND MANAGED CARE ORGANIZATION
Info
rmat
ion
from
the
field
is c
aptu
red,
filte
red
upw
ard,
an
d us
ed to
mak
e op
erat
iona
l and
stra
tegi
c de
cisi
ons
Analysis performed on inform
ation from the field
yields insights that drive strategy and direction as well
as influence field operations
Cont
ract
Mana
gem
ent
HEO
R
Key
Acc
ount
Mana
gem
ent
E-Cha
nnel
s
Prof
essi
onal/
Org
ani
zatio
n D
etaili
ng
Sam
ple
Mana
gem
ent
Lite
ratu
re F
ulfi
llmen
t
Ince
ntiv
e Co
mpen
satio
n
Expen
se M
ana
gem
ent
Decision Support and Analytics (Bus Intelligence/Scenario Planning/Predictive Analytics)
Regula
tory Comp
liance
Spea
ker
Prog
ram
s
Cam
paig
n M
ana
gem
ent
Key
Op
inio
n Le
ader
Prim
ary
Mark
et R
esea
rch
/ Co
mpet
itive
Int
ellig
ence

UNDERSTAND ANALYTICAL NEEDS: WHAT BUSINESS QUESTIONS SALES AND MARKETING EXECUTIVES ASK LEAD TO DESIGN STRATEGY OF INFORMATION MANAGEMENT
22
© Copyright 2007 HP
S&M Analytical Areas: Groupings of KBQs into Analytical Areas to facilitate needs analysis.
Analytical KBQ Areas• Market Performance
– The analysis of Client’s position in the marketplace over time against competitors.
• Customer Segmentation
– The analysis of Customer behavior using groupings with similar characteristics that allow Client to tailor their communication and investments in an optimal fashion.
• Sales Tracking and Analysis
– The analysis of Script behavior across Customers and associated Sales Force activity and effectiveness.
• Lifecycle Management
– The analysis and between the drugs in various stages and Customer behaviors.
• Event Analysis
– The analysis of the impact and effectiveness of Customer Event activities and other communication touchpoints.
• Patient Outcome Analysis
– The analysis of patient adherence to product prescription/regimen and the rate of outcome achieved. May include comparisons to results expected from clinical trial systems.
These Analytical Areas allow us to analyze current challenges and issues associated with robustly answering KBQ’s that are similar in ways such as:
• Data Capture.Data not captured in Client systems consistently. May point to process, application or organization issues or data does not exist.
• Data IntegrationData exists across multiple systems, e.g. KOLs kept on multiple lists.
• Information AccessNo direct access or Analytical tools available.
• Data QualityIssues include sufficiency, completeness, accuracy.
• What is segment script writing behavior by region, by brand, by geography?
• How do customers in various segments compare on script volume?
• Which customers within a therapeutic class have the most per product market share and what is it?
• What is the brand adaptability by graduation date or specific school?
• How do we track segmentation of non-physician prescribers?
• What products have reached their saturation threshold with specific customers both now and forecasted?
• How many patients are in a doctors practice and what are the demographics over time?
• Which doctors influence the purchasing of which institutional entities for example, nursing homes?
• What is the retention time of a prescriber towards Client over time by product?
• How much does a customer cost to pursue and is there a significant variance in this by segment or region?
• How do we utilize segments at the household level for a practice entity?
• Is there a relationship between patient adherence and customer script growth? If so, what is it?
• Who are the Key Opinion Leaders (KOL) by therapeutic area, by geography?
• Which customers are most profitable by segment, by region?
• How can the best segment based opportunities be identified?
• What is the lifetime value of a doctor?
• What is the brand switching behavior of products by customer, by segment, by therapeutic class, by time, by geography?
• How can Client distinguish between brand switching and new scripting habits when there are steep changes in market share (e.g. significant decrease within a short time period)?
• How does segmented customer level market share compare to competitors within a product class?
Entities
• Addresses
• Affiliations
• Brand Hierarchy
• Compound
• Customers (Individual/ Org)
• Identifier
• Financial
• Healthcare Provider (HCP)
• Market Hierarchy
• Patient
• People (Employees, etc..)
• Physical Assets
• Product
• Product Hierarchy
• Promotion
Product
Other Vendor IMS
• Market
• Subclass
• Franchise
• Brand
• Strength
• Market Group
• Market
• Sub Market
• Sub Market a
• Sub Market b
• Brand
• Product
• Strength
• Packaging

THE TYPICAL MASTER DATA ENVIRONMENT IN THE INDUSTRY IS DIVERSE. A THOUGHTFUL APPROACH IS NEEDED TO RATIONALIZE MDM WHILE STILL MAINTAINING BUY-IN FROM USERS
Client
Siebel SFA salesforce.com
IMS WKH External
Data
Customer Master Storage is in Visage. No history.
Customer List
Manual Resolution for Rejects
Client In-house Developed System. IBM WebSphere DataStage for standardization and miscellaneous tools for matching.
Future Needs: • Internal Client Customer Lists, Medical
Affairs, KOLs, etc.. • Track affiliations e.g. nurses with
patients. • Data vendor Customer level.
Customer Mastering
Customer List
Believed to drop Customers for non-core products, even competitor data.
Product Mastering
SAP ECC Siebel
Salesforce.com
IMS WKH External
Data ???
Future Needs: Data vendor with competitor products. Their data may be sourced at a more granular level than today (today, at an aggregated and used at therapeutic class level).
Production Hierarchy: Compact and slowly changing.
No true Product mastering process is in place especially for competitor and switching analysis more granular than therapeutic class.
Geography/Territory Mastering
Custom Alignment
Siebel Salesforce.com
Siebel may both filter and transform CA data.
• Alignments have different hierarchies e.g. for Specialty, General Practitioner and Primary
• Geography: State, FSA, postal groups etc..
Client In-house Developed System
Employee Mastering
PeopleSoft Siebel
Custom Alignment
• Lacks all Reps in field.
• Manages hierarchies for HR purposes.
Contains contractors not in PeopleSoft.
Illustrative Pharma Mastering Environment
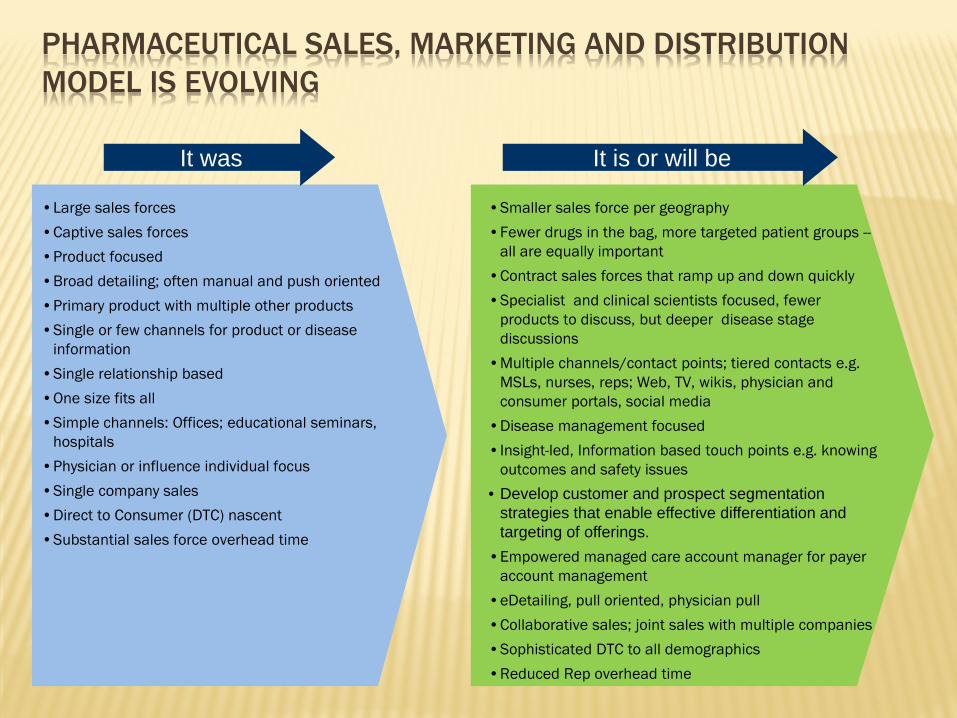
PHARMACEUTICAL SALES, MARKETING AND DISTRIBUTION MODEL IS EVOLVING
It was It is or will be
•Large sales forces •Captive sales forces •Product focused •Broad detailing; often manual and push oriented •Primary product with multiple other products •Single or few channels for product or disease
information •Single relationship based •One size fits all •Simple channels: Offices; educational seminars,
hospitals •Physician or influence individual focus •Single company sales •Direct to Consumer (DTC) nascent •Substantial sales force overhead time
•Smaller sales force per geography •Fewer drugs in the bag, more targeted patient groups --
all are equally important •Contract sales forces that ramp up and down quickly •Specialist and clinical scientists focused, fewer
products to discuss, but deeper disease stage discussions
•Multiple channels/contact points; tiered contacts e.g. MSLs, nurses, reps; Web, TV, wikis, physician and consumer portals, social media
•Disease management focused •Insight-led, Information based touch points e.g. knowing
outcomes and safety issues • Develop customer and prospect segmentation
strategies that enable effective differentiation and targeting of offerings.
•Empowered managed care account manager for payer account management
•eDetailing, pull oriented, physician pull •Collaborative sales; joint sales with multiple companies •Sophisticated DTC to all demographics •Reduced Rep overhead time

TO MEET EVOLVING BUSINESS NEEDS, INFORMATION MANAGEMENT MATURITY LEVEL WILL NEED TO BE INCREASED AS WELL
•Start global mastering with local customer masters
limited IM maturity Intermediate IM maturity Future IM Maturity
•Syndicated, global data feeds hubs
•Longitudinal patient centric predictive models to predict outcomes
Customer Centric View
Patient Centric View
360 Degree of All Customers and Patients
•Electronic medical records with integrated genomic profiles.
•Automatic, integrated safety reporting with single point of data entry (e.g. harmonized vocabularies for clinical data)
•Physician spend data integration with tight linkages to ERP systems.
•Off-the-label activities completely automated and tracked
•Real-time analytics aids faster and frequent territory coverage remaps
• Integrated data mining assists in pharma-covigilance and exploit in outcome based research
•Highly centralized and standardized
•Start data quality programs
•Start MDM shared service organizations
•Simplified Information architecture and framework; standardized and consolidated.
• Integrated SFA and CRM
•Start to develop integrated marketing channels
•Establish new compensation plans
•Support for flexible sales force structures as # realignments increases.
•Start to develop eDetailing POCs
• Implement integrated eDetailing
•Real-time S&M effectiveness and ROI analytics
•Gather new channel information to measure effectiveness.
•Limited real-time S&M data.
•Larger amounts of diverse data integration; data fusion; unstructured and structured.
•Global master data management systems as a value-add shared service.
•Region based IM
•Start integration maps with standard definitions

PHARMACEUTICAL COMPANY IS CHANGING FASTER THAN BEFORE. MOST COMPANIES LACK THE INFORMATION MANAGEMENT (IM) INFRASTRUCTURE TO SUPPORT CHANGE AND ACCOMMODATE LOCAL COUNTRY NEEDS
Illustrative Informatics Value Stack
Customer and Patient Analytics & Reporting
Data
Data Integration, Quality and Governance
IT Infrastructure • Regionally centralized; master data hubs • Generally infrastructure not outsourced but
changing • Shared services oriented • Some applications may be offered in SAAS
model for some countries
• S&M Transaction data is configured regionally • Master Data is implemented regionally and
locally, some opportunities for global master data
• Shared services model where possible (Master Data, analytics data, external data), some regional and some global
• Governance is local and regional, very few global • Quality rules are being standardized at local
level, but local variations will remain • Good master data and reference maps speed-up
data integrations • DI and DQ are implemented as shared services;
success varies
• Global platform and tools, local/regional implementation
• Master data and DI offers new analytic possibilities
• Specialty data mining more outsourced.
• Standard tools typically used such as BO, Cognos. Other tools not proven globally, e.g. Siebel Analytics, embedded reporting apps.
• Different lens created regionally, globally and different functional areas e.g. R&D and S&M.
• Programming labor outsourced. • Standard tools, may be some regional • Volume demands different approach to infrastructure for
global scalability • Different lens created for different groups is key
functionality; forced standardization has not worked well overall
• Local data services are offered due to local regulations • Efforts underway to standardize data for global analytics,
primarily around disease • Maintenance is outsourced, not the content/quality • Some definitions are being standardized
• Uniform hardware and software, few regional/local variations
• Apps and db maintenance often out-sourced. • Standard tools and platforms

BRIDGING THE GAP BETWEEN PHARMACEUTICAL MANUFACTURERS AND HEALTHCARE PROVIDERS, PAYERS AND GOVERNMENT
• Healthcare Economics and Outcome Research (HEOR) • Quality Index of Medical Care and Evidence based Medicine mandated
by Center for Medicare and Medicaid and the Healthcare Reform Act • Pay for Performance Reimbursement Model by Healthcare Payers • Superior clinical benefits and longitudinal impact demanded by
Healthcare Providers

PHARMACEUTICAL MANUFACTURING AND DRUG SUPPLY CHAIN
• Manufacturing Process and Challenges • Drug Supply Chain Process and Challenges • Federal and State Pedigree Legislation • Information Management Opportunities

PHARMACEUTICAL MANUFACTURING (GMP)
29
Pharmaceutical Development
Technology Transfer
Commercial Manufacturing
Product Discontinuation
Investigational Products
cGMP
Quality Assurance (QA) and Quality Control (QA) System
Corrective Action/Preventive Action (CAPA) System
Knowledge Management and Information Management

PHARMACEUTICAL SUPPLY CHAIN PROCESS
30
Chargeback
Rebate Payment
Returns / Recalls Credit
Order Payment
Order Payment
Financial Forward Reverse
Returns / Recalls Credit
Shipments
Shipments
Shipments
Product Forward Reverse
Pharmaceutical Co
Returns / Recalls
Returns
Returns / Recalls
Wholesaler
Pharmacy
PBM
Return Resale

PHARMACEUTICAL SUPPLY CHAIN CHALLENGES
31
Counterfeiting / Product Diversion
Regulatory Compliance
Supply Chain Management and Visibility
Improving Quality of Care
The level of pharmaceutical counterfeiting is approximately 5-10% of world trade. This represents a direct revenue loss of $24-$49B for the industry
Several states (California, Florida, etc.) have state legislation on drug pedigree. Federal Government (FDA) is considering adoption of track & trace technologies. Customers are beginning to apply the technologies for product recalls
Pharma experiences $2B in returns annually. The estimated typical percentage of a facility’s total monthly Rx volume returned by customers is 4% for distributors and 2% for manufacturers.
Increasing FDA concern on contaminated or ineffective products. 60% of counterfeits did not contain any active ingredients; 19% contained a wrong dosage and 16% contained inappropriate agents.

INFORMATION MANAGEMENT OPPORTUNITIES
32
Manufacturer Wholesaler Retail Production DC DC Chain DC Retail Store
Pedigree
Drug ID Info
Manufacturer
Pedigree
Drug ID Info
Manufacturer
Pedigree
Manufacturer
Drug ID Info
Wholesaler
Re-packaging
Pedigree
Drug ID Info
MFR Pedigree
Pedigree
Manufacturer
Drug ID Info
Re-packaging
Hospitals/Doctor’s Office
Pedigree
Drug ID Info
Re-packaging
Pedigree
Drug Id Info
MFRPedigree
Wholesaler Wholesaler
MFR Pedigree
MFR Pedigree
Pedigree
Drug ID Info
Re-packaging
MFR Pedigree
MFR Pedigree
TRACKING DRUG SUPPLY CHAIN DATA FLOW
Retailer

PHARMACEUTICAL IT MANAGEMENT
• CIO Challenges • Metrics that demonstrates aligns IT values to business priorities • IT Innovation Metrics that tied to biopharma companies • Information Management Opportunities to help IT organization run
like a business

CIOS FACE A BALANCING ACT: CONTAIN IT COSTS, DELIVER HIGHER QUALITY SERVICES AND APPLICATIONS AND LEAD INNOVATION IN A FAST-PACED BUSINESS ENVIRONMENT.
$0$20$40$60$80
$100$120$140$160$180$200 New server spending (USM$) 3% CAGR
’96 ’97 98 ’99 ’00 ’01 ’02 ’03 ’04 ’05 ’06 ’07 ’08
Cost of mgmt. & admin. 10% CAGR
$0$20$40$60$80
$100$120$140$160$180$200 New server spending (USM$) 3% CAGR
’96 ’97 98 ’99 ’00 ’01 ’02 ’03 ’04 ’05 ’06 ’07 ’08
Cost of mgmt. & admin. 10% CAGRCost of mgmt. & admin. 10% CAGRTrading analytics
Document transfer
Call center inquiries
Airline operations
Track financial position
Supply chain updates
Phone activation
Trade settlement
Build-to-order PC
Refresh data warehouse
107 106 105 104 1,000 100 10 1 Seconds
3 days 45 seconds
30 minutes 5 seconds
20 minutes 30 seconds
8 hours 10 seconds
1 day 5 minutes
1 day 15 minutes
3 days 3 minutes
1 month 1 hour
6 weeks 24 hours
5 days 1 day
Mail/express/fax/e-mail30 seconds3 days
Trading analytics
Document transfer
Call center inquiries
Airline operations
Track financial position
Supply chain updates
Phone activation
Trade settlement
Build-to-order PC
Refresh data warehouse
107 106 105 104 1,000 100 10 1 Seconds
3 days 45 seconds
30 minutes 5 seconds
20 minutes 30 seconds
8 hours 10 seconds
1 day 5 minutes
1 day 15 minutes
3 days 3 minutes
1 month 1 hour
6 weeks 24 hours
5 days 1 day
Mail/express/fax/e-mail30 seconds3 days
Speed
Cost Quality
Run IT ‘AS’ a business Run IT ‘FOR’ the business
Average IT operational spending growing at 3x other systems costs.

ILLUSTRATIVE METRICS: AN INTEGRATED SET IS NEEDED TO UNDERSTAND IT VALUE.
IT Mission/Value
IT Customers
Internal IT Processes
Enabling Technologies
IT Organizational Enablers
– Support new sales channels
– Improve time to market
– Better customer business processes
– Increase use of collaborative tools
– Contribute to business case development
– Technology refresh
– Reduce app. dev. time
– Better business understanding
– Faster recruitment– Provide integrated
performance criteria
– % of sales through new channel
– % of project delivery on time and on budget
– No. of IT-driven improvement opportunities identified
– No. of identified opportunities realized
– % of projects using coll. tools
– % of projects with IT contribution
– Time spent vs. planned– % of desktops >3 years old– % of new projects using RAD
methods– No. of bus. edu. forums
– Time to fill job requests– % of staff with business
initiative measures in review criteria
Objective Metrics Actual Target
9%
N/A
2
1
60%
70%
N/A25%20%
N/A
90 days10%
15%
90%
10 per year8 per year
90%
100%
+/-5%<5%80%
10 per year45 days75%
– Web/kiosk initiative
– New products program
– Value management program
– Value management program
– New products program
– Value management
– Value management– Infrastructure 2007– Development 2006
– Bus. education forum
– Employee dev. plan– Personal dev. plan
Initiatives
IT Mission/Value
IT Customers
Internal IT Processes
Enabling Technologies
IT Organizational Enablers
– Support new sales channels
– Improve time to market
– Better customer business processes
– Increase use of collaborative tools
– Contribute to business case development
– Technology refresh
– Reduce app. dev. time
– Better business understanding
– Faster recruitment– Provide integrated
performance criteria
– % of sales through new channel
– % of project delivery on time and on budget
– No. of IT-driven improvement opportunities identified
– No. of identified opportunities realized
– % of projects using coll. tools
– % of projects with IT contribution
– Time spent vs. planned– % of desktops >3 years old– % of new projects using RAD
methods– No. of bus. edu. forums
– Time to fill job requests– % of staff with business
initiative measures in review criteria
Objective Metrics Actual Target
9%
N/A
2
1
60%
70%
N/A25%20%
N/A
90 days10%
15%
90%
10 per year8 per year
90%
100%
+/-5%<5%80%
10 per year45 days75%
– Web/kiosk initiative
– New products program
– Value management program
– Value management program
– New products program
– Value management
– Value management– Infrastructure 2007– Development 2006
– Bus. education forum
– Employee dev. plan– Personal dev. plan
InitiativesInitiatives
IT Mission/Value
IT Customers
Internal IT Processes
Enabling Technologies
IT Organizational Enablers
– Reduce IT Cost– Maximize ESP
Performance
– Sustain appropriate cust. sat. levels through 2004
– Provide a secure IT environment
– Technology consolidation
– Standardization of development
– Thin-client simplification
– Keep and attract staff
– Improve hiring and promotions
– % of reduction in CAPEX– Cost of service comparison– Weighted % (by importance/
cost) of contractual achievement
– IT opinion survey/satisfaction rating
– % of compliance to policy– No. of monthly incidents
– No. of departmental servers eliminated
– % of two-screen desks– Change in IT development
costs as proportion of total
– % of conversion of possible desktops
– % of staff with important training needs not addressed
– % of open requests unfilled in >10 weeks
– No. of key positions with no successor ready in < 6 months
Objective Metrics Actual Target
1.5%N/A75%
3.25
80%2 per month143
9%N/A
45%
N/A
15%
1
– 2006 “to the bone”– Vendor management
program
– IT customer sat. survey
– Enterprise security program
– 2006 “to the bone”– Infrastructure 2007– Infrastructure 2007– Infrastructure 2007
– Infrastructure 2007
– Personal development program
– employee development plan
– employee development plan
5%+/- 8%85%
3.5
100%<4 per month400
0%-5%
95%
<15%
20%
2
Initiatives
IT Mission/Value
IT Customers
Internal IT Processes
Enabling Technologies
IT Organizational Enablers
– Reduce IT Cost– Maximize ESP
Performance
– Sustain appropriate cust. sat. levels through 2004
– Provide a secure IT environment
– Technology consolidation
– Standardization of development
– Thin-client simplification
– Keep and attract staff
– Improve hiring and promotions
– % of reduction in CAPEX– Cost of service comparison– Weighted % (by importance/
cost) of contractual achievement
– IT opinion survey/satisfaction rating
– % of compliance to policy– No. of monthly incidents
– No. of departmental servers eliminated
– % of two-screen desks– Change in IT development
costs as proportion of total
– % of conversion of possible desktops
– % of staff with important training needs not addressed
– % of open requests unfilled in >10 weeks
– No. of key positions with no successor ready in < 6 months
Objective Metrics Actual Target
1.5%N/A75%
3.25
80%2 per month143
9%N/A
45%
N/A
15%
1
– 2006 “to the bone”– Vendor management
program
– IT customer sat. survey
– Enterprise security program
– 2006 “to the bone”– Infrastructure 2007– Infrastructure 2007– Infrastructure 2007
– Infrastructure 2007
– Personal development program
– employee development plan
– employee development plan
5%+/- 8%85%
3.5
100%<4 per month400
0%-5%
95%
<15%
20%
2
IT Value Proposition Starts with:
IT Value Proposition Oriented towards Innovation and Growth IT Value Proposition Targeted to Cost Containment Goals
IT Mission/Value
IT Customers
Internal IT Processes
Enabling Technologies
IT Organizational Enablers
–Optimize the return on IT investment
–Contribute value to business processes
–Optimize use of enterprise services
–Streamline business unit services
–Technology migration
–Establish value focus
–Faster application dev.
– Improve moves, adds and changes (MAC) management
–Leverage ESP–Attract and retain staff
with appropriate skills for services offered
– % of revenue spent on IT– % of IT budget spent on new
investments– IT opinion survey/satisfaction
rating
– Infrastructure alignment index– Post-acceptance satisfaction
score– Application alignment index
– % of facilities at company standards
– % of projects coming through value process
– On-time delivery
– % of SLA requests to install met– No. of versions installed at same
time– No. of software releases and
dist. methods per platform– % of noncore positions
outsourced– Attrition rate improvement
Objective Metrics Actual Target
1.2%15%
N/A
0.852.5
0.50
75%
50%
30%
70%N/A
N/A
25%
-2% per year
Initiatives
2%50%
75%
2.04.0
2.0
95%
100%
90%
100%<3
max. 2
95%
10% per year
– Value mgmt. program– Program mgmt.
– Infrastructure 2007
– Program mgmt. – Value mgmt. program
– Program mgmt.
– Infrastructure 2007
– Value mgmt. program
– Infrastructure 2007
– Infrastructure 2007– Infrastructure 2007
– Infrastructure 2007
– Infrastructure 2007
– Employee development program
• Aligning IT objectives to relevant business units goals
• Developing metrics to track progress
• Launching key IT initiatives to support those goals

INNOVATION METRICS ARE PARTICULARLY IMPORTANT TO PHARMACEUTICAL CIO AS MORE COMPANIES ARE FACING PATENT CLIFF AND REVENUE SHRINKAGE
Percent measure. Cumulative Project Workdays spent on new projects, divided by the Total number of workdays available, expressed as a percentage
Effort normally gets split between Maintenance, Enhancement, operations and new projects. Infrastructure, M&E spending is largely non-discretionary and mostly not value creating in the same way as new projects are. The significance of this measure the larger the proportion I&M&E spending is of the IT budget, the less proportionately there is for new projects.
LagPercentage of effort on new projects
Innovation
Percent measure. For a given time period, the new development budget (for the month, for the quarter and year-to-date) allocated to strategic projects (as defined), divided by the total new development budget for the same period
A measure that attempts to quantify how much innovation is taking place. Since this is a notoriously difficult factor to manage, surrogate measures are usual: number of patents, number of invitations to speak at conferences, number of publications in peer reviewed journals.
LeadLevel of activity in innovation work.
Innovation
Year to date measure. The total number of "learning events" heldA (qualitative) measure of knowledge sharing - usually a survey or surrogate measure such as documents referenced or designs reused - scaled by the number of learning events: meetings, teleconferences and so on, to gauge how effective these learning events are
LeadKnowledge Sharing & Learning Events Held
Innovation
Percent measure. For a given period, during an employee satisfaction survey, the number of full-time equivalents giving a score of high and very high to the question regarding 'This is a place that encourages innovation" , divided by the total numberof full-time-employees completing the survey
A measure that attempts to quantify the almost unquantifable. The only meaningful way of applying this measure is to seek the opinion of a competent authority and use this opinion to show the degree to which the environment encourages innovation
LeadExtent to which an environment is in place which encourages innovation
Innovation
Measure of age. For all assets, the sum of the number of days since each asset was first used (or purchased for unused assets), divided by the number of assets whose age is being counted, expressed in days, months or years, depending on the asset type
An aggregate measure of the age of hardware assets, usually divided into categories (mainframe, servers, desktops). This measure is useful if demonstrating the impending need to replace assets or for planning asset refresh cycles
LeadAverage age of hardwareInnovation
Percent measure. For a given time period, the new development budget (for the month, for the quarter and year-to-date) allocated to strategic projects (as defined), divided by the total new development budget for the same period
Measure of the degree to which IT budget can be directed into new - and strategic or high pay off - projects
Lead% of new development budget for strategic projects
Innovation
Percent measure. For a given time period, the number projects using Rapid Application Development tools and approaches (as defined), divided by the sum of projects using RAD tools plus projects not using RAD tools, expressed as a percent
An architectural target measure charting the adoption rate of Rapid Application Development, an interactive prototyping approach to application development
Lead% new projects using RAD Methods
Innovation
Value measure over time. Every time a patent is rewarded or an award is received, this measure is incremented by one and the date recorded
Measure of the level of innovation exercised by the IT groupLead# Of patents and other awards
Innovation
Percent measure. For a given time period, the number new development projects using "strategic technologies" (as defined), divided by the total number of new development projects, expressed as a percent
A measure indicating the uptake of new technologies (such as RFID and so on, depending on the enterprise's requirement) Usually expressed as a proportion of projects underway, there is a definitional issue that must be resolved: to what extent does a new technology have to be part of the project before it can be counted? 1% of budget? 10% of budget...
LagNumber of New Technology Applications
Innovation

IT INFORMATION MANAGEMENT OPPORTUNITIES: FROM STRATEGIC IT METRICS TO CIO SCORECARD
CIO Scorecard
IT Performance Indicators
Business Impact
Financial

INFORMATION MANAGEMENT OPPORTUNITY USE CASE: LEVERAGE IT METRICS TO HELP YOU DEVELOP A PROVEN IT VALUATION MODEL
Identify Relevant Metrics to be Tracked and Communicated
Gartner BusinessValue Model
MarketResponsiveness
SupplierEffectiveness
ProductDevelopmentEffectiveness
OperationalEfficiency
Financeand Regulatory
Responsiveness
CustomerResponsiveness
SalesEffectiveness
InformationTechnology
Responsiveness
Sales OpportunityIndex
ForecastAccuracy
ClientRetention Index
Sales CycleIndex
Sales PriceIndex
Sales CloseIndex
On-TimeDeliveryService
Performance
Order FillRate
AgreementEffectiveness
TransformationRatio
MaterialQuality
SystemsPerformance
New ProjectsIndex
IT Total CostIndex
IT SupportPerformance
PartnershipRatio
Service LevelEffectiveness
Human Resources
Responsiveness
Demand Management
Supply Management
Support Services
CustomerResponsiveness
SalesEffectiveness
InformationTechnology
Responsiveness
1 2
3 4
The ITThe ITView View CSFsCSFs
The BusinessThe BusinessView View KOIsKOIs Increase
customer loyalty
Cross-selling
Billing accuracy
Faster product/serviceintroduction
Market retention
Revenue percustomer
Reduce rework
Market share
Make it easier to do businesswith the corporation
Knowledge mgmt.
Legacy sys. maint.
Reducecycle time
Customers accessingthe Web site
Cust. files Billing-error
rate Auto. test
process
No. of staff members trained on Java
DBMSstandardization
Consolidatebilling systems
Select/implement new tools
The BusinessThe BusinessView View CSFsCSFs
The ITThe ITView View KOIsKOIs
The ITThe ITView View KPIsKPIs
CSF = Critical success factorKOI = Key outcome indicatorKPI = Key performance indicator
CSF = Critical success factorKOI = Key outcome indicatorKPI = Key performance indicator
How the business must succeed Outcomes
of business processes How
IT must succeed Outcomes
of IT processes Measures
of IT performance
Challenge: Reduce dependence on agents and lower cost of sales
Initiative: Web-based selling
Challenge: Reduce dependence on agents and lower cost of sales
Initiative: Web-based selling
Gartner Business Value Model
Business CaseBenefits: $3.2 m
Costs: 2.3 mNet: $0.9 mROI: 39%
Payback: 11 Months
Business CaseBenefits: $3.2 m
Costs: 2.3 mNet: $0.9 mROI: 39%
Payback: 11 Months
SupplierEffectiveness
ProductDevelopmentEffectiveness
OperationalEfficiency
Financeand Regulatory
Responsiveness
Human Resources
Responsiveness
DemandDemandManagementManagement
SupplySupplyManagementManagement
SupportSupportServicesServices
CustomerResponsiveness
MarketResponsiveness
SalesEffectiveness
InformationTechnology
Responsiveness
Challenge: Reduce dependence on agents and lower cost of sales
Initiative: Web-based selling
Challenge: Reduce dependence on agents and lower cost of sales
Initiative: Web-based selling
Gartner Business Value Model
Business CaseBenefits: $3.2 m
Costs: 2.3 mNet: $0.9 mROI: 39%
Payback: 11 Months
Business CaseBenefits: $3.2 m
Costs: 2.3 mNet: $0.9 mROI: 39%
Payback: 11 Months
SupplierEffectiveness
ProductDevelopmentEffectiveness
OperationalEfficiency
Financeand Regulatory
Responsiveness
Human Resources
Responsiveness
DemandDemandManagementManagement
SupplySupplyManagementManagement
SupportSupportServicesServices
CustomerResponsiveness
MarketResponsiveness
SalesEffectiveness
InformationTechnology
Responsiveness
Target
Market ResponsivenessChannel Profitability Index 68% 76%
Sales Effectiveness70% 73% 75%
IT Responsiveness
Baseline ExternalBenchmark
66% 72%
Sales Opportunity Index 41% 55%Sales Close Index
Client Retention Index
43% 46% 50%40% NA25% 35%26% 28% 31%25% NA55% 65%57% 60% 63%53% 63%
Systems PerformanceIT Support Performance
98.5% 99%98.7% 98.9% 98.6%98.2% 99%90% 95%91% 93% 93%90% 94%
Time
Q 4Q 3Q 2Q 1
How is the Web initiative going?
Partnership RatioService-Level Effectiveness
28% 50%33% 35% 38%29% 45%79% 85%82% 85% 84%80% 84%
New Projects IndexIT Total Costs Index
47% 60%50% 54% 59%48% 57%3.2% 3.1%3.3% 3.1% 3.2%3.2% 3%
Link business to IT performance management… …using business metrics to attract business interests…
…Provide post-implementation tracking using metrics agreed with Business.
…linking IT initiatives to business metrics and ROI…

INFORMATION MANAGEMENT FRAMEWORK
39

ESTABLISHING INFORMATION MANAGEMENT ARCHITECTURAL FRAMEWORK AND BUILDING THE CAPABILITIES WILL BE CRUCIAL TO SUPPORT THE CHANGING BUSINESS LANDSCAPE
• Master and Reference Data
• Business Intelligence Data
• Transaction Data • External Data • Semi-Structured Data • Unstructured Data • Data Access • Data Delivery • Data Integration • Process Integration • Transformations • Business Rules
• Meta Data Repository • Enterprise Data Models • Service Registry • Directories • BI Definitions and
configurations • Integration Definitions • Access Definitions • Delivery Definitions • Transformation Definitions • Process Definitions • Business Rules Repository
IM Framework components… …defined by…
• Business Goals & Principles • IT Goals and Principles • IM Organization • Enterprise Governance
• Information Governance • Service Governance • Process Governance • Application Governance • Infrastructure Governance
• Change Management • Information Lifecycle Management • Compliance & Risk Management • Enterprise Architectural Standards
…and driven by:
Typical IM Strategy Process map
Information Access Information Architecture & Integration
Information Quality (MDM)
• IM Governance
• Technical Architecture
• Service Definition

MASTER DATA MANAGEMENT SOLUTION FRAMEWORK: THINK LOCALLY, STANDARDIZE REGIONALLY, ANALYZE GLOBALLY. DO NOT “OVER MASTER.”
EDM Governance & Stewardship –
Acquisition & Authoring Services
Distribution Services
Metadata Services
Master Data Management
Services
Data Quality Services
Administration Services
Maintenance Services
Master Data Consumers
Acquisition & Authoring • Real-time/Near • Batch • Change Capture
Distribution • Self-service (pull) interface • Publishing (push) interface • Messaging-oriented interface
Data Quality • Validation • Audit, balance & control • Quality Tracking
Metadata • Metadata shopping • Impact analysis • Operations Monitoring • Quality Investigations
Administration and Maintenance • Change management • Security management • Operational support • Process monitoring • Performance management
Stewardship Process • Distribution Request • New/changed Master Data Request • Quality Improvement Initiative • Operations & Quality Monitoring
Master Data Management • Historical Data Management • Storage services • Schema services • Mapping/alignment Services • Hierarchy Management
Suppliers • Authoritative Sources • End-user Authoring
Master Data Suppliers
Workflow Services
Workflow Services • Review and Correction • Approval and Publishing • Exception escalation