Embed Size (px)
Citation preview

How to interpret the sales stats behind
a new grocery product launch The most important data to see and act on
Tim Eales – Director of Strategic Insight
Copyright © 2016 Information Resources, Inc. (IRI). Confidential and Proprietary. 2
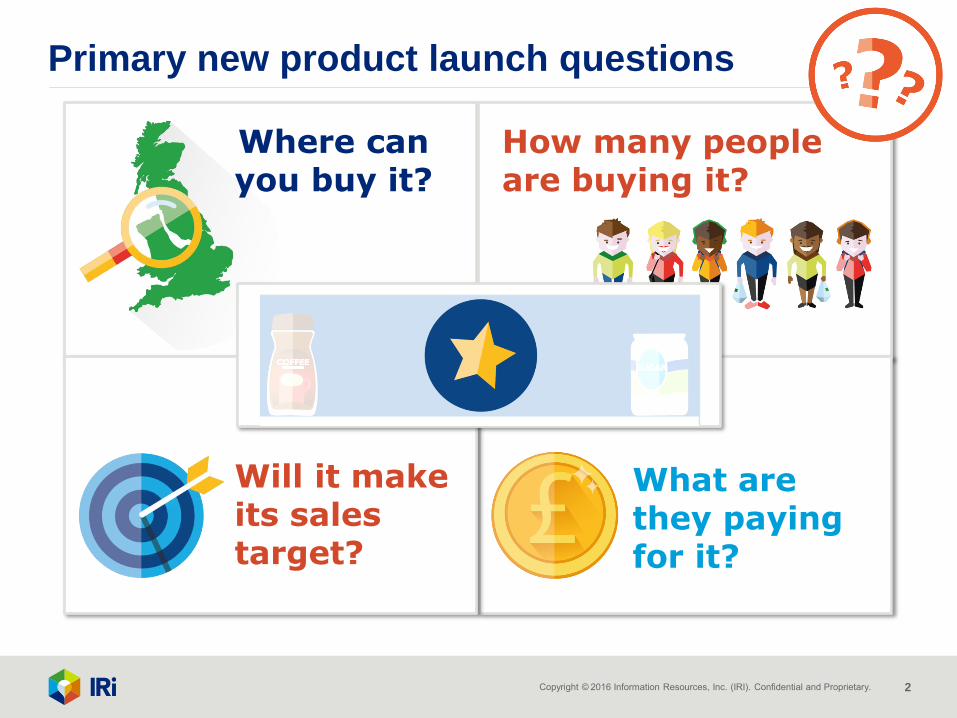
Where can you buy it?
How many people are buying it?
What are they paying for it?
Will it make its sales target?
Primary new product launch questions

Copyright © 2016 Information Resources, Inc. (IRI). Confidential and Proprietary. 3
Rate of sale per store
Sales and share
Price paid & promotion
Consumer trial & repeat
Store distribution
Primary new product launch statistics
Copyright © 2016 Information Resources, Inc. (IRI). Confidential and Proprietary. 4
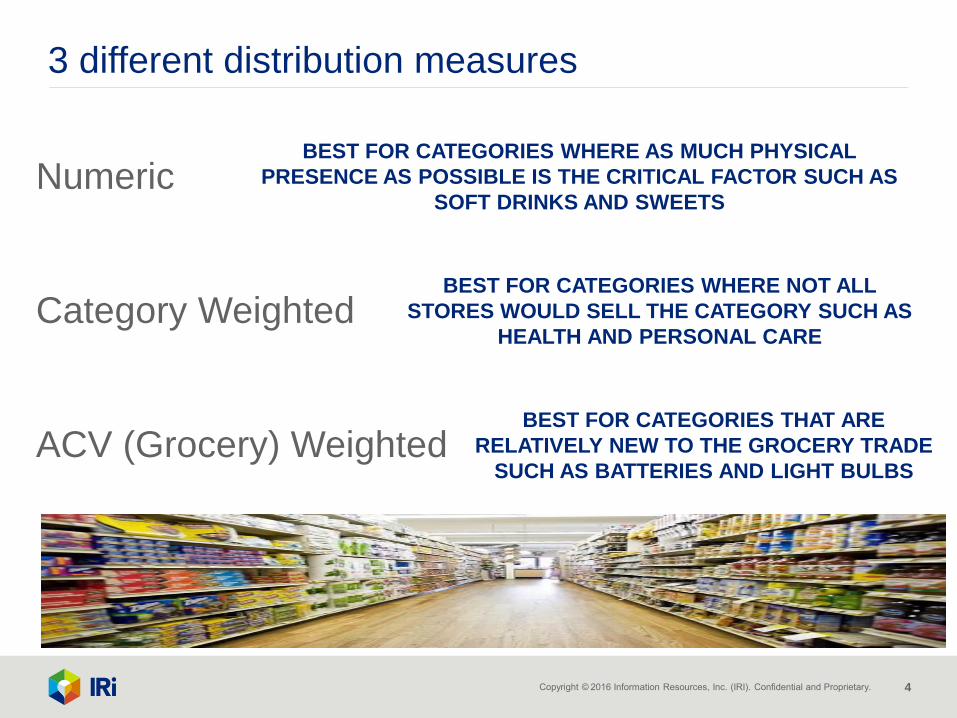
3 different distribution measures
Numeric
Category Weighted
ACV (Grocery) Weighted
BEST FOR CATEGORIES WHERE AS MUCH PHYSICAL
PRESENCE AS POSSIBLE IS THE CRITICAL FACTOR SUCH AS
SOFT DRINKS AND SWEETS
BEST FOR CATEGORIES WHERE NOT ALL
STORES WOULD SELL THE CATEGORY SUCH AS
HEALTH AND PERSONAL CARE
BEST FOR CATEGORIES THAT ARE
RELATIVELY NEW TO THE GROCERY TRADE
SUCH AS BATTERIES AND LIGHT BULBS

Copyright © 2016 Information Resources, Inc. (IRI). Confidential and Proprietary. 5
Distribution calculation – SINGLE ITEM LEVEL (UPC)
50% of coffee sales 30% 20%
50%
70%
80%
CWD
Item 1
Item 2
Item 3
Category Weighted Distribution represents
the proportion of category sales that take place
in the stores where your product is sold

Copyright © 2016 Information Resources, Inc. (IRI). Confidential and Proprietary. 6
13.0
24.7
17.5 15.0 14.4 15.3
less than 15% 15% to 30% 30% to 45% 45% to 60% 60% to 75% over 75%
Achieving a very high level of distribution as a new product is relatively
rare. The mid-point, with 50% above and 50% below, is just 36%.
PROPORTION OF NEW
PRODUCTS BY MAXIMUM
DISTRIBUTION IN MULTIPLES
ONLY 15% OF NEW
LAUNCHES EVER
ACHIEVE GREATER
THAN 75% CWD
IRI New Product study – 3378 New products launched from January 2013 to June 2015

Copyright © 2016 Information Resources, Inc. (IRI). Confidential and Proprietary. 7
Sales Rate Index is the primary measure of new product success
“The test of selling at least as well as most of their
competition on the shelves next to them”
Which product is
going to make it into
the shopper’s
trolley?
Copyright © 2016 Information Resources, Inc. (IRI). Confidential and Proprietary. 8
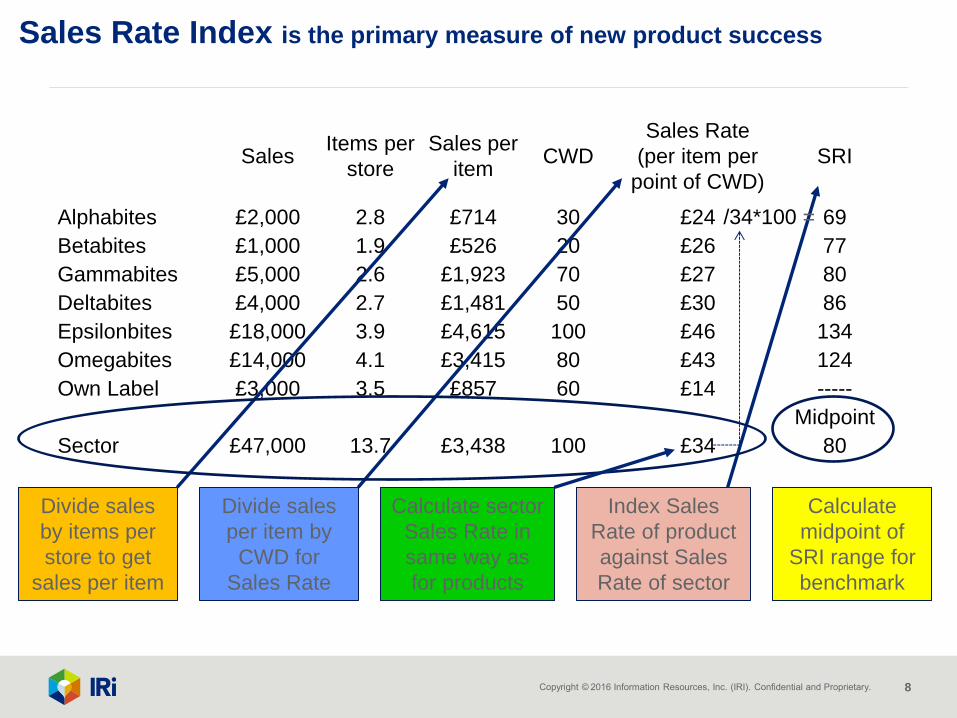
Sales Rate Index is the primary measure of new product success
Sales Items per
store
Sales per
item CWD
Sales Rate
(per item per
point of CWD)
SRI
Alphabites £2,000 2.8 £714 30 £24 69
Betabites £1,000 1.9 £526 20 £26 77
Gammabites £5,000 2.6 £1,923 70 £27 80
Deltabites £4,000 2.7 £1,481 50 £30 86
Epsilonbites £18,000 3.9 £4,615 100 £46 134
Omegabites £14,000 4.1 £3,415 80 £43 124
Own Label £3,000 3.5 £857 60 £14 -----
Midpoint
Sector £47,000 13.7 £3,438 100 £34 80
Divide sales
by items per
store to get
sales per item
Divide sales
per item by
CWD for
Sales Rate
Index Sales
Rate of product
against Sales
Rate of sector
Calculate
midpoint of
SRI range for
benchmark
Calculate sector
Sales Rate in
same way as
for products
/34*100 =
Copyright © 2016 Information Resources, Inc. (IRI). Confidential and Proprietary. 9
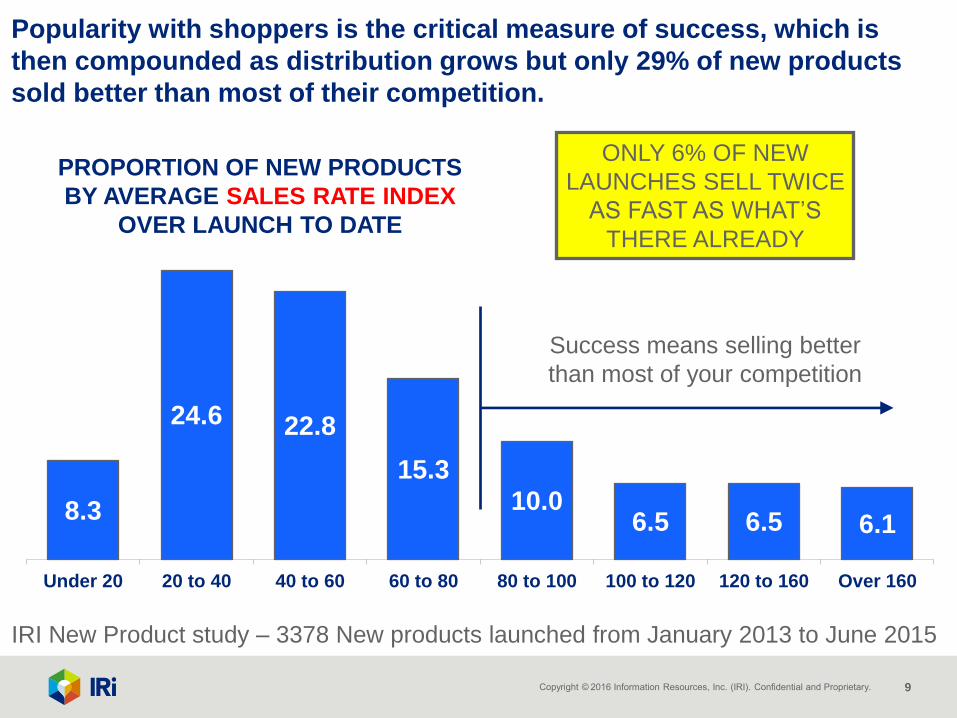
8.3
24.6 22.8
15.3
10.0 6.5 6.5 6.1
Under 20 20 to 40 40 to 60 60 to 80 80 to 100 100 to 120 120 to 160 Over 160
Popularity with shoppers is the critical measure of success, which is
then compounded as distribution grows but only 29% of new products
sold better than most of their competition.
PROPORTION OF NEW PRODUCTS
BY AVERAGE SALES RATE INDEX
OVER LAUNCH TO DATE
ONLY 6% OF NEW
LAUNCHES SELL TWICE
AS FAST AS WHAT’S
THERE ALREADY
Success means selling better
than most of your competition
IRI New Product study – 3378 New products launched from January 2013 to June 2015
Copyright © 2016 Information Resources, Inc. (IRI). Confidential and Proprietary. 10
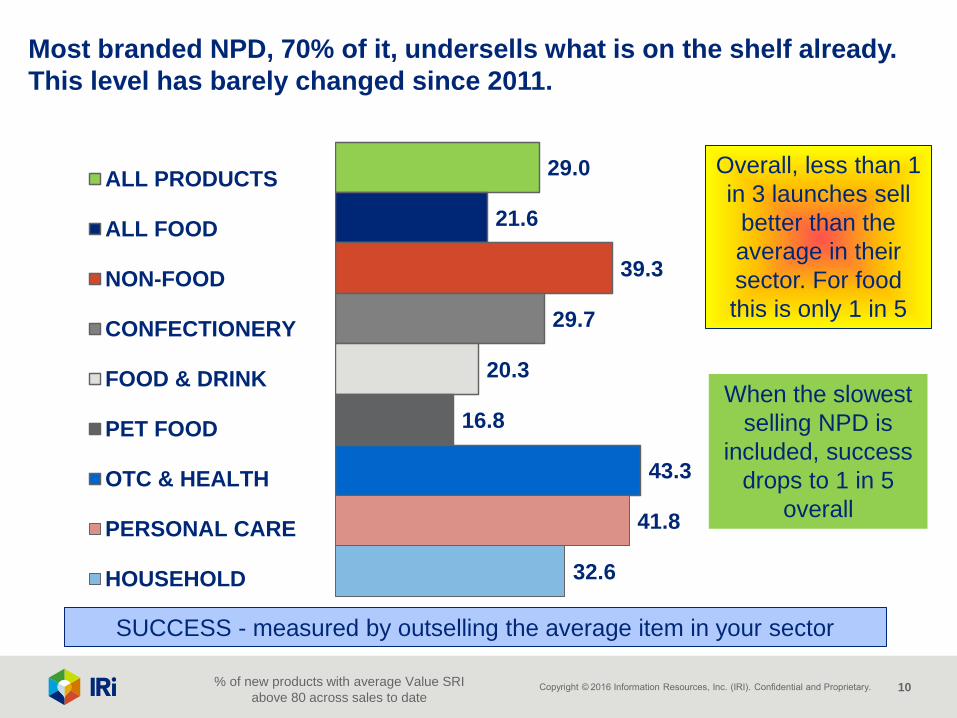
Most branded NPD, 70% of it, undersells what is on the shelf already.
This level has barely changed since 2011.
29.0
21.6
39.3
29.7
20.3
16.8
43.3
41.8
32.6
ALL PRODUCTS
ALL FOOD
NON-FOOD
CONFECTIONERY
FOOD & DRINK
PET FOOD
OTC & HEALTH
PERSONAL CARE
HOUSEHOLD
SUCCESS - measured by outselling the average item in your sector
% of new products with average Value SRI
above 80 across sales to date
Overall, less than 1
in 3 launches sell
better than the
average in their
sector. For food
this is only 1 in 5
When the slowest
selling NPD is
included, success
drops to 1 in 5
overall

Copyright © 2016 Information Resources, Inc. (IRI). Confidential and Proprietary. 11
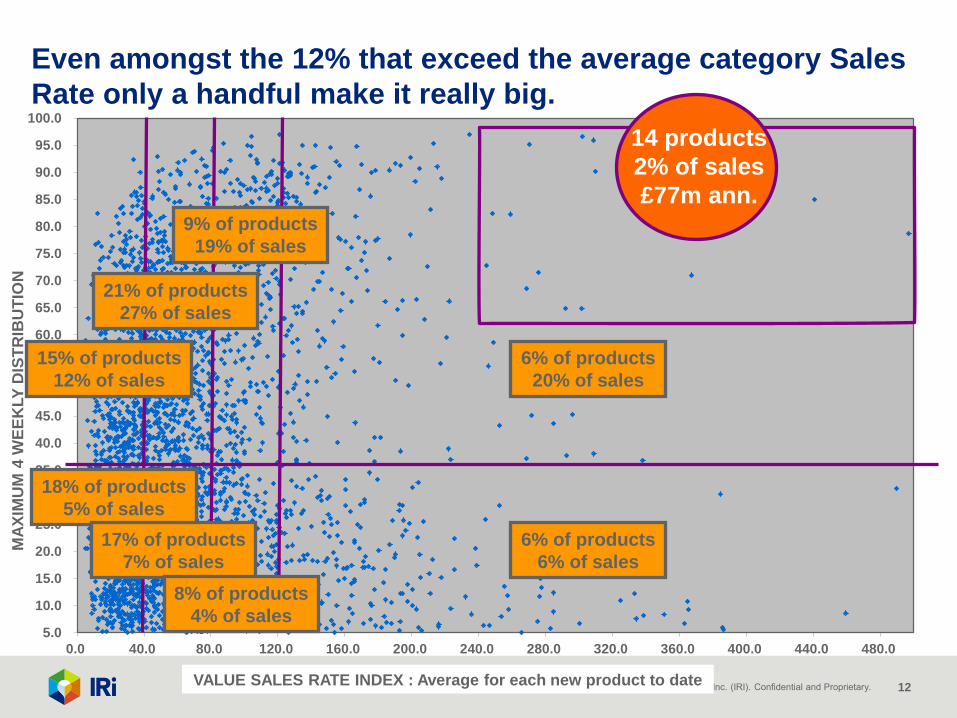
0.0
10.0
20.0
30.0
40.0
50.0
60.0
70.0
4 8 12 16 20 24 28 32 36 40 44 48 52 56 60 64 68 72 76 80 84 88 92 96 100 104 108 112 116 120 124 128
SALES RATE 50% OR MOREABOVE AVERAGE
SALES RATE LESS THAN 50%OF AVERAGE
If a new product is not selling well (low Sales Rate Index) then it
tends to lose distribution after about 9 months.
Distribution Trend for HIGH DISTRIBUTION GROUPS
Max CWD over 36%
WEEKS FROM LAUNCH : Average new product trend over first 2.5 years
Copyright © 2016 Information Resources, Inc. (IRI). Confidential and Proprietary. 12
5.0
10.0
15.0
20.0
25.0
30.0
35.0
40.0
45.0
50.0
55.0
60.0
65.0
70.0
75.0
80.0
85.0
90.0
95.0
100.0
0.0 40.0 80.0 120.0 160.0 200.0 240.0 280.0 320.0 360.0 400.0 440.0 480.0
VALUE SALES RATE INDEX : Average for each new product to date
MA
XIM
UM
4 W
EE
KLY
DIS
TR
IBU
TIO
N
18% of products
5% of sales
17% of products
7% of sales
8% of products
4% of sales
6% of products
6% of sales
15% of products
12% of sales
21% of products
27% of sales
9% of products
19% of sales
6% of products
20% of sales
14 products
2% of sales
£77m ann.
Even amongst the 12% that exceed the average category Sales
Rate only a handful make it really big.
Copyright © 2016 Information Resources, Inc. (IRI). Confidential and Proprietary. 13
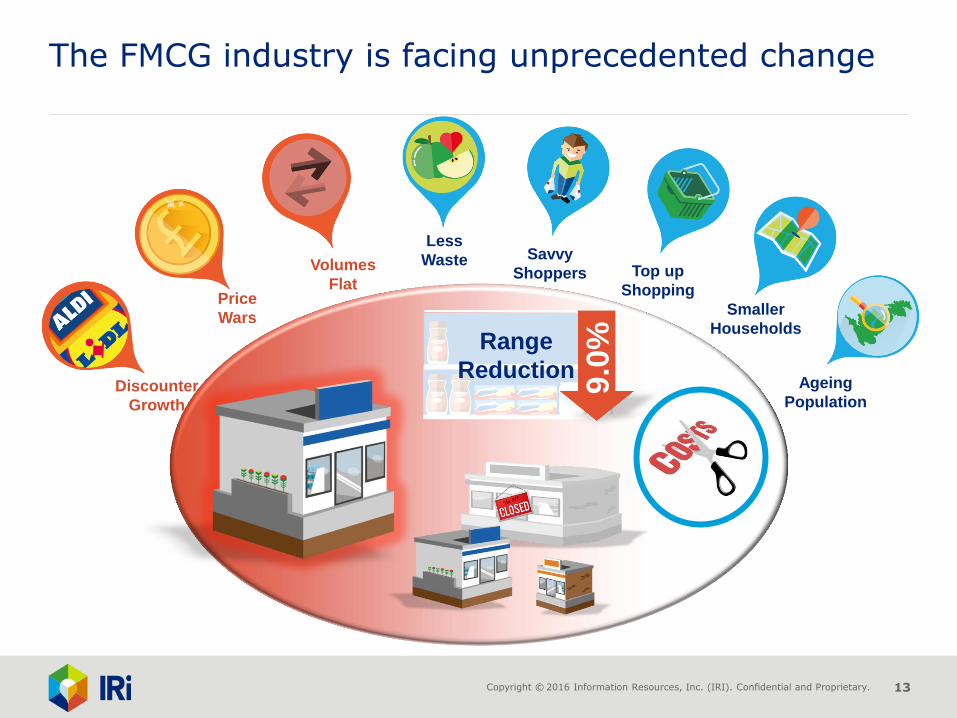
The FMCG industry is facing unprecedented change
Range
Reduction
9.0
%
Savvy
Shoppers Top up
Shopping
Smaller
Households
Ageing
Population
Less
Waste
Discounter
Growth
Price
Wars
Volumes
Flat
Copyright © 2016 Information Resources, Inc. (IRI). Confidential and Proprietary. 14
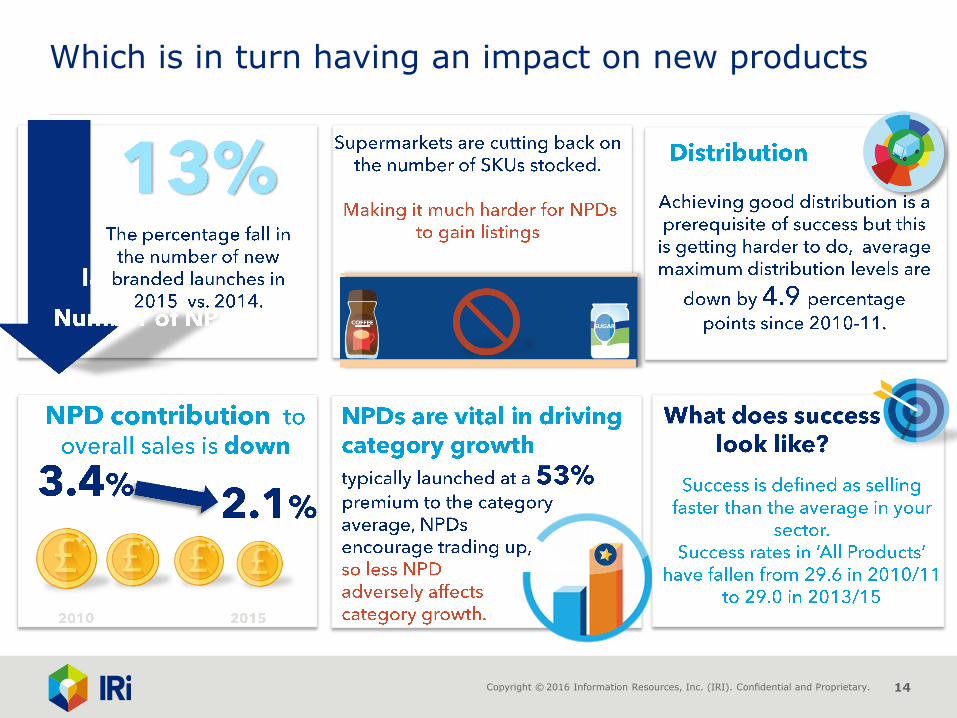
Which is in turn having an impact on new products

How to interpret the sales stats behind
a new grocery product launch The most important data to see and act on
Tim Eales – Director of Strategic Insight