Embed Size (px)
Citation preview

Making Marketing More Effective: A Social Perspective
Irfan KamalGlobal Head, Data+Analytics, Products & Partners@irfankamal / [email protected]

2Copyright © 2014 Ogilvy & Mather
How do We Demonstrate ROI with Social Projects?
TRACK IMPACT ON
BUSINESS RESULTS
NOT (JUST) ACTIVITY

Social Content Impact™ Measurement FrameworkSocial business impact optimization
4Copyright © 2014 Ogilvy & Mather
Reach
• What’s the size of the audience exposed to the message?
Action
• What bottom line actions did the exposed audience take, e.g. purchase?
Social Content Impact: Optimization FrameworkHow is Content/Channel/Conversation Driving Business Impact?
Attitudes
• What’s the exposed audience’s awareness, preference and/or perception of the brand?
12
LENSES:IMPACT ON…
Audience
Segment
Individual

5Copyright © 2014 Ogilvy & Mather
Social Content Impact: Caveat! Focus on What MattersKPIs vs. Optimization Metrics
KPIs
Are we winning or losing?
• Provide a top-line view of the success of its social media efforts
• KPIs should align to the brand’s business objectives
Optimization
Metrics
Which levers do we need to pull?
• Identify what changes need to be made to engagement strategy in order to improve KPI performance
Dive into the 3 Key Ways Social Drives ROIHint: think “connected social”
7Copyright © 2014 Ogilvy & Mather
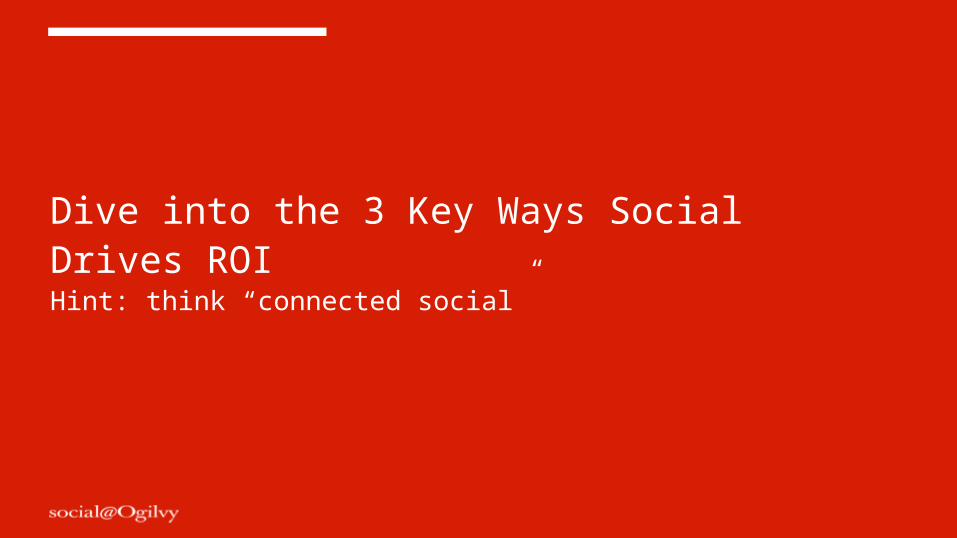
Three Types of Social-Driven ROI We can Demonstrate Today
• Social for Greater Sales
• Direct
• Indirect
• Social for Improved Brand Metrics
• Social for More Efficient Marketing
• Lower cost per engagement/sale
Sales3 approaches to think about social as a sales driver

9Copyright © 2014 Ogilvy & Mather
A good starting point
WHAT’S THE EASIEST WAY TO
DEMONSTRATE ROI?
10Copyright © 2014 Ogilvy & Mather
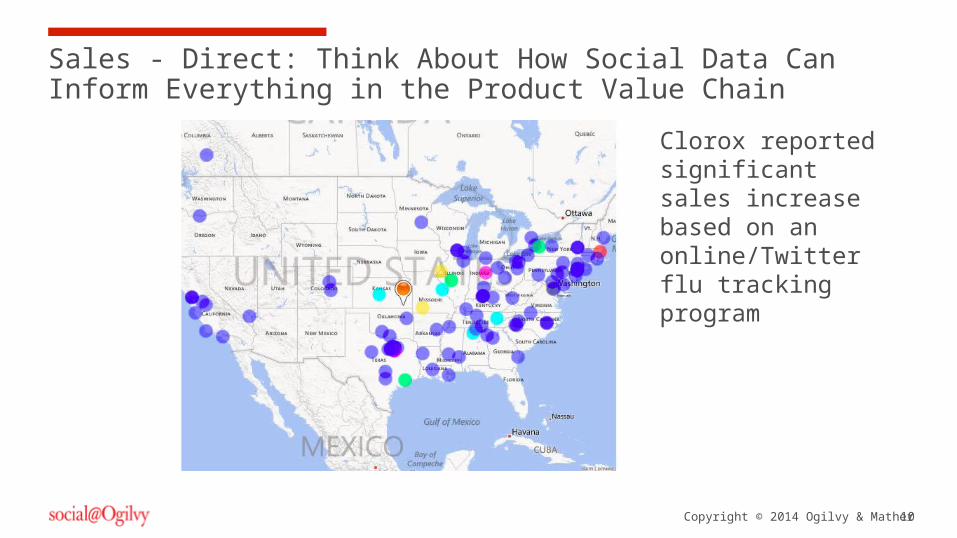
Sales - Direct: Think About How Social Data Can Inform Everything in the Product Value Chain
Clorox reported significant sales increase based on an online/Twitter flu tracking program
11Copyright © 2014 Ogilvy & Mather
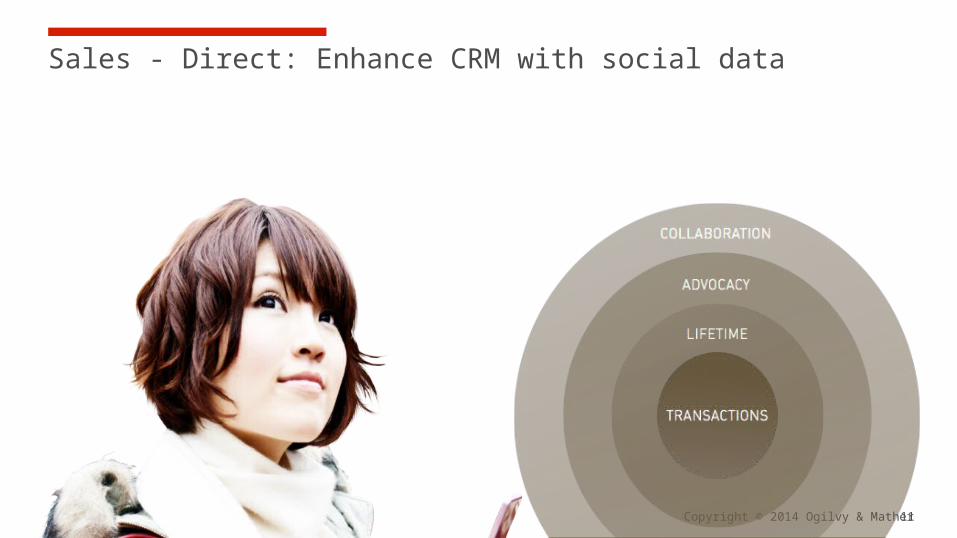
Sales - Direct: Enhance CRM with social data
12Copyright © 2014 Ogilvy & Mather
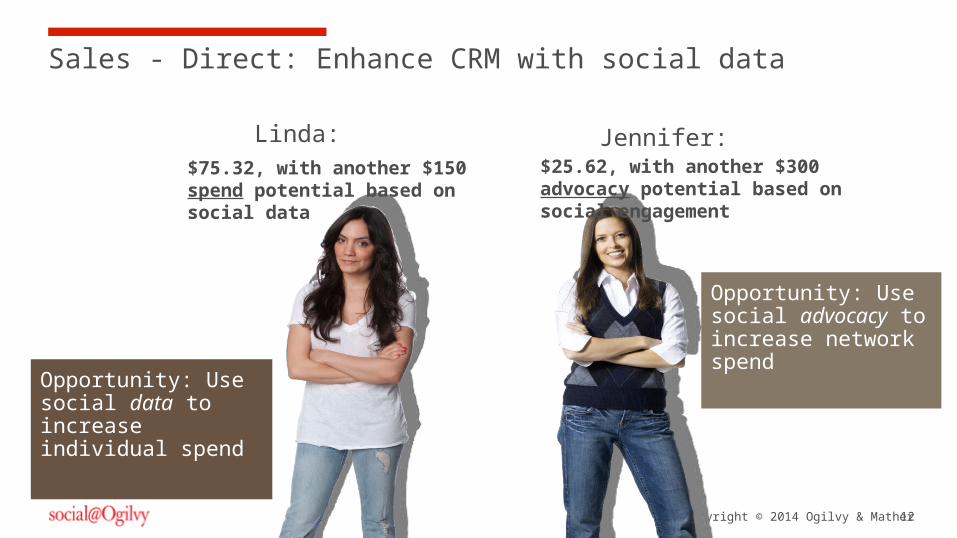
Sales - Direct: Enhance CRM with social data
Linda: Jennifer:
Opportunity: Use social data to increase individual spend
Opportunity: Use social advocacy to increase network spend
$75.32, with another $150 spend potential based on social data
$25.62, with another $300 advocacy potential based on social engagement

13Copyright © 2014 Ogilvy & Mather
Example: Unlock Advocacy Value
14Copyright © 2014 Ogilvy & Mather
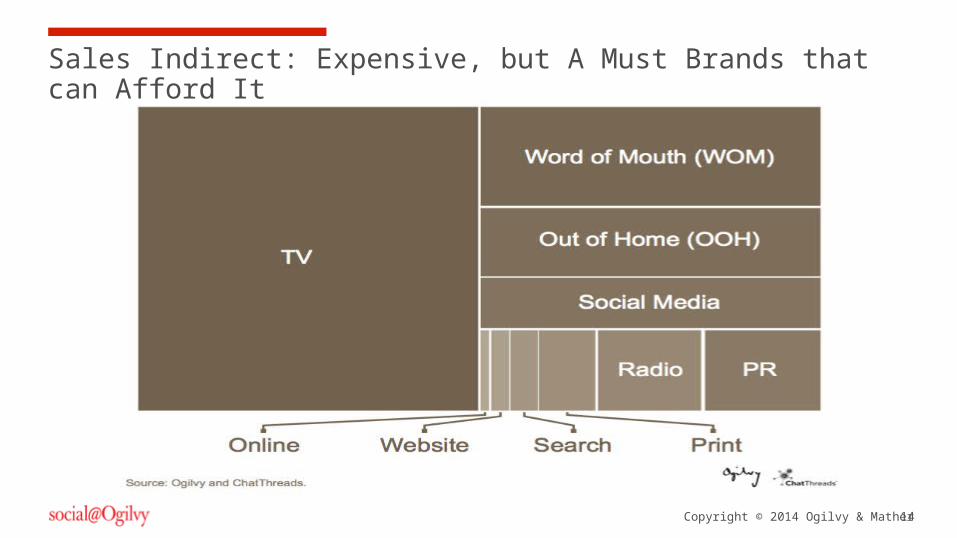
Sales Indirect: Expensive, but A Must Brands that can Afford It
15Copyright © 2014 Ogilvy & Mather
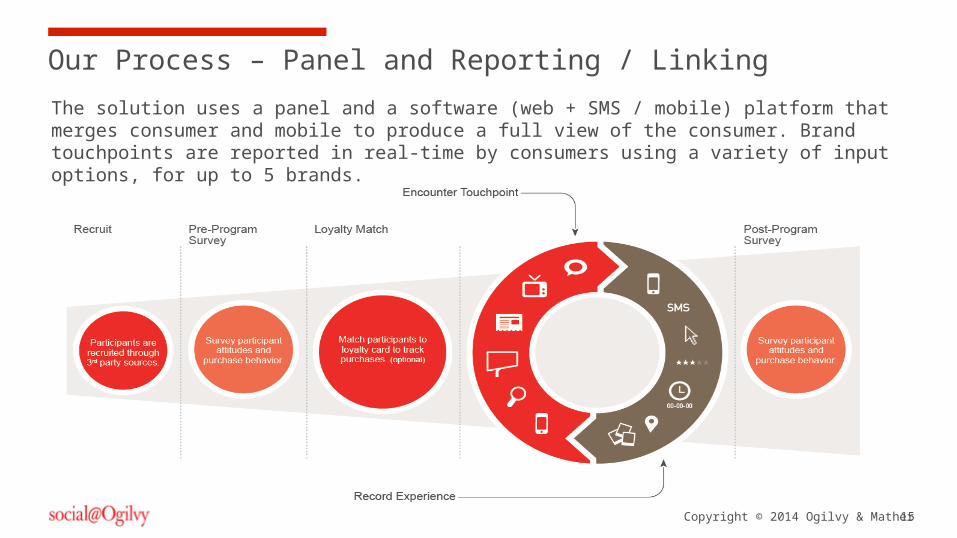
Our Process – Panel and Reporting / Linking
The solution uses a panel and a software (web + SMS / mobile) platform that merges consumer and mobile to produce a full view of the consumer. Brand touchpoints are reported in real-time by consumers using a variety of input options, for up to 5 brands.
16Copyright © 2014 Ogilvy & Mather
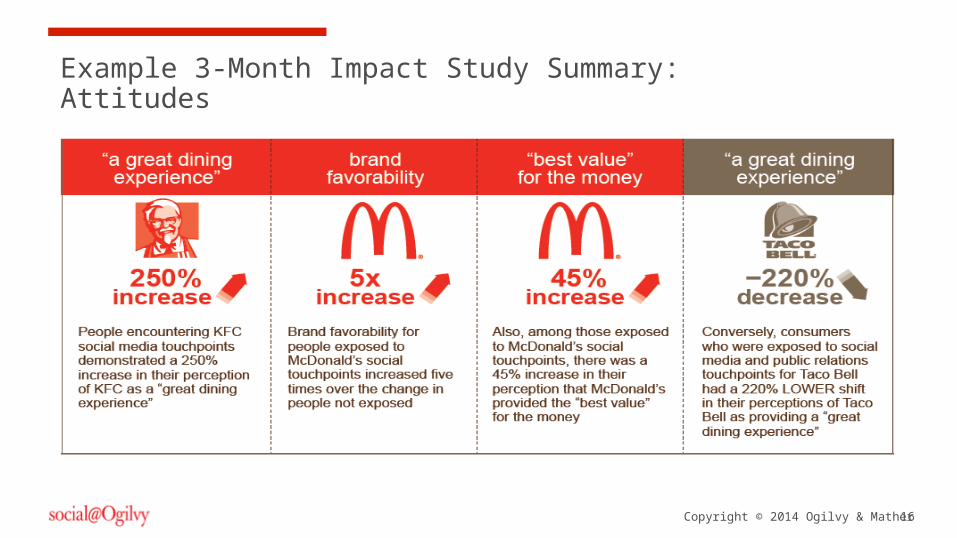
Example 3-Month Impact Study Summary:Attitudes
17Copyright © 2014 Ogilvy & Mather
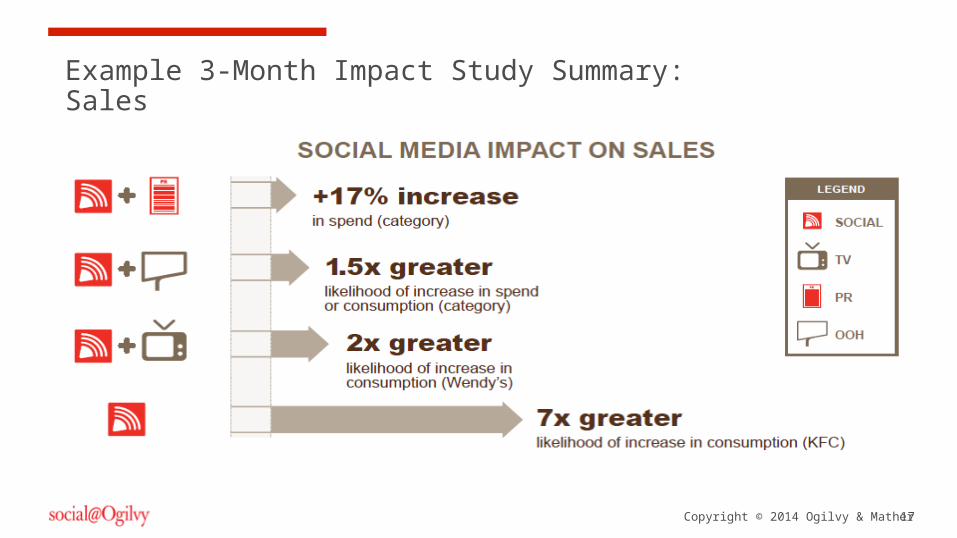
Example 3-Month Impact Study Summary:Sales
Attitudes & AwarenessIdeas and data for showing social changes attitudes
19Copyright © 2014 Ogilvy & Mather
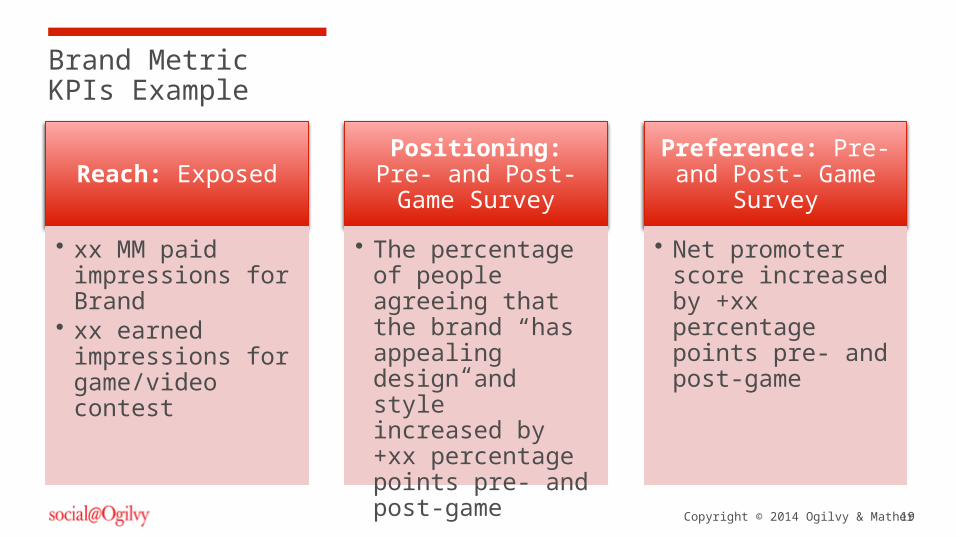
Reach: Exposed
• xx MM paid impressions for Brand
• xx earned impressions for game/video contest
Positioning: Pre- and Post-Game
Survey
• The percentage of people agreeing that the brand “has appealing design and style” increased by +xx percentage points pre- and post-game
Preference: Pre- and Post- Game Survey
• Net promoter score increased by +xx percentage points pre- and post-game
Brand Metric KPIs Example
A New Way to Market (Measure)Making marketing more efficient and effective
21Copyright © 2014 Ogilvy & Mather
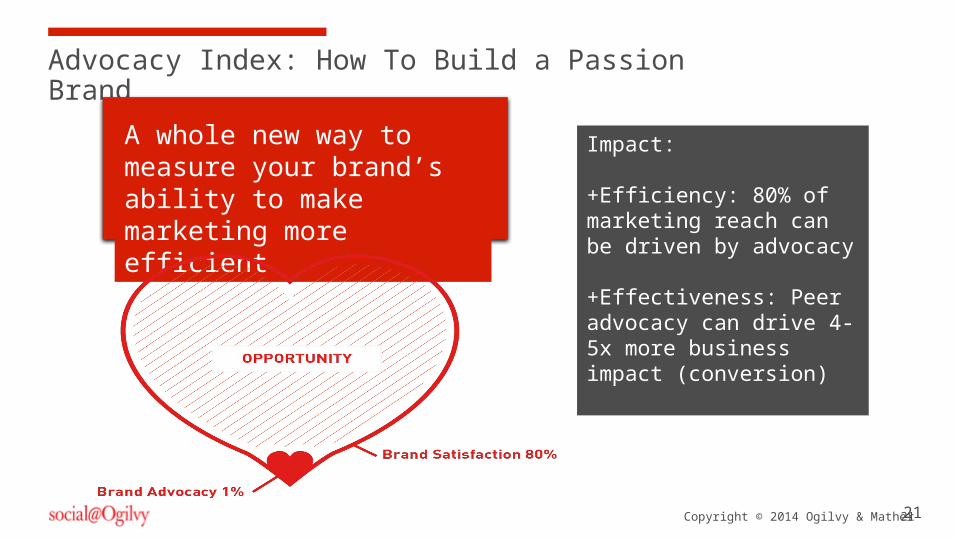
Advocacy Index: How To Build a Passion Brand
21
A whole new way to measure your brand’s ability to make marketing more efficient
Impact:
+Efficiency: 80% of marketing reach can be driven by advocacy
+Effectiveness: Peer advocacy can drive 4-5x more business impact (conversion)
22Copyright © 2014 Ogilvy & Mather
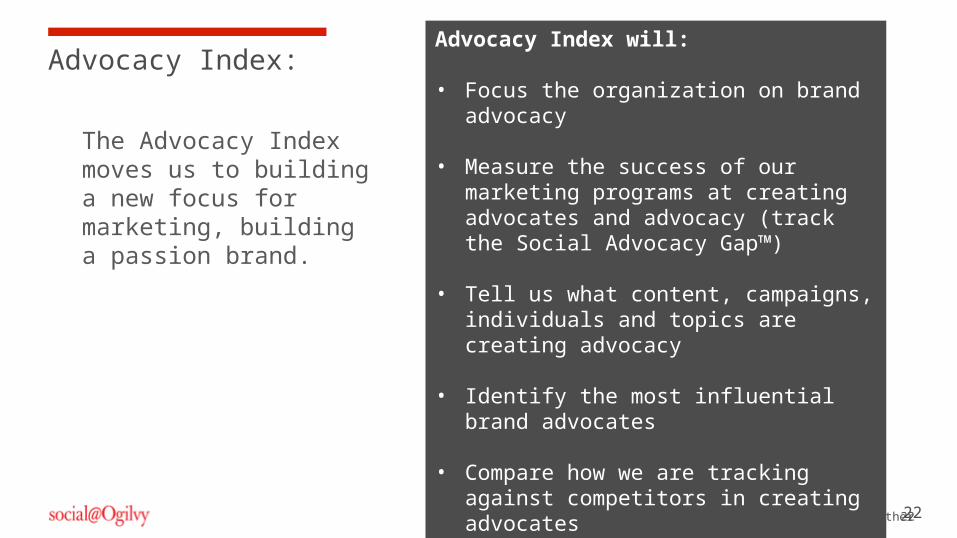
Advocacy Index:
22
The Advocacy Index moves us to building a new focus for marketing, building a passion brand.
Advocacy Index will:
• Focus the organization on brand advocacy
• Measure the success of our marketing programs at creating advocates and advocacy (track the Social Advocacy Gap™)
• Tell us what content, campaigns, individuals and topics are creating advocacy
• Identify the most influential brand advocates
• Compare how we are tracking against competitors in creating advocates
23Copyright © 2014 Ogilvy & Mather
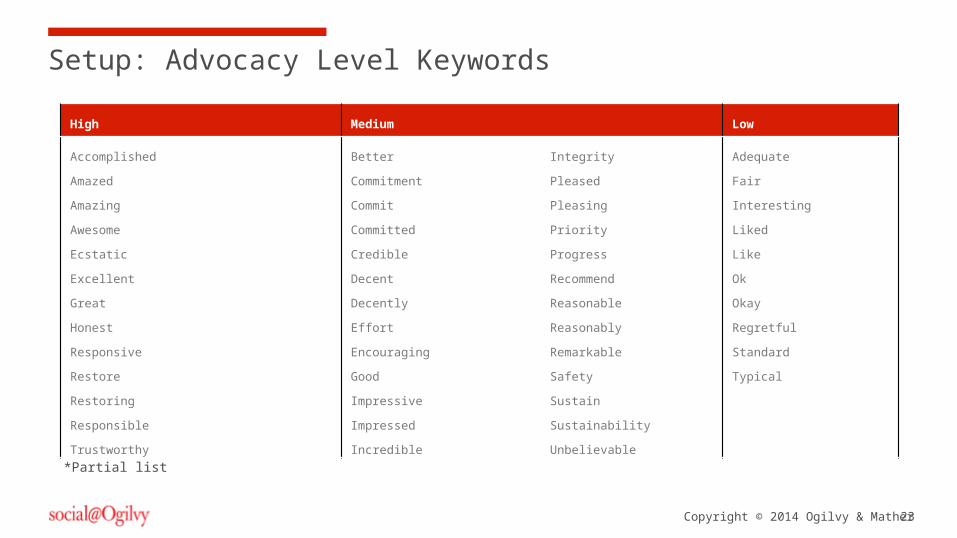
Setup: Advocacy Level Keywords
*Partial list
High Medium Low
Accomplished
Amazed
Amazing
Awesome
Ecstatic
Excellent
Great
Honest
Responsive
Restore
Restoring
Responsible
Trustworthy
Better
Commitment
Commit
Committed
Credible
Decent
Decently
Effort
Encouraging
Good
Impressive
Impressed
Incredible
Integrity
Pleased
Pleasing
Priority
Progress
Recommend
Reasonable
Reasonably
Remarkable
Safety
Sustain
Sustainability
Unbelievable
Adequate
Fair
Interesting
Liked
Like
Ok
Okay
Regretful
Standard
Typical
24Copyright © 2014 Ogilvy & Mather
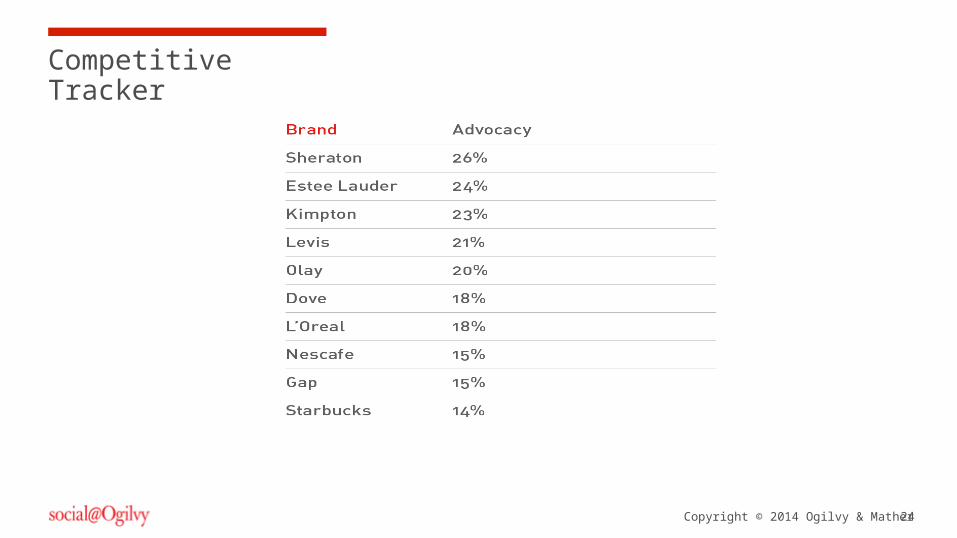
Competitive Tracker
Brand #1
Quality #2
Quality #3
Quality #4

25Copyright © 2014 Ogilvy & Mather
Example: Keyword Analysis
25
Brand Comp 1 Comp 2 Comp 3 Comp 4 Comp 5
26Copyright © 2014 Ogilvy & Mather
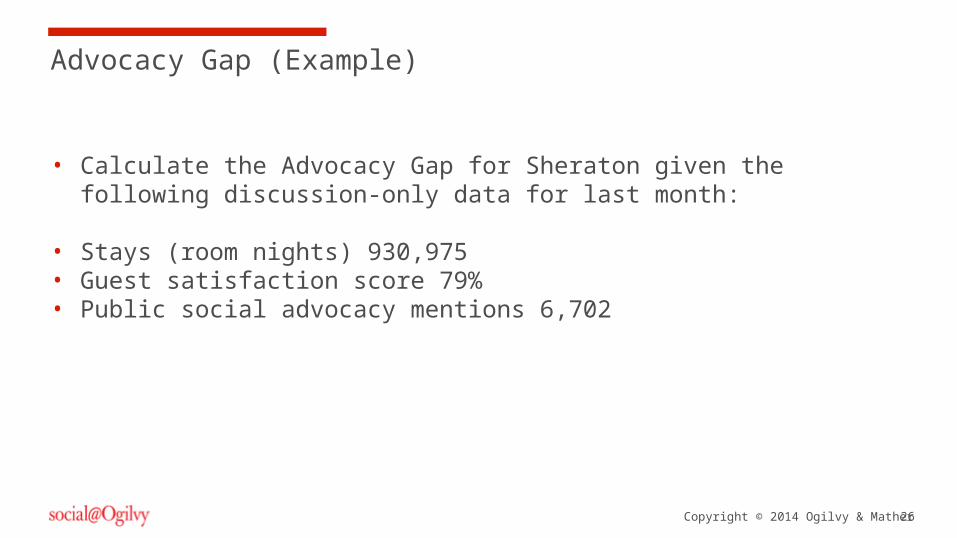
Advocacy Gap (Example)
Brand #1
Quality #2
Quality #3
Quality #4
• Calculate the Advocacy Gap for Sheraton given the following discussion-only data for last month:
• Stays (room nights) 930,975• Guest satisfaction score 79%• Public social advocacy mentions 6,702
What Your ROI-Focused Social Team Should Look LikeComponents and processes for 2014 onward
28Copyright © 2014 Ogilvy & Mather
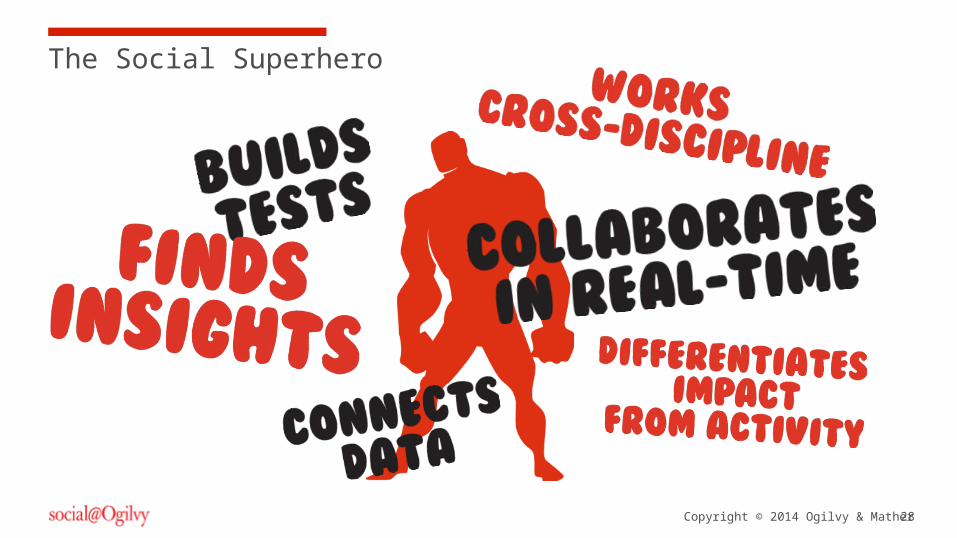
The Social Superhero
29Copyright © 2014 Ogilvy & Mather
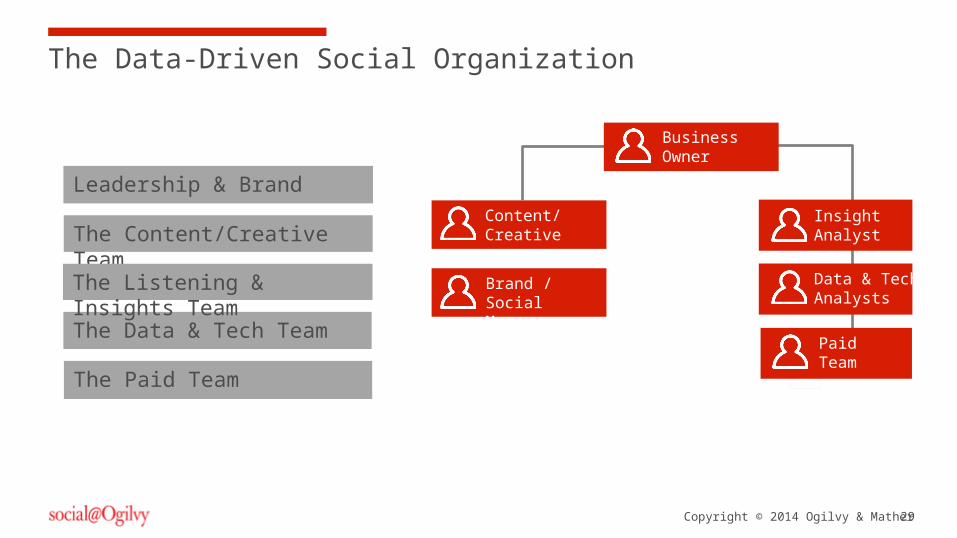
The Data-Driven Social Organization
The Content/Creative Team
The Data & Tech Team
Leadership & Brand Content/Creative
Brand / Social Managers
The Listening & Insights Team
The Paid Team
Business Owner
Insight Analyst
Data & Tech Analysts
Paid Team