Embed Size (px)
Citation preview
K-MEAN CLUSTERBY CHENG ZHAN
HOUSTON MACHINE LEARNING MEETUP
1/7/2017
INTRODUCTION
• K-means (MacQueen, 1967) is one of the simplest unsupervised learning algorithms that solve the well known clustering problem.
• The main idea is to define k centroids, one for each cluster.
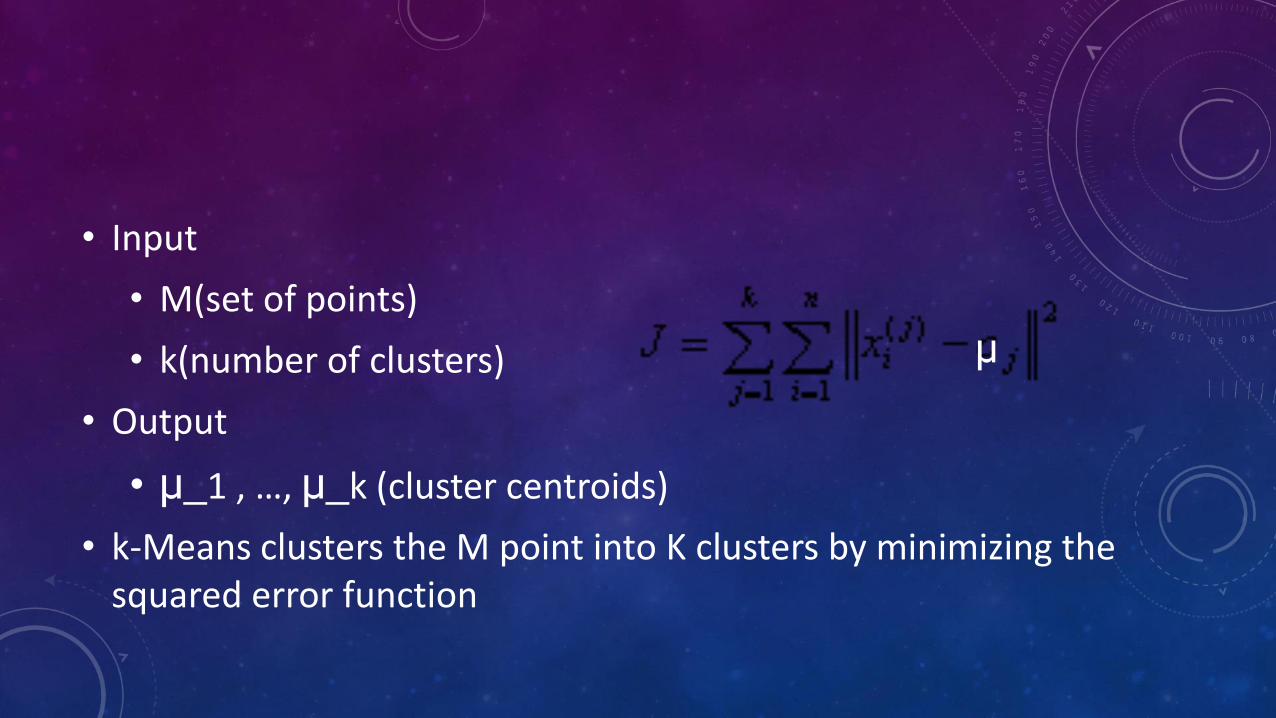
• Input
• M(set of points)
• k(number of clusters)
• Output
• μ_1 , …, μ_k (cluster centroids)
• k-Means clusters the M point into K clusters by minimizing the squared error function
μ
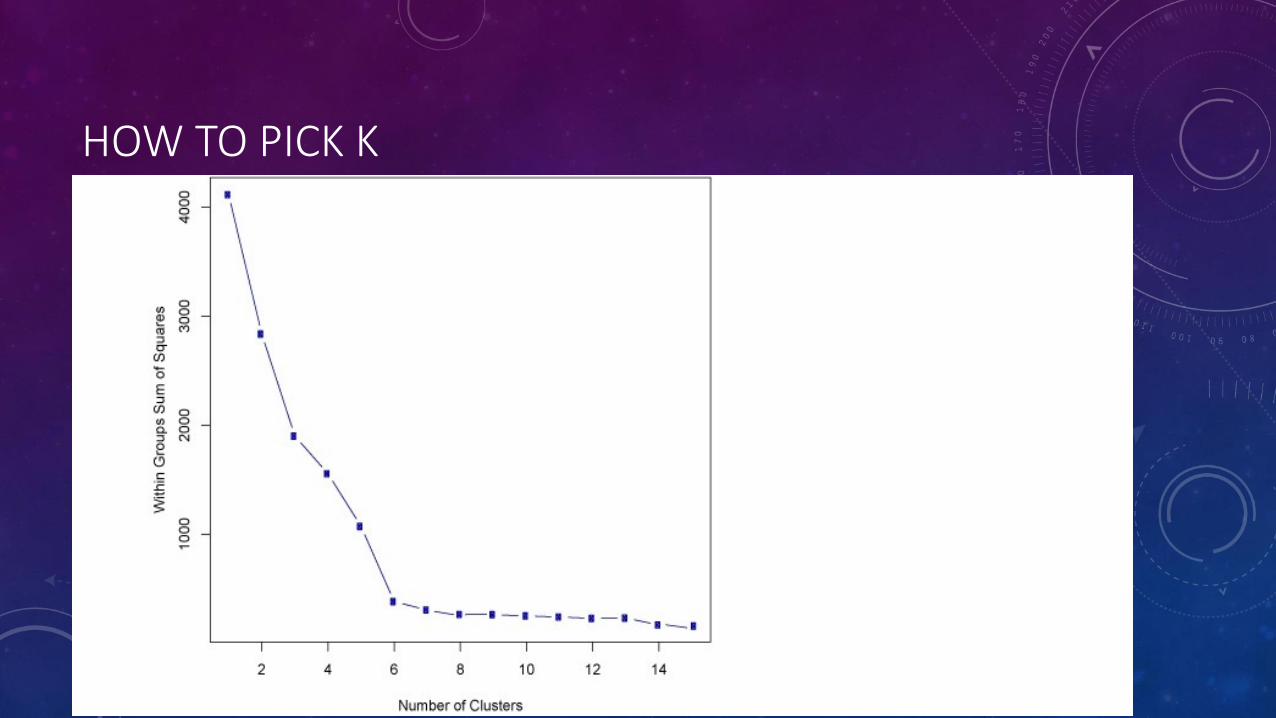
HOW TO PICK K
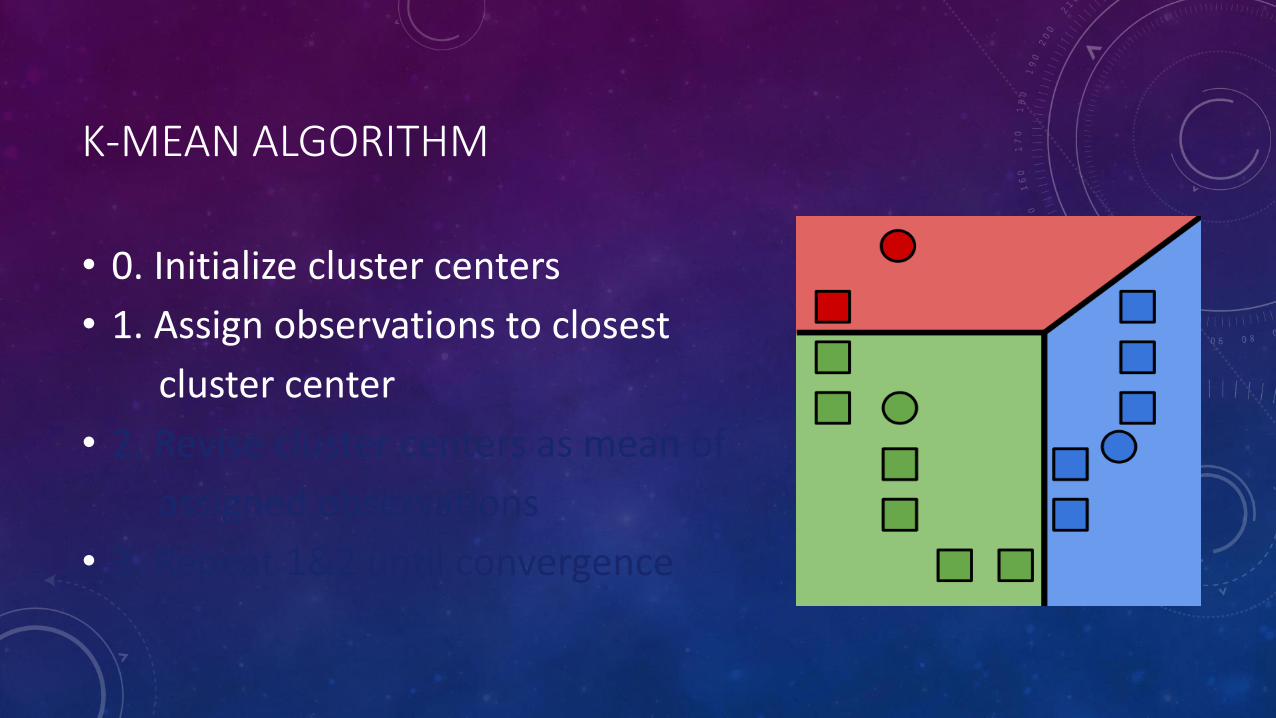
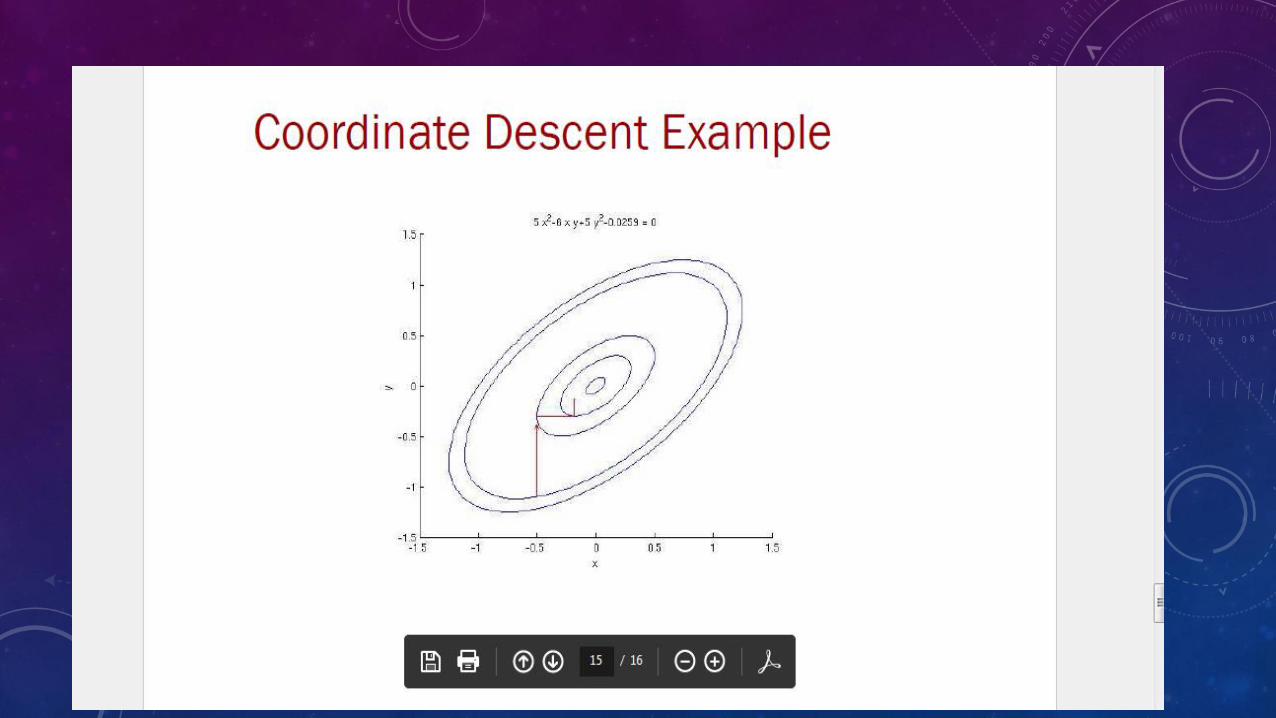
K-MEAN ALGORITHM
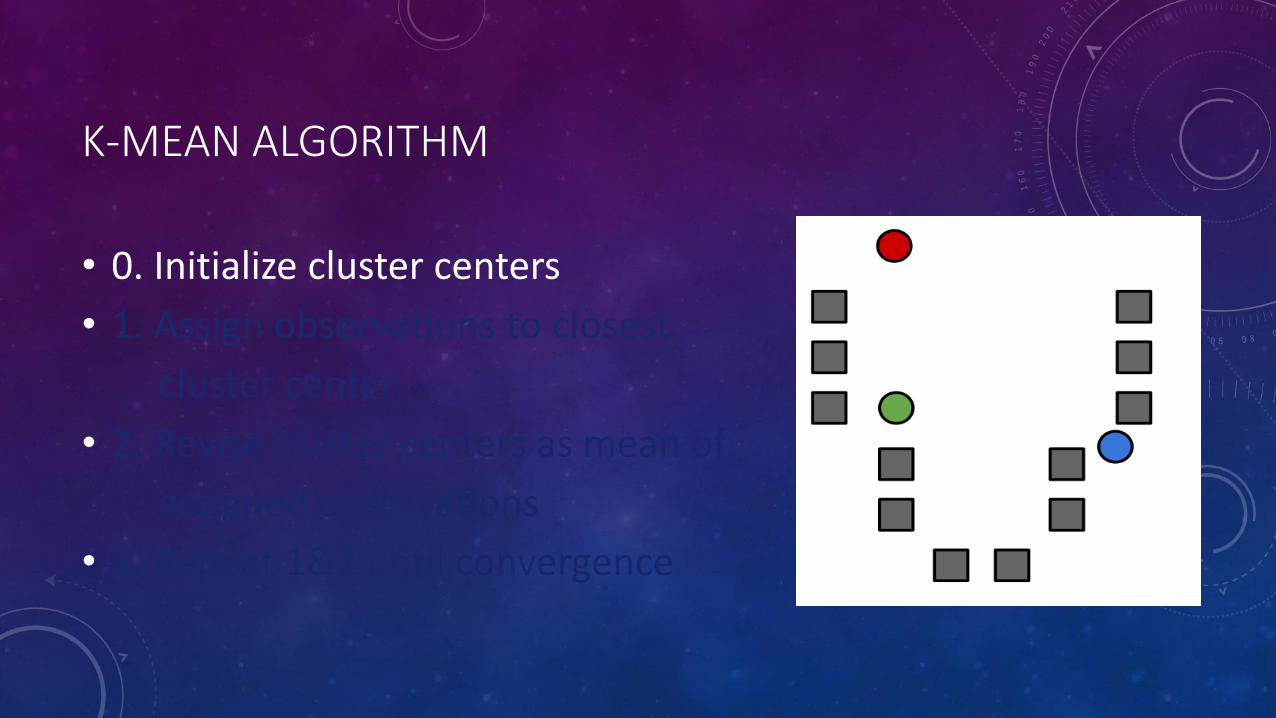
• 0. Initialize cluster centers
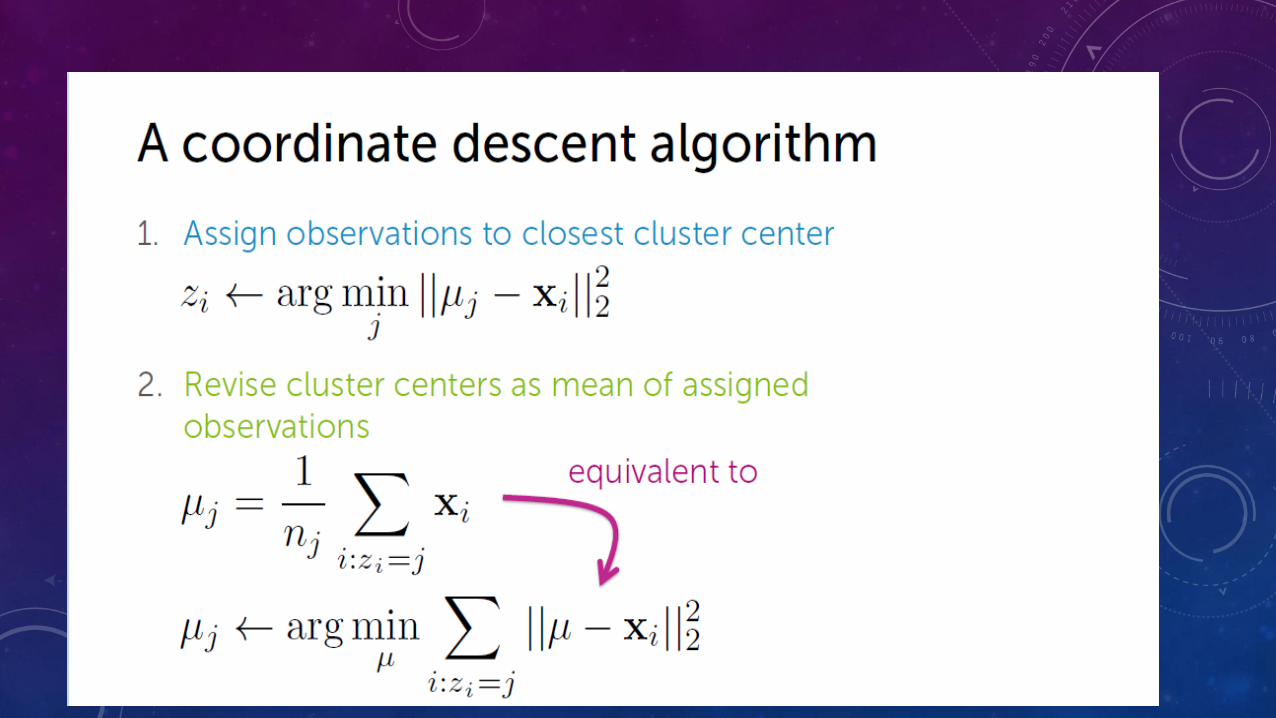
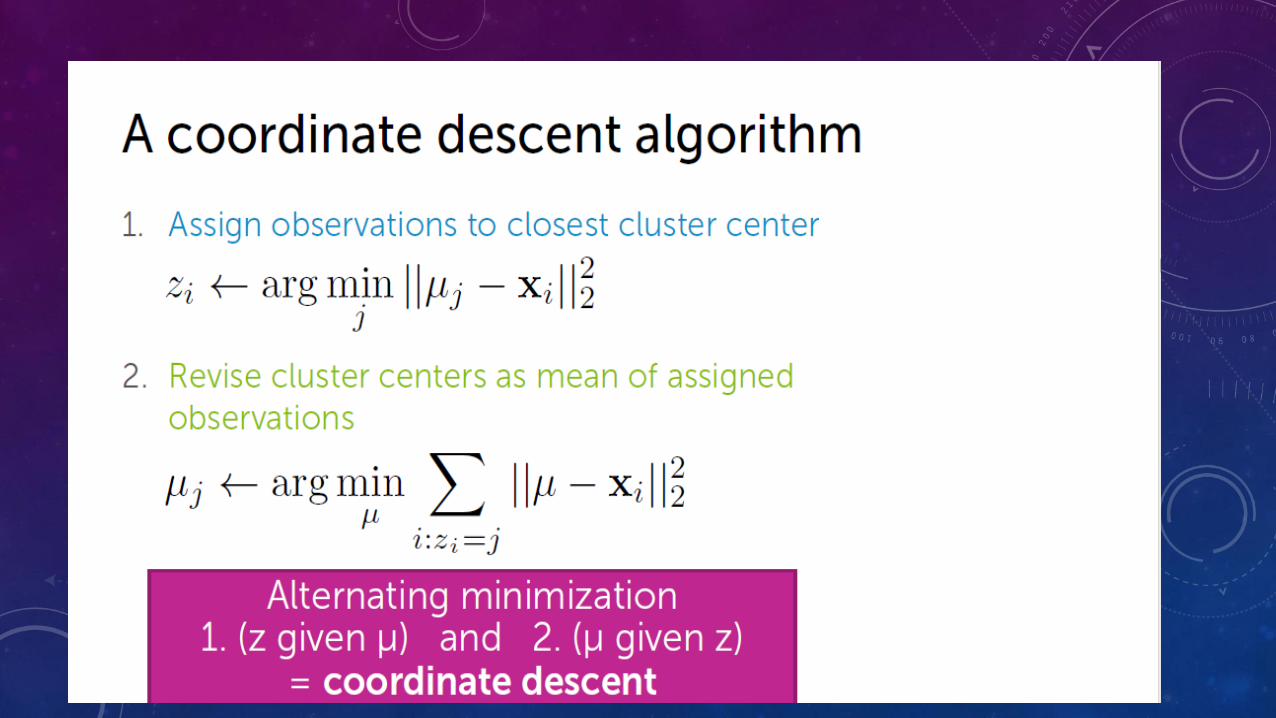
• 1. Assign observations to closest
cluster center
• 2. Revise cluster centers as mean of
assigned observations
• 3. Repeat 1&2 until convergence
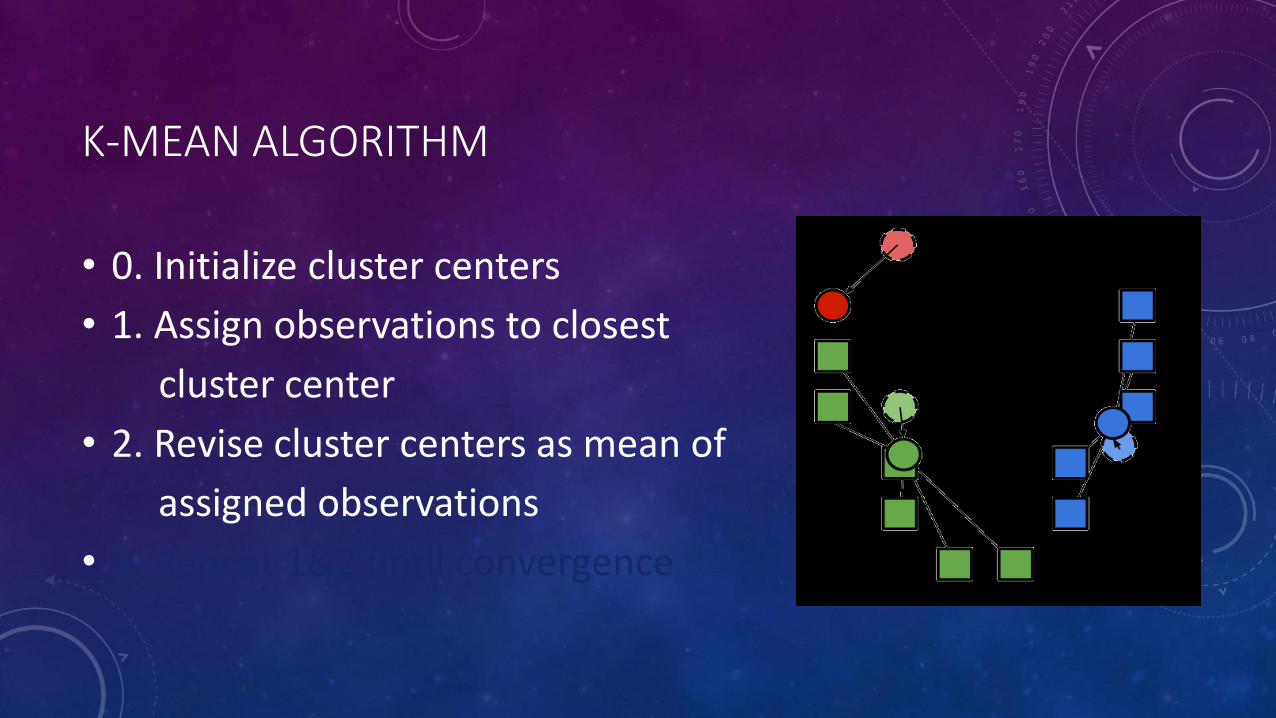
K-MEAN ALGORITHM
• 0. Initialize cluster centers
• 1. Assign observations to closest
cluster center
• 2. Revise cluster centers as mean of
assigned observations
• 3. Repeat 1&2 until convergence
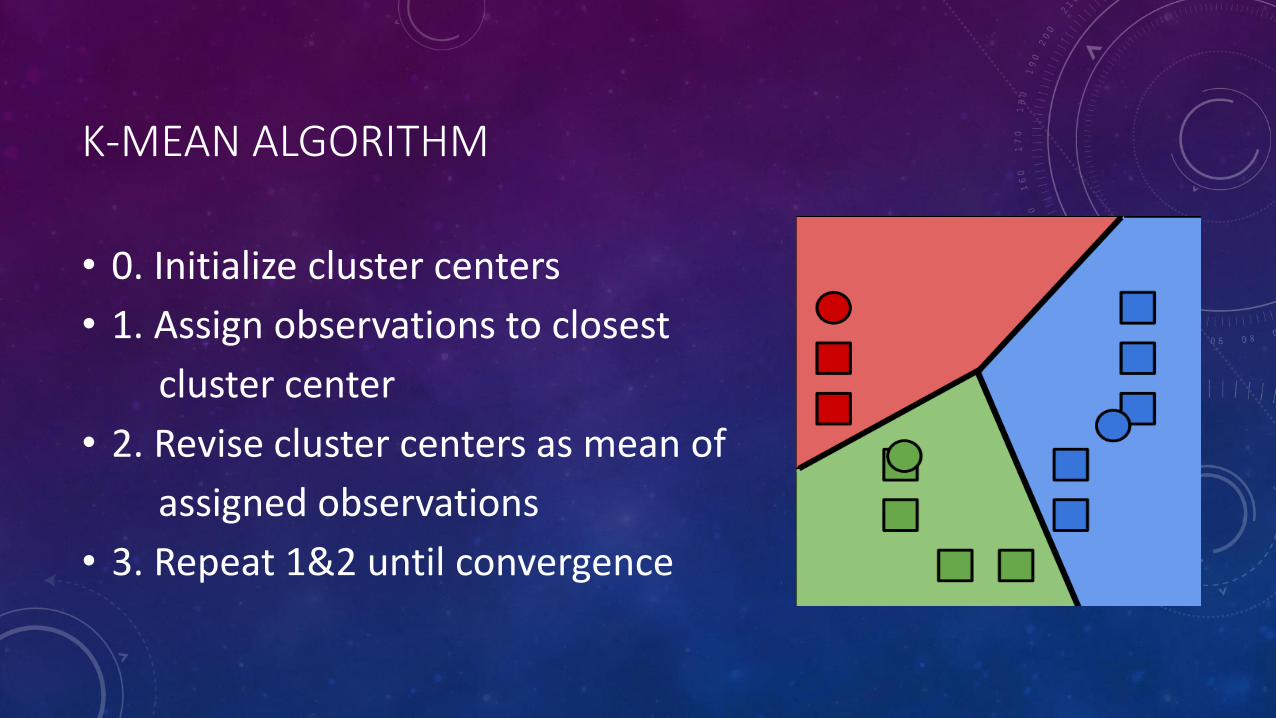
K-MEAN ALGORITHM
• 0. Initialize cluster centers
• 1. Assign observations to closest
cluster center
• 2. Revise cluster centers as mean of
assigned observations
• 3. Repeat 1&2 until convergence
K-MEAN ALGORITHM
• 0. Initialize cluster centers
• 1. Assign observations to closest
cluster center
• 2. Revise cluster centers as mean of
assigned observations
• 3. Repeat 1&2 until convergence
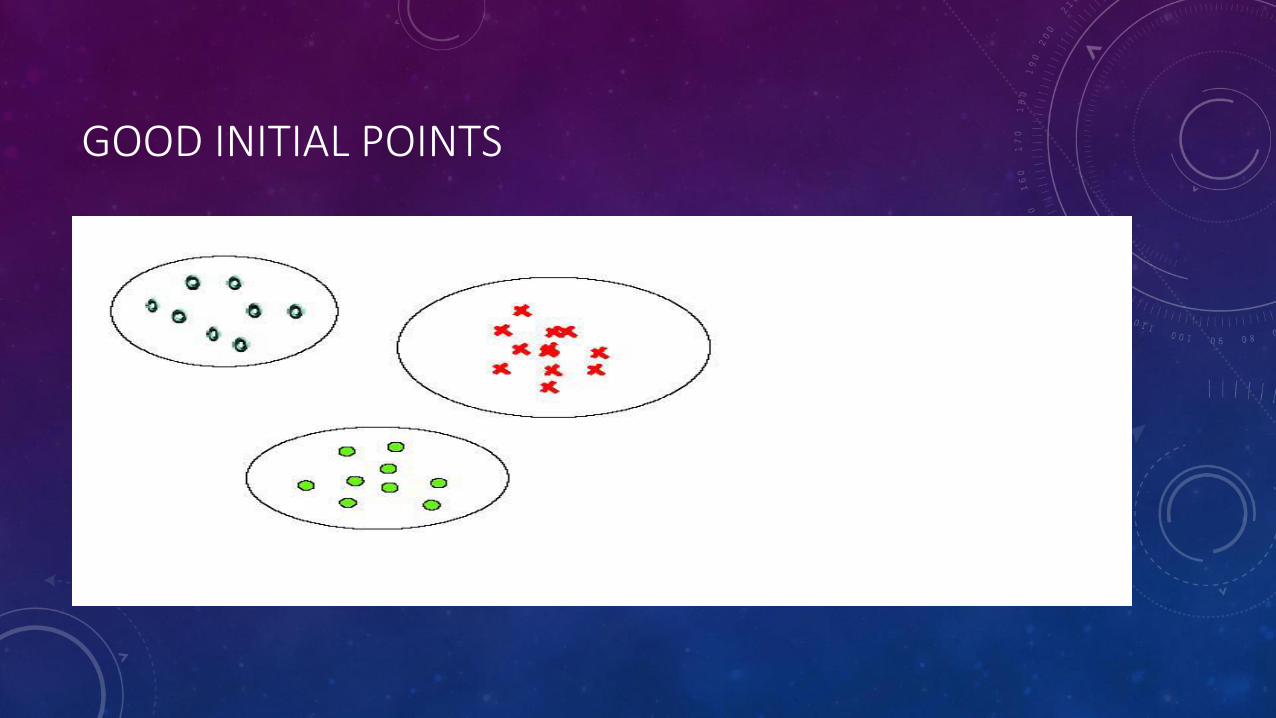
GOOD INITIAL POINTS
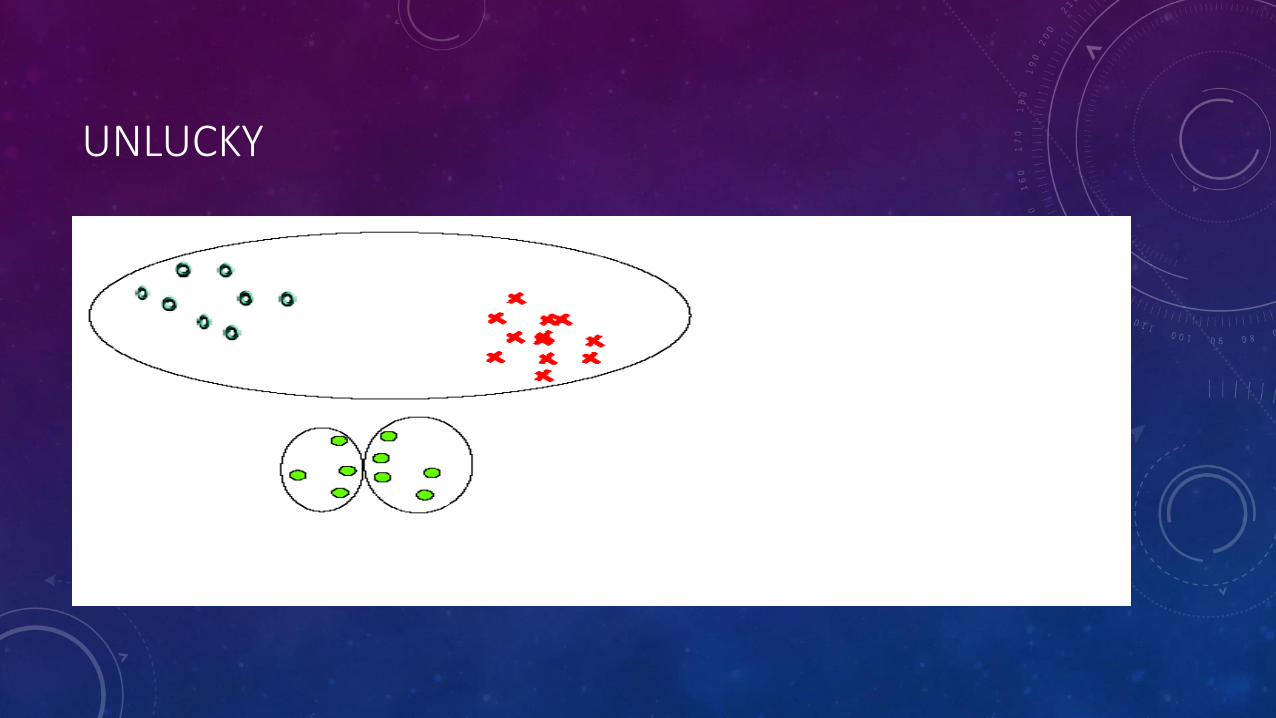
UNLUCKY
K-MEANS IN PRACTICE
• How to choose initial centroids
• select randomly among the data points
• generate completely randomly
• How to choose k
• study the data
• run k-Means for different k (measure squared error for each k)
• Run k-means many times!
• Get many choices of initial points
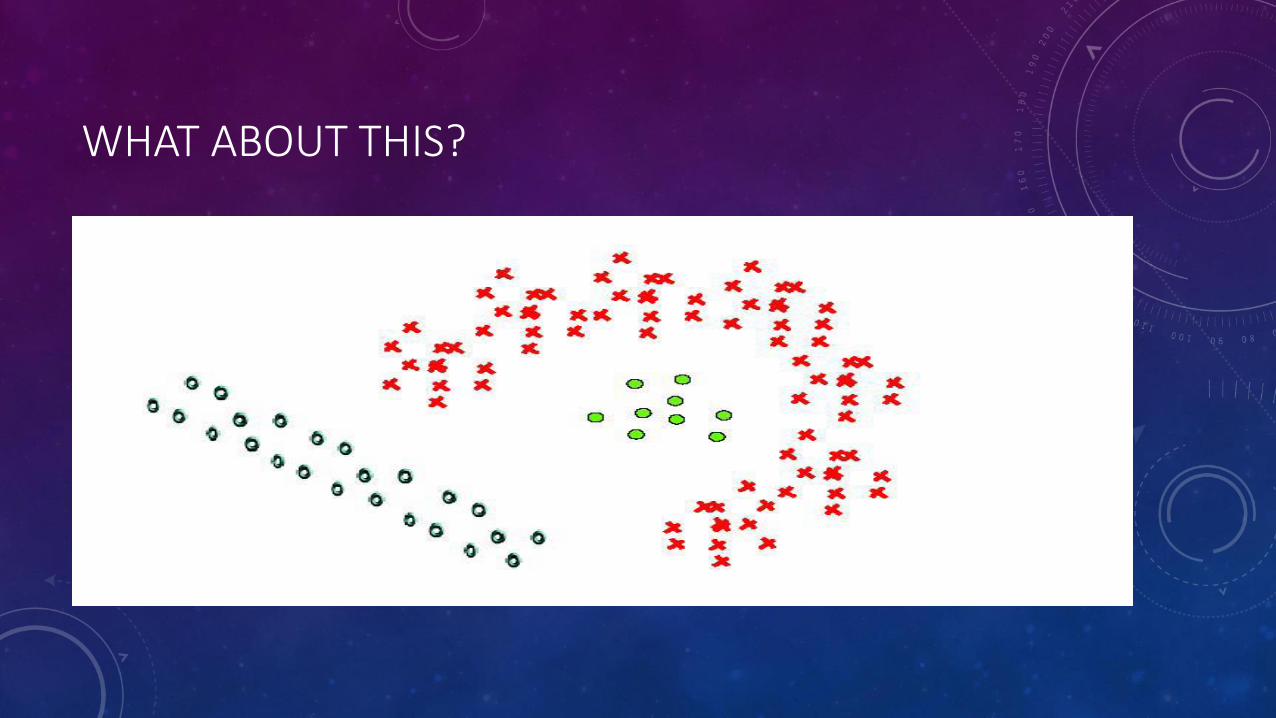
WHAT ABOUT THIS?
QUESTIONS
• Euclidean distance results in spherical clusters
• What cluster shape does the Manhattan distance give?
• Think of other distance measures. What cluster shapes will those yield?
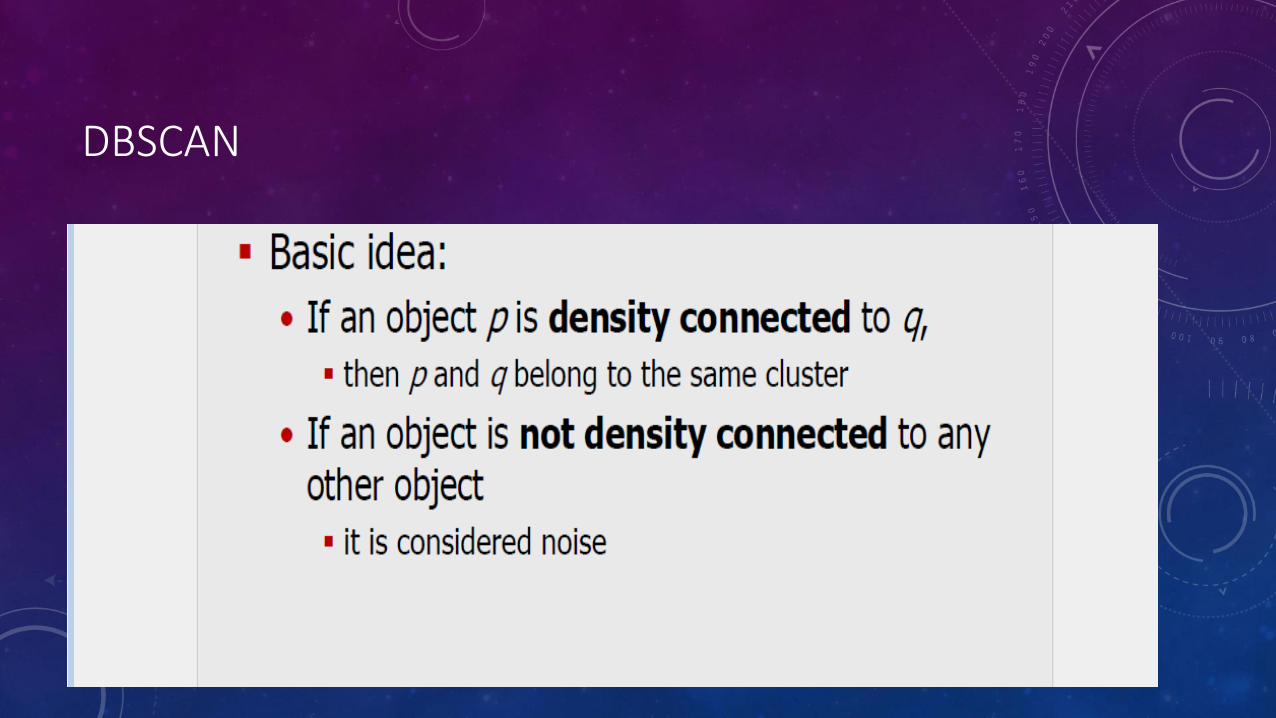
DBSCAN
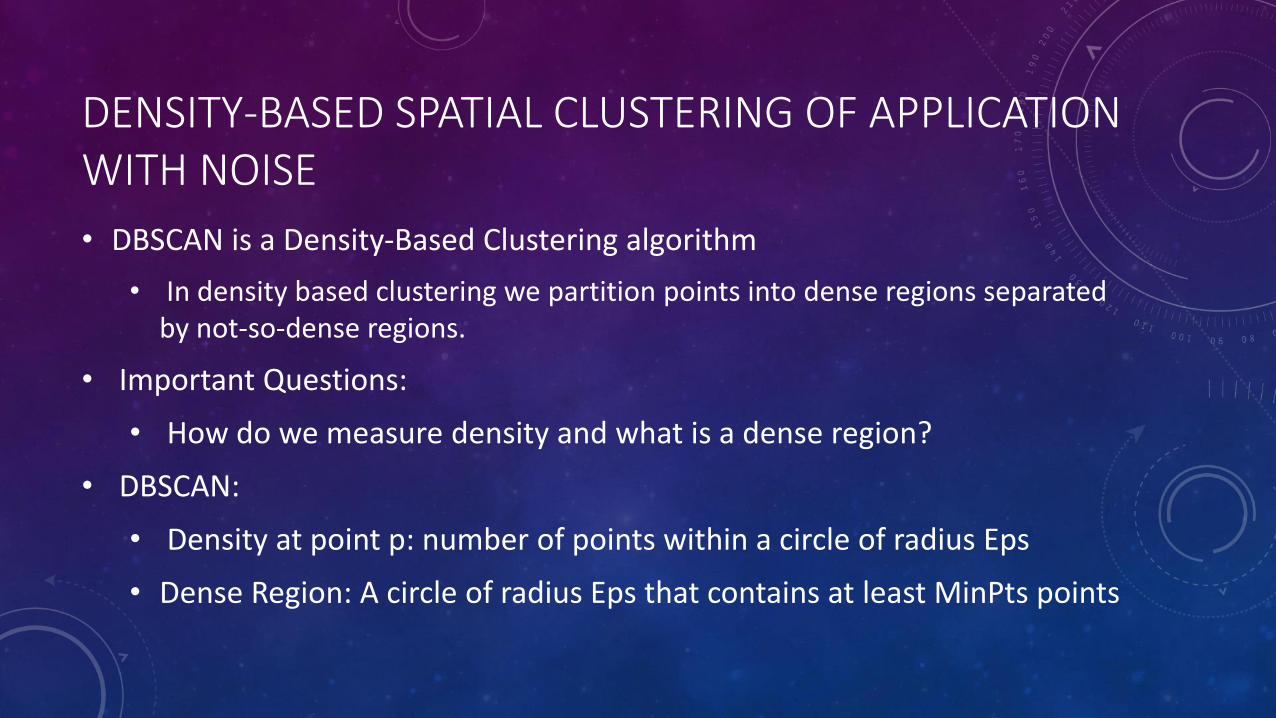
DENSITY-BASED SPATIAL CLUSTERING OF APPLICATIONWITH NOISE
• DBSCAN is a Density-Based Clustering algorithm
• In density based clustering we partition points into dense regions separated by not-so-dense regions.
• Important Questions:
• How do we measure density and what is a dense region?
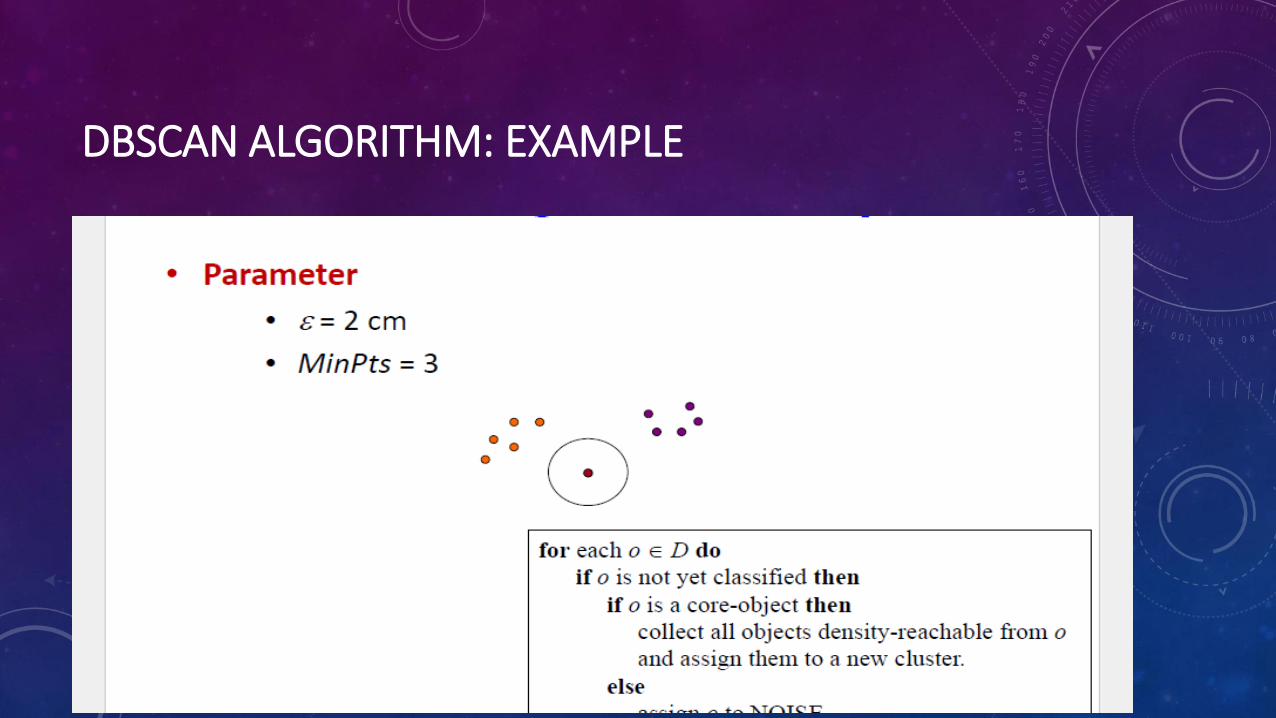
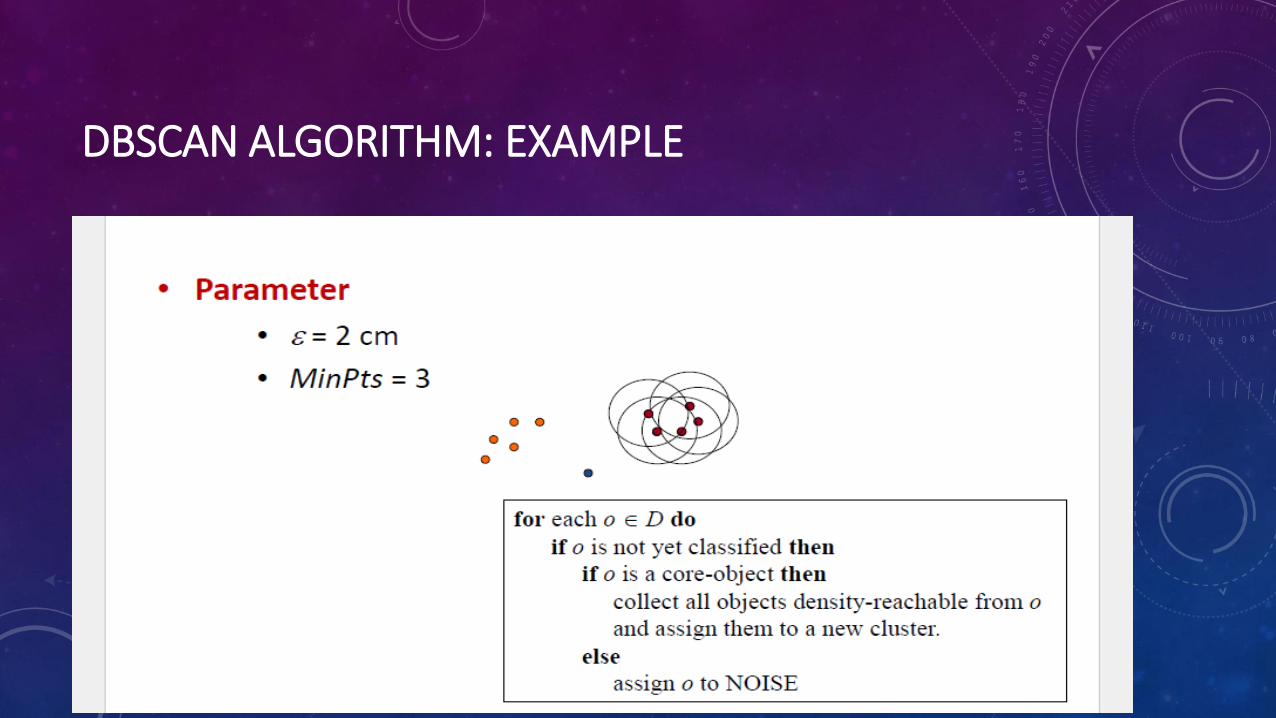
• DBSCAN:
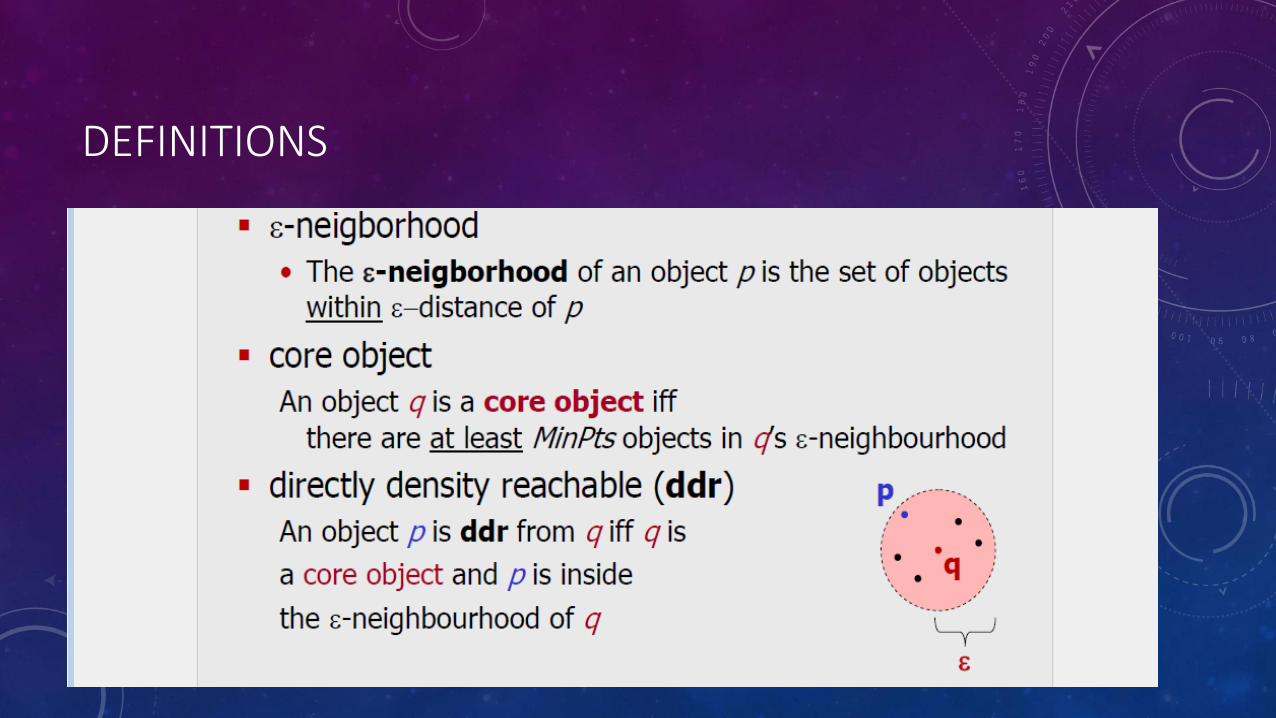
• Density at point p: number of points within a circle of radius Eps
• Dense Region: A circle of radius Eps that contains at least MinPts points
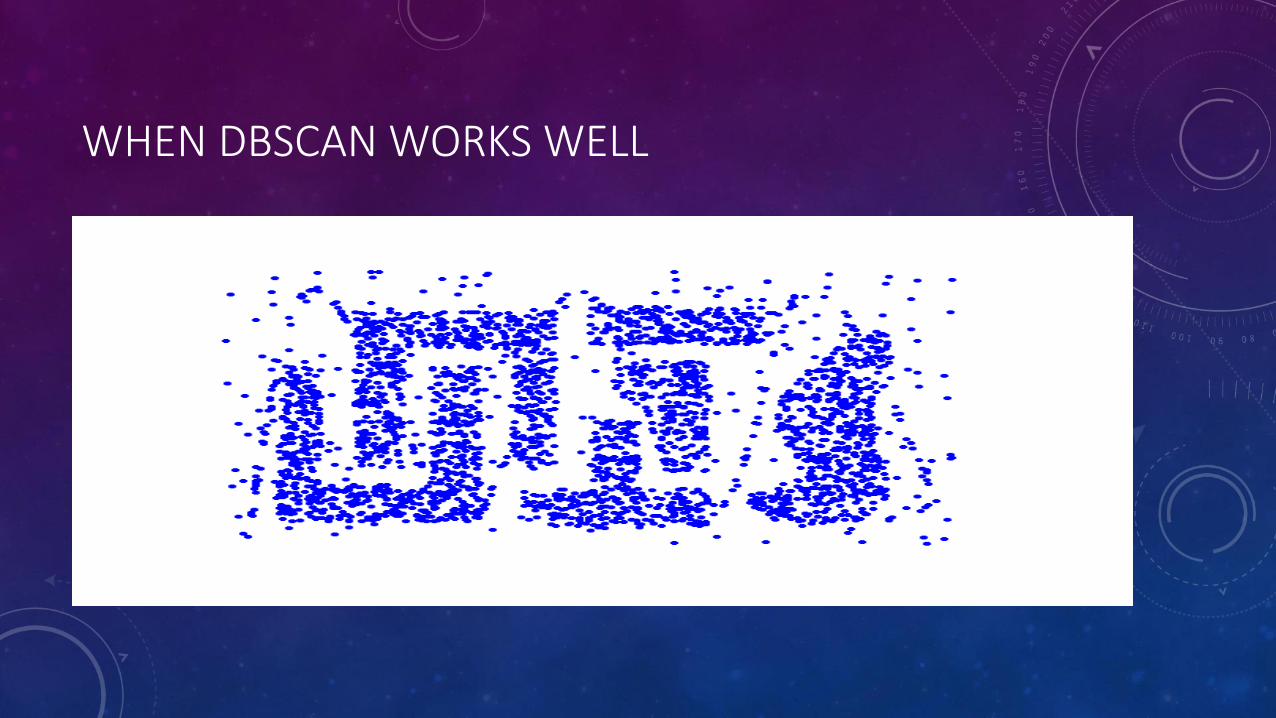
WHEN DBSCAN WORKS WELL
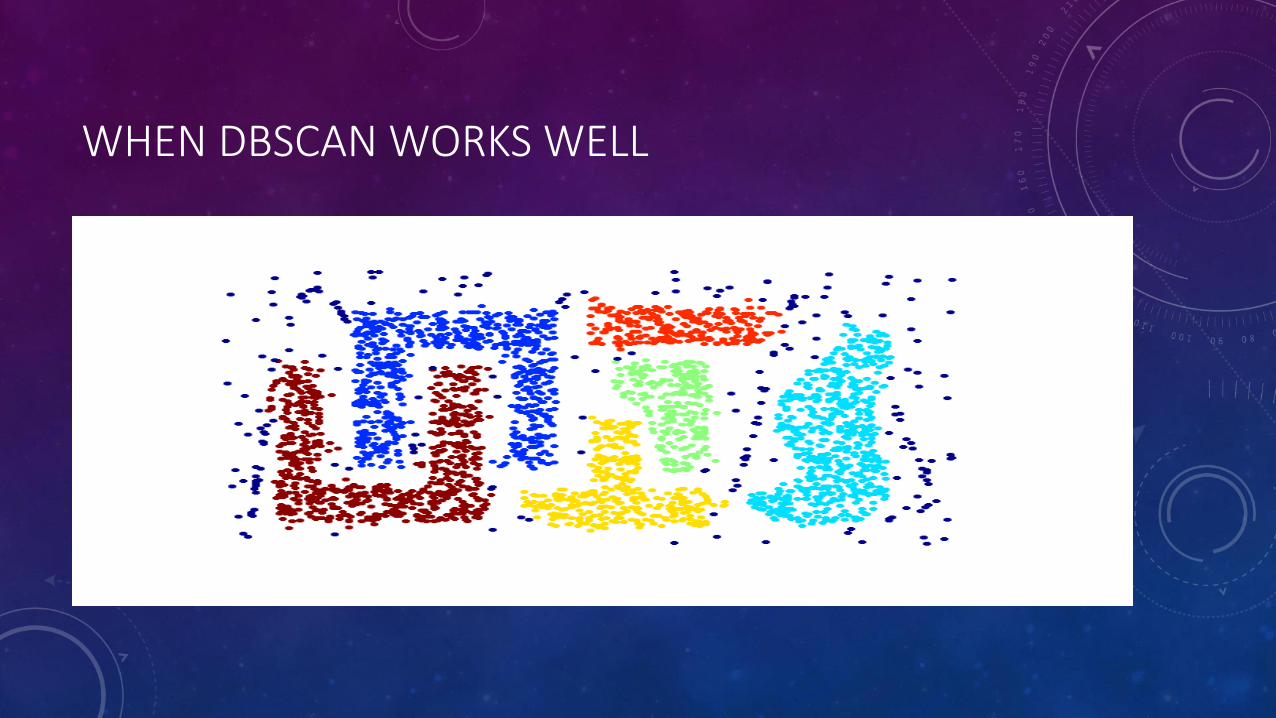
WHEN DBSCAN WORKS WELL
DBSCAN
DEFINITIONS
REACHABILITY AND CONNECTIVITY
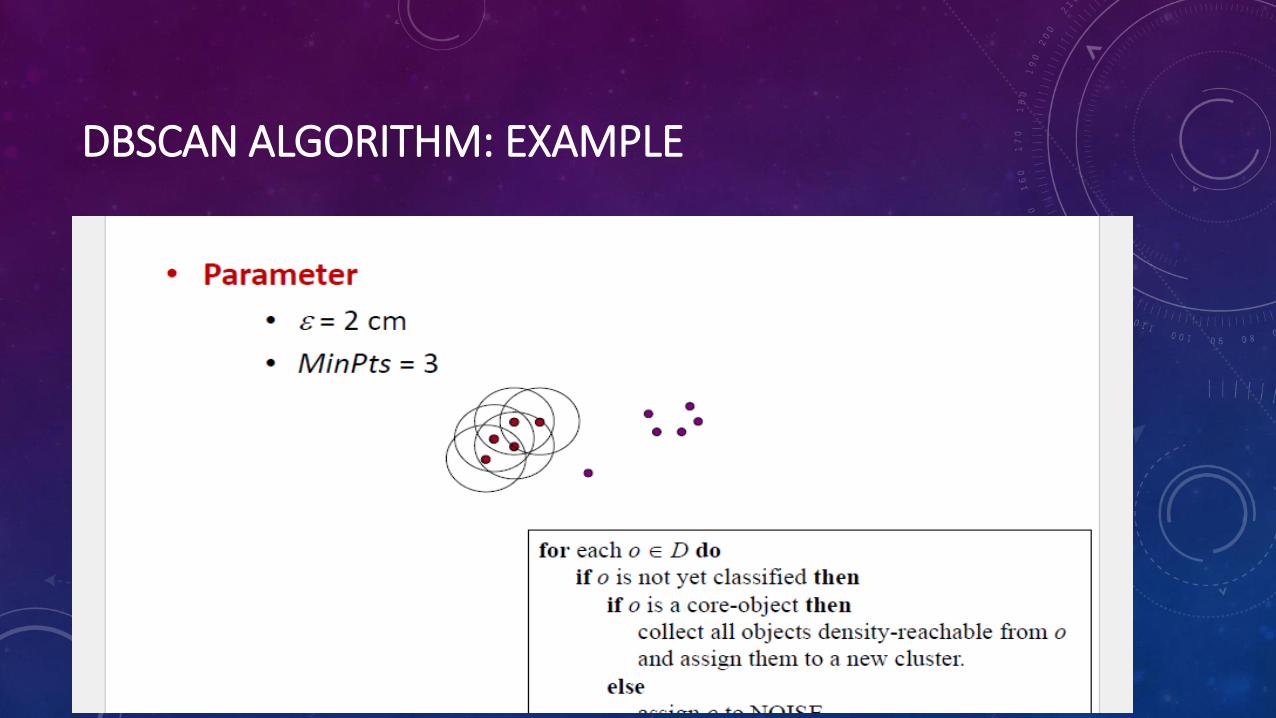
DBSCAN ALGORITHM: EXAMPLE
DBSCAN ALGORITHM: EXAMPLE
DBSCAN ALGORITHM: EXAMPLE
DETERMINING EPS & MINPTS
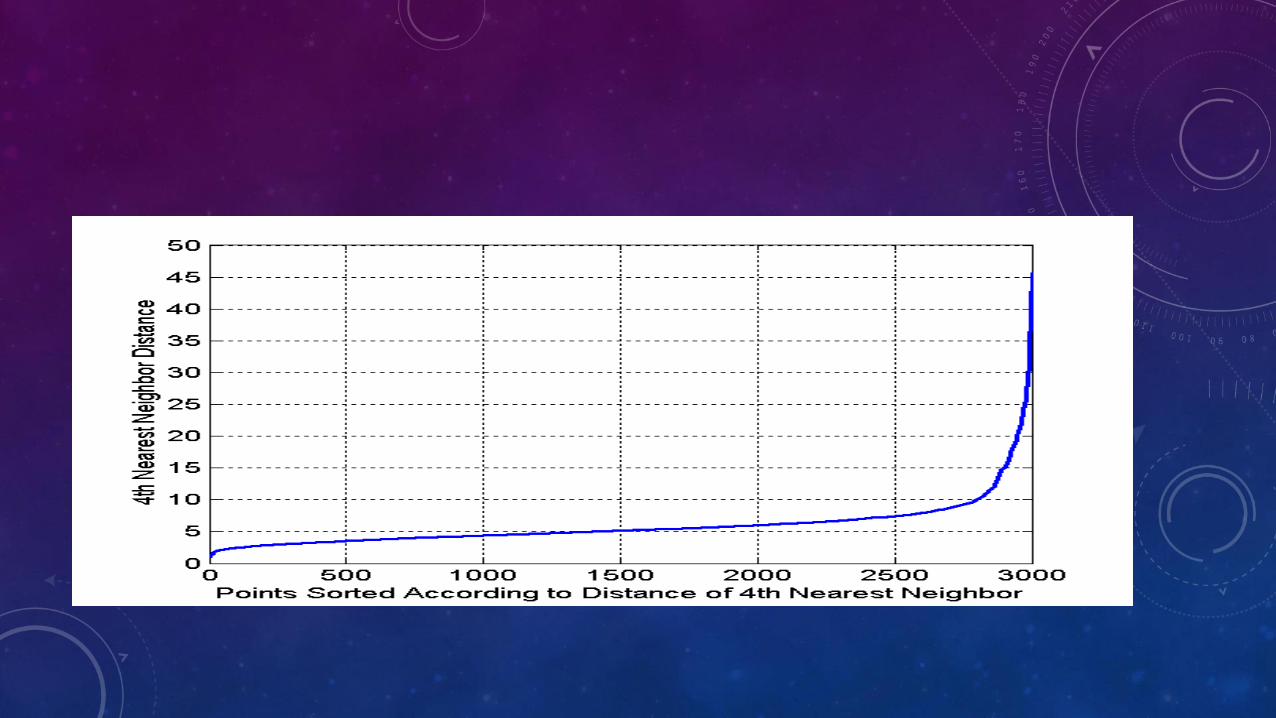
• Idea is that for points in a cluster, their kth nearest neighbors are at roughly the same distance
• Noise points have the kth nearest neighbor at farther distance
• So, plot sorted distance of every point to its kth nearest neighbor
• Find the distance d where there is a “knee” in the curve
• Eps = d, MinPts = k
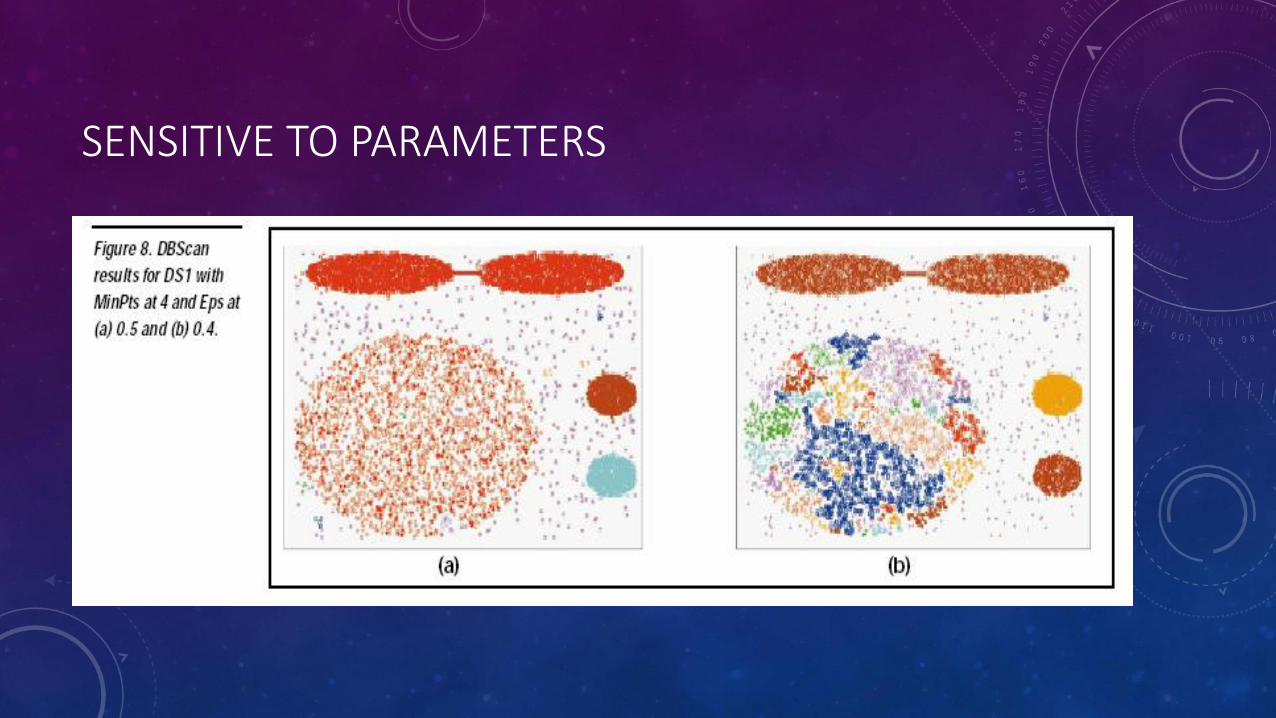
SENSITIVE TO PARAMETERS
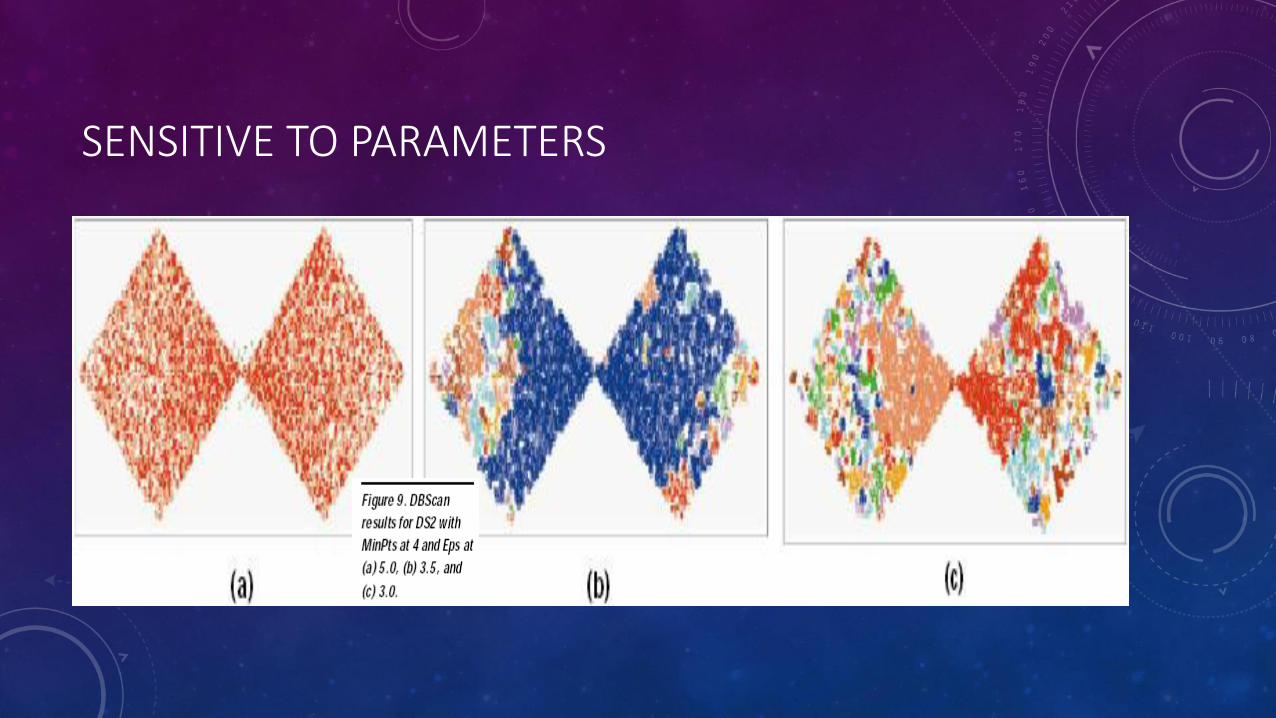
SENSITIVE TO PARAMETERS

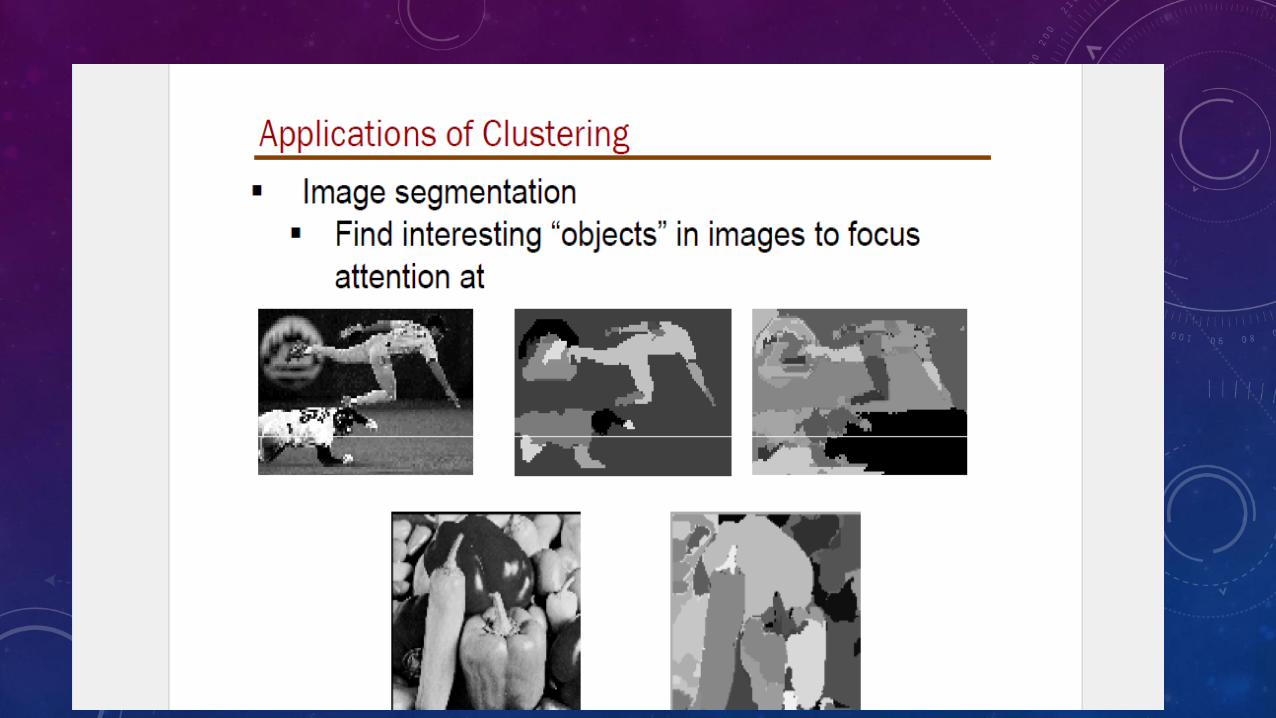
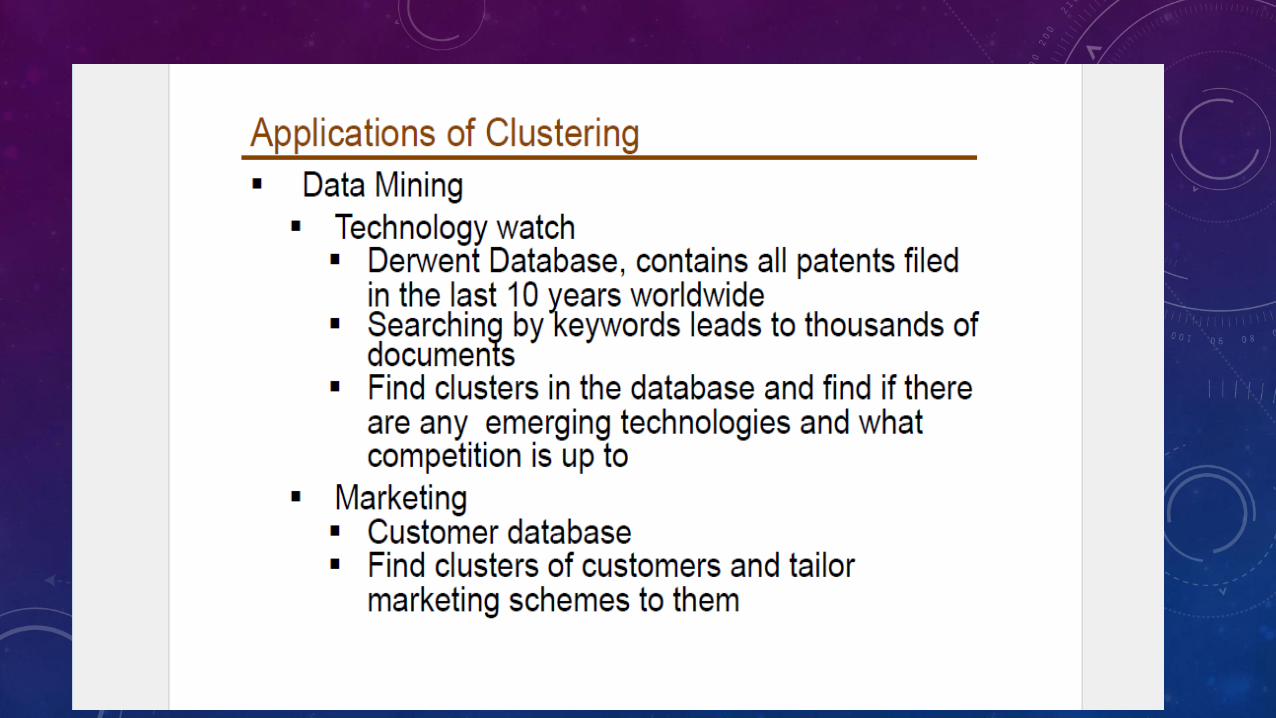
APPLICATIONS
DISTANCE METRIC FOR DOCUMENTS
• Motivations
• Identical – easy
• Modified or related (Ex: DNA, Plagiarism, Authorship)
• Did Francis Bacon write Shakespeare’s plays

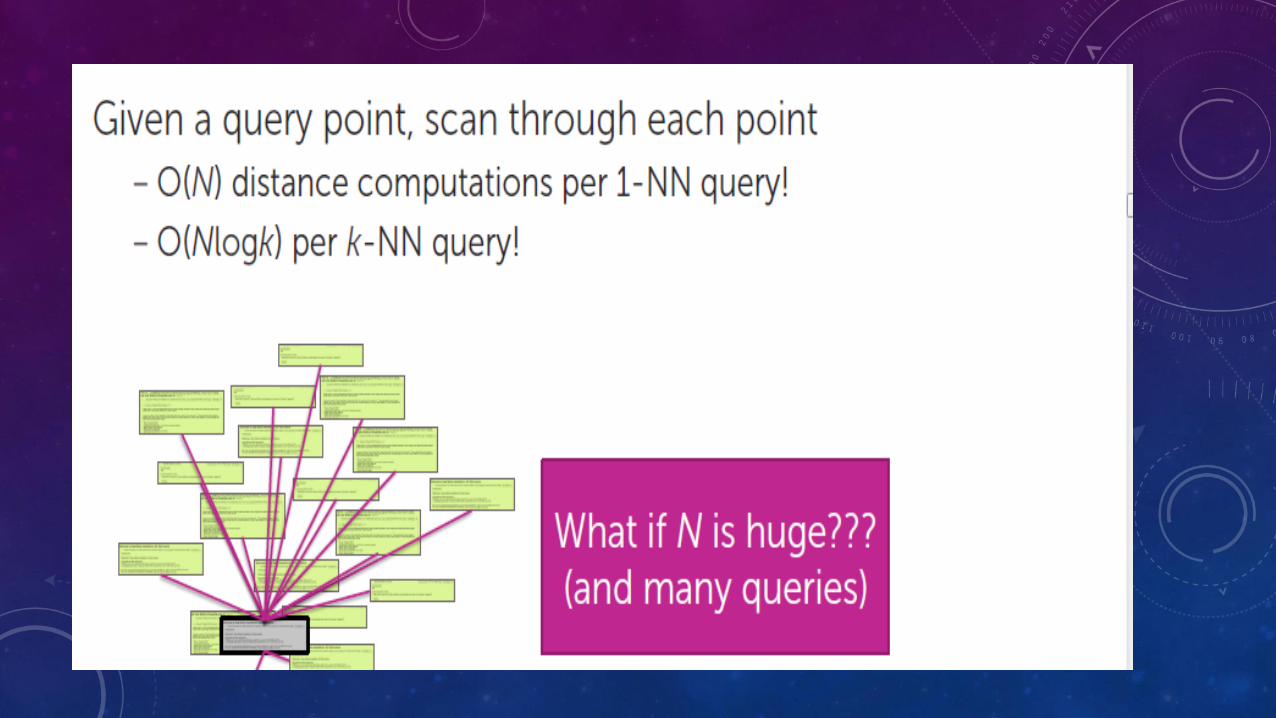
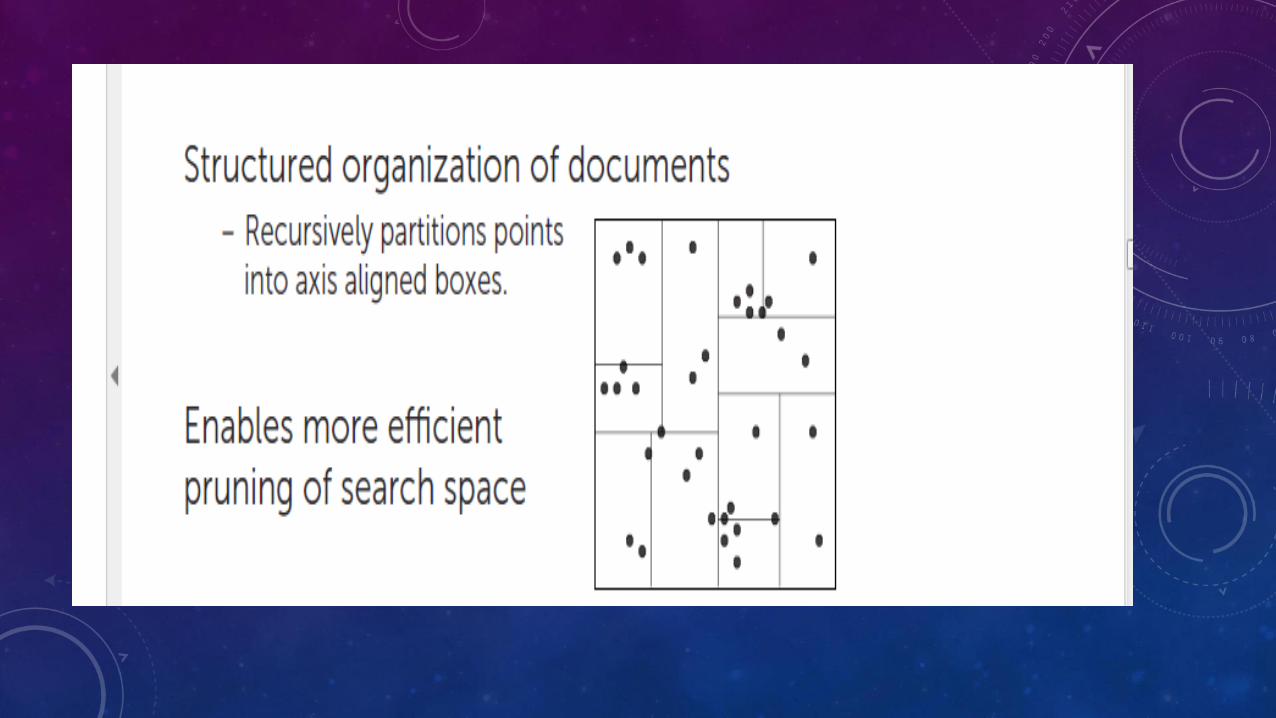
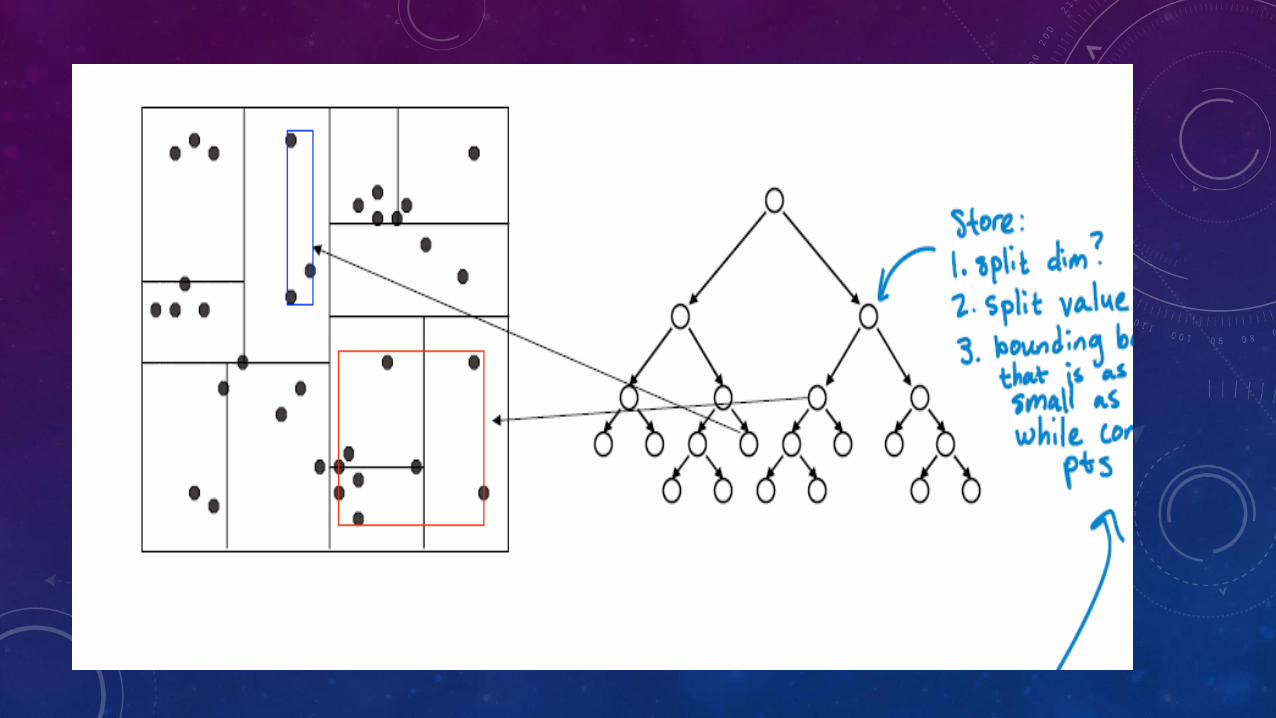
DOCUMENT RETRIEVAL
CHALLENGES
• How do we measure similarity
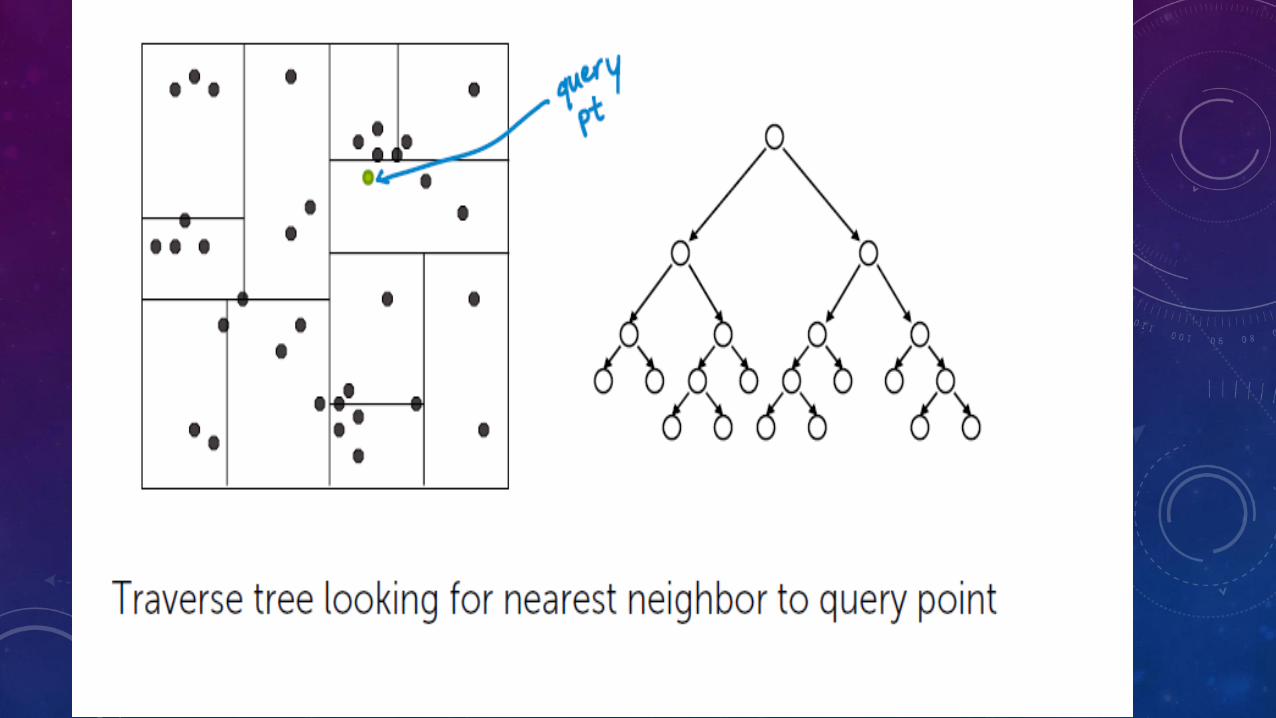
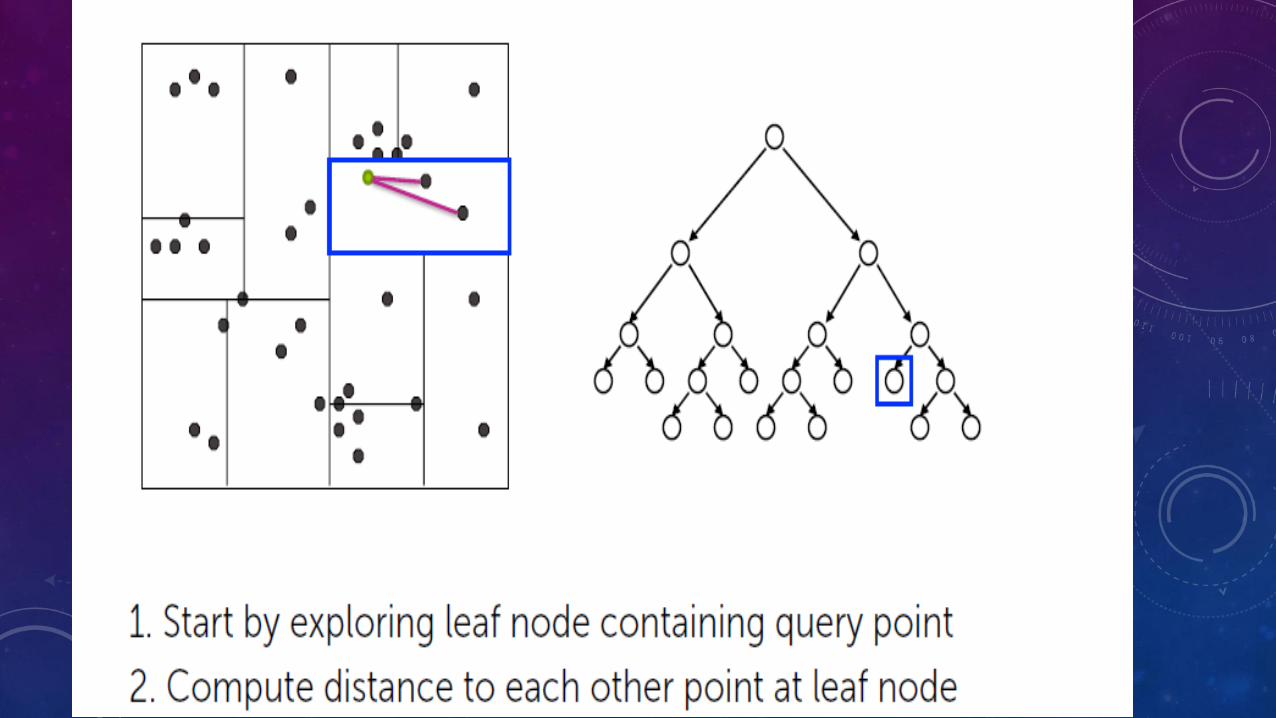
• How do we search over articles
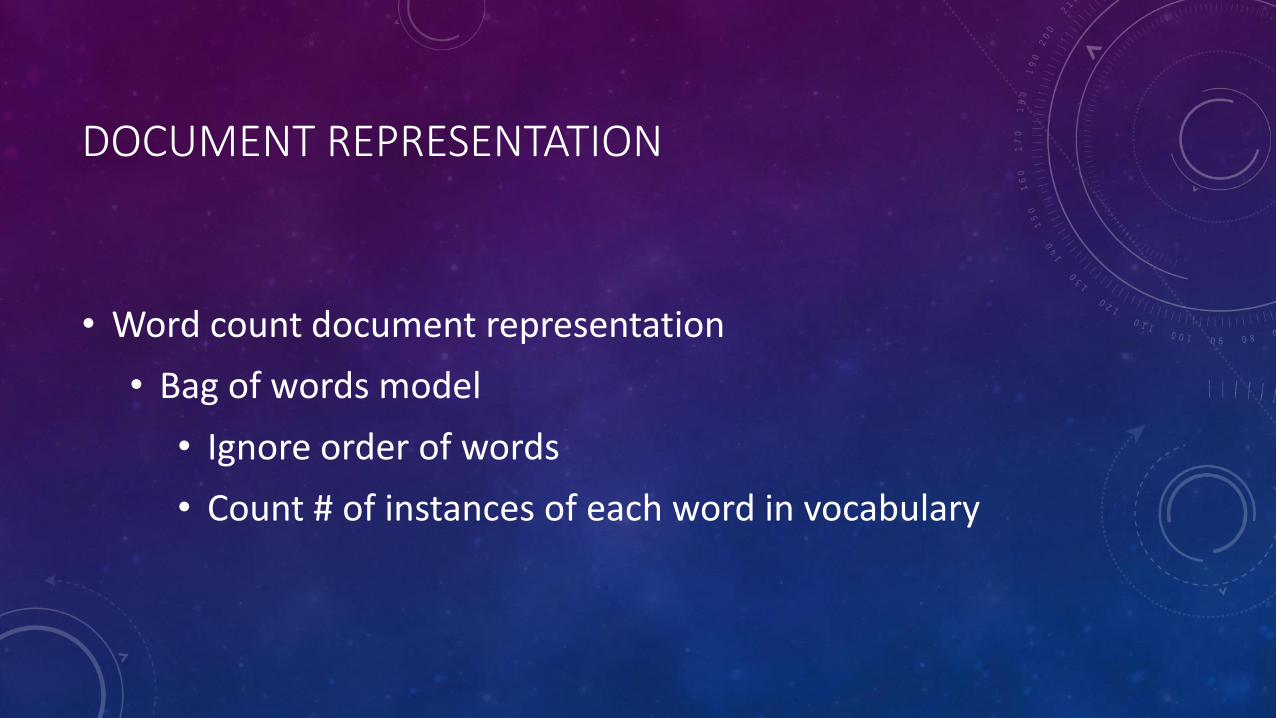
DOCUMENT REPRESENTATION
• Word count document representation
• Bag of words model
• Ignore order of words
• Count # of instances of each word in vocabulary
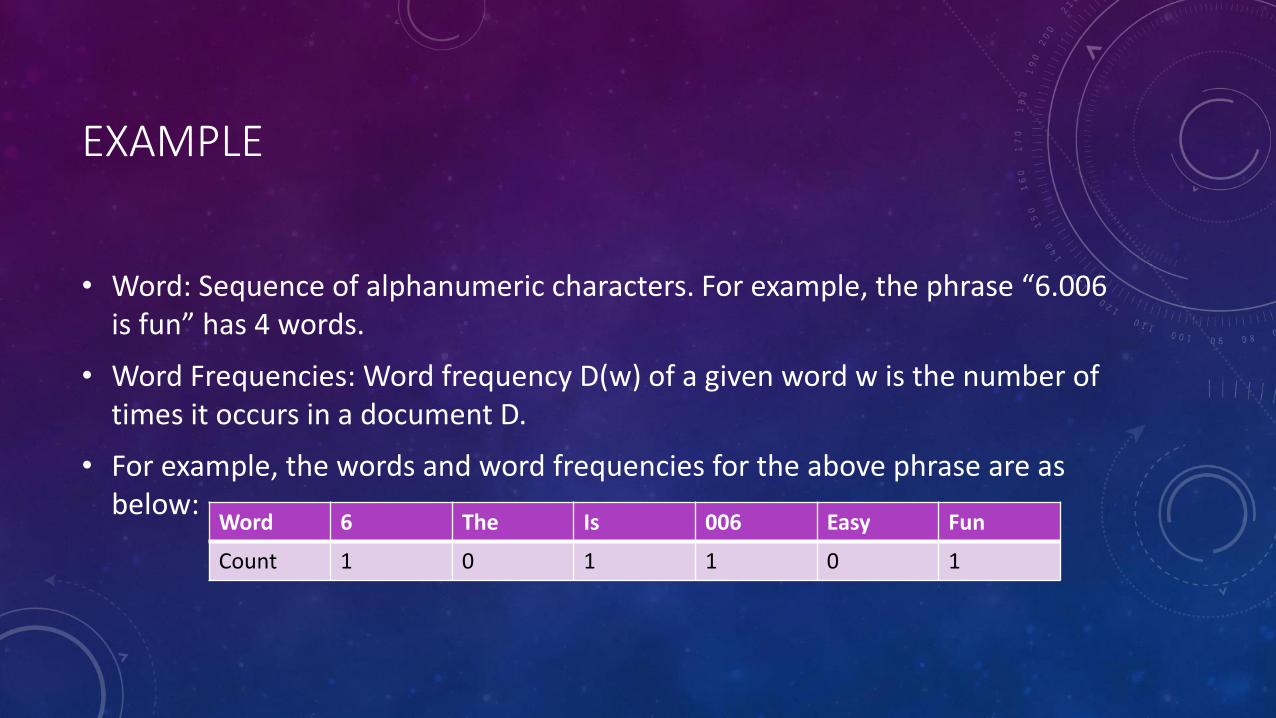
EXAMPLE
• Word: Sequence of alphanumeric characters. For example, the phrase “6.006 is fun” has 4 words.
• Word Frequencies: Word frequency D(w) of a given word w is the number of times it occurs in a document D.
• For example, the words and word frequencies for the above phrase are as below:
Word 6 The Is 006 Easy Fun
Count 1 0 1 1 0 1
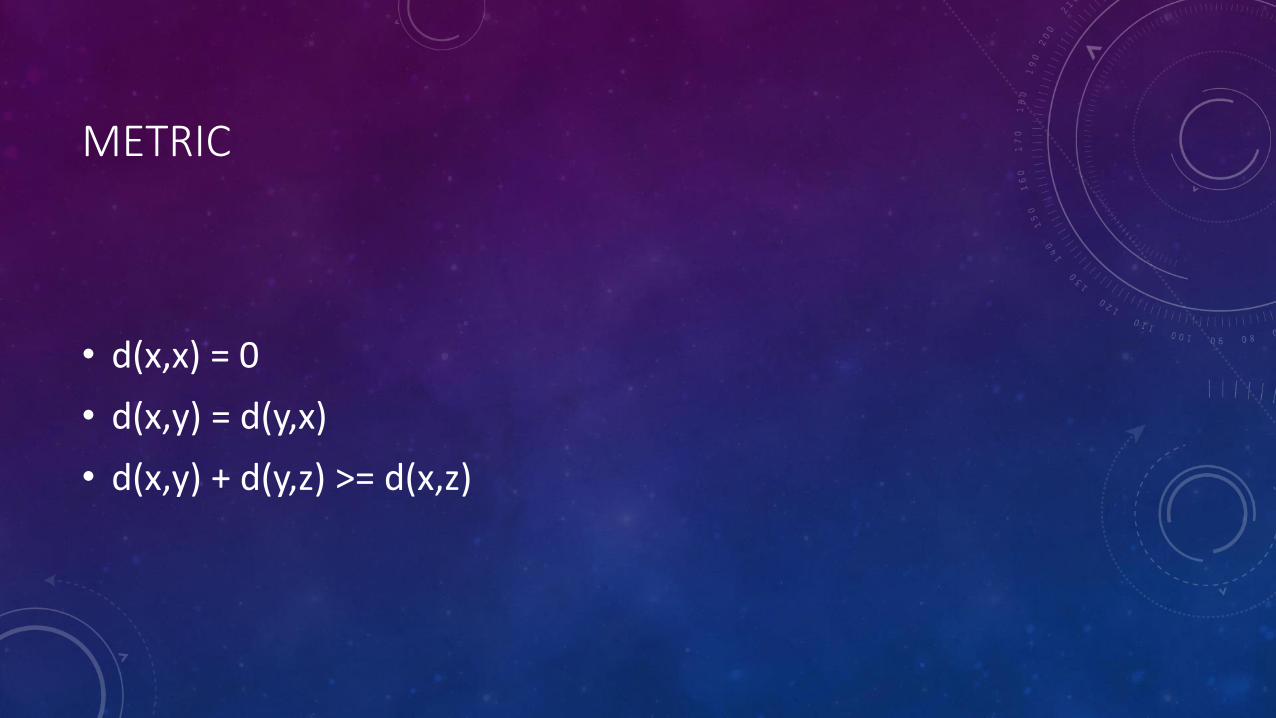
METRIC
• d(x,x) = 0
• d(x,y) = d(y,x)
• d(x,y) + d(y,z) >= d(x,z)
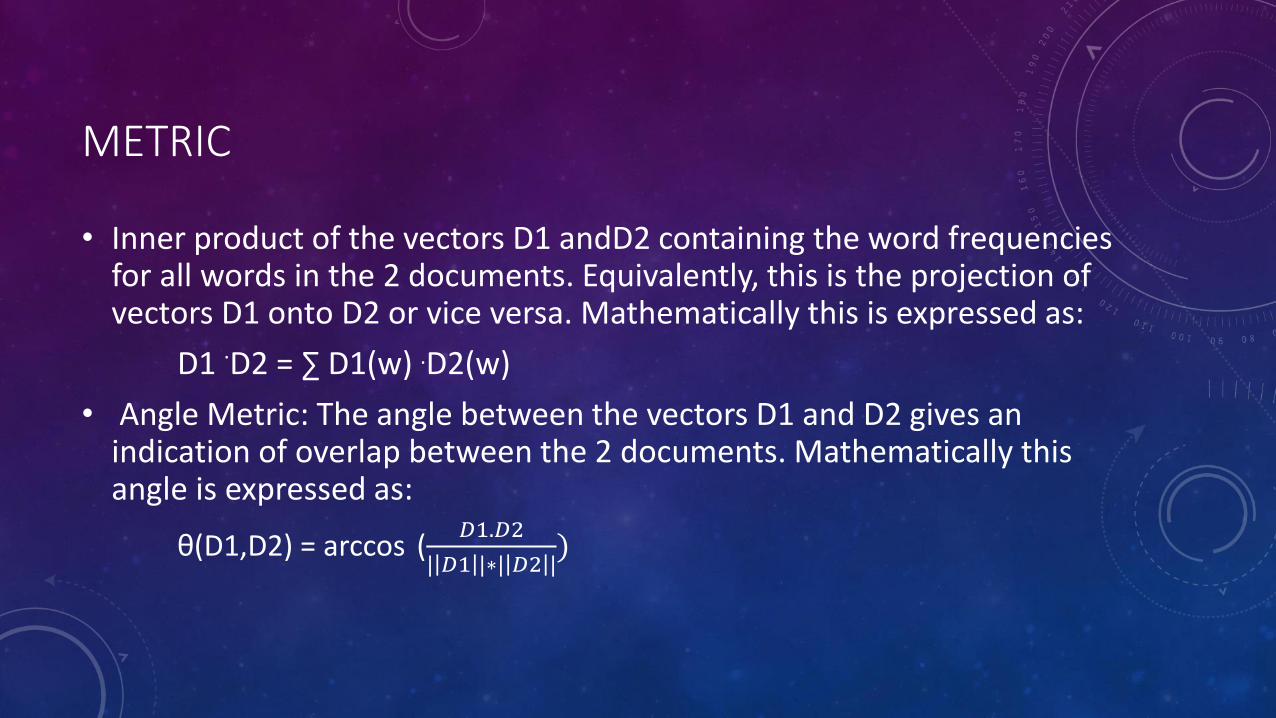
METRIC
• Inner product of the vectors D1 andD2 containing the word frequencies for all words in the 2 documents. Equivalently, this is the projection of vectors D1 onto D2 or vice versa. Mathematically this is expressed as:
D1 ·D2 = ∑ D1(w) .D2(w)
• Angle Metric: The angle between the vectors D1 and D2 gives an indication of overlap between the 2 documents. Mathematically this angle is expressed as:
θ(D1,D2) = arccos (𝐷1.𝐷2
| 𝐷1 |∗| 𝐷2 |)
PYTHON EXAMPLE
• https://ocw.mit.edu/ans7870/6/6.006/s08/lecturenotes/files/docdist2.py
REFERENCE
• http://www.cs.haifa.ac.il/~rita/uml_course/lectures/kmeans.pdf
• https://cs.wmich.edu/alfuqaha/summer14/cs6530/lectures/ClusteringAnalysis.pdf
• http://www.it.uu.se/edu/course/homepage/infoutv/ht09/a2t.pdf
• http://www.cse.buffalo.edu/~jing/cse601/fa12/materials/clustering_density.pdf
• Machine Learning Specialization by University of Washington in Coursera


![Faculty of Computer Science, Electronics and ... · clustering algorithms are integrated from the scikit-learn such as K-means clustering [9] and DBScan clustering, a density-based](https://img.pdfslide.net/doc/110x75/60a41a41676f8d046f20c8dd/faculty-of-computer-science-electronics-and-clustering-algorithms-are-integrated.jpg)
![A Study of Product Trend Analysis of Review Datasets using ... · reviews, comments or blogs. Various clustering algorithms (K-means [16][17][18], DBSCAN[15], Hierarchical etc.) are](https://img.pdfslide.net/doc/110x75/5ed02703137588523c69a543/a-study-of-product-trend-analysis-of-review-datasets-using-reviews-comments.jpg)