Embed Size (px)
Citation preview
1
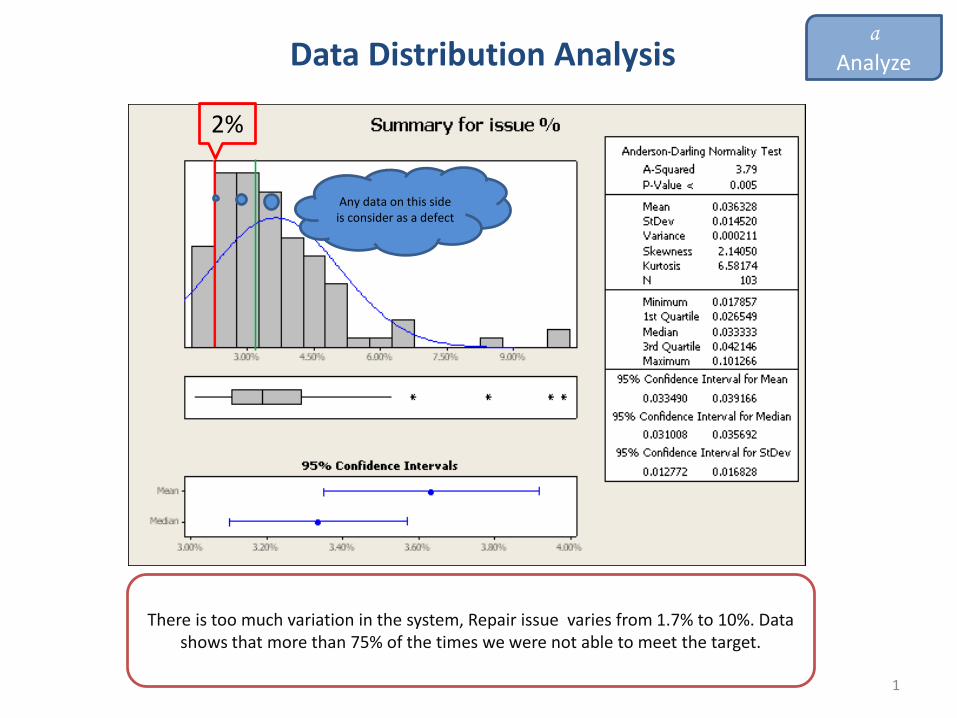
Data Distribution Analysis
There is too much variation in the system, Repair issue varies from 1.7% to 10%. Data shows that more than 75% of the times we were not able to meet the target.
Any data on this side is consider as a defect
a
Analyze
2%
2
a
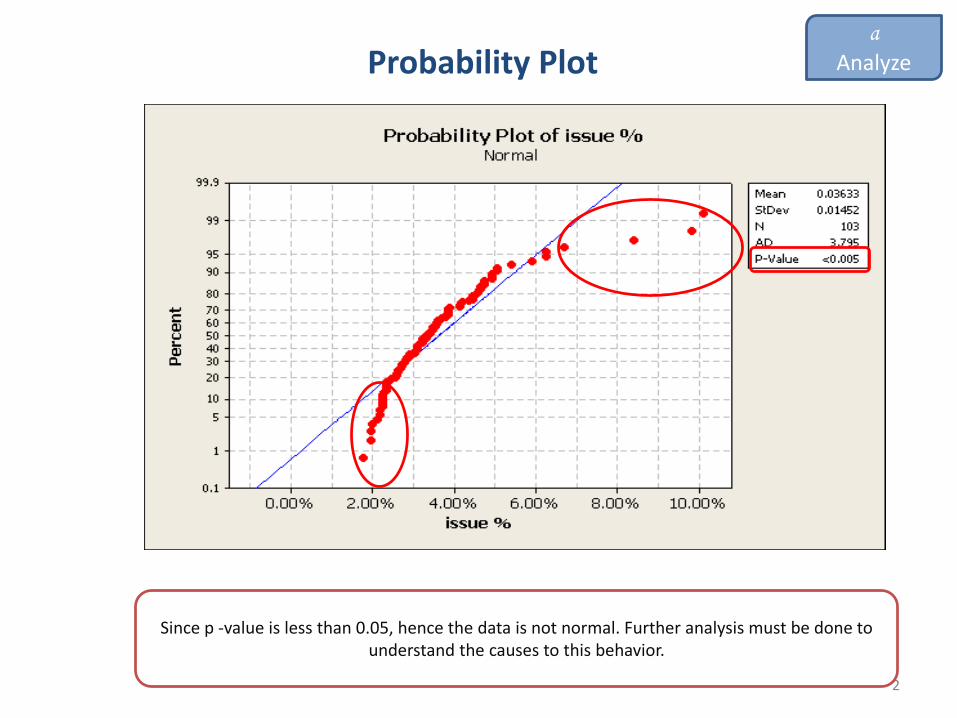
AnalyzeProbability Plot
Since p -value is less than 0.05, hence the data is not normal. Further analysis must be done to understand the causes to this behavior.

3
a
AnalyzeData Stability Analysis
The RUN chart shows that oscillation exists in the data while there are no Clustering and Trends. This evidently shows that the data is not stable. Hence further analysis must be done to identify
the reasons for non stable behavior.
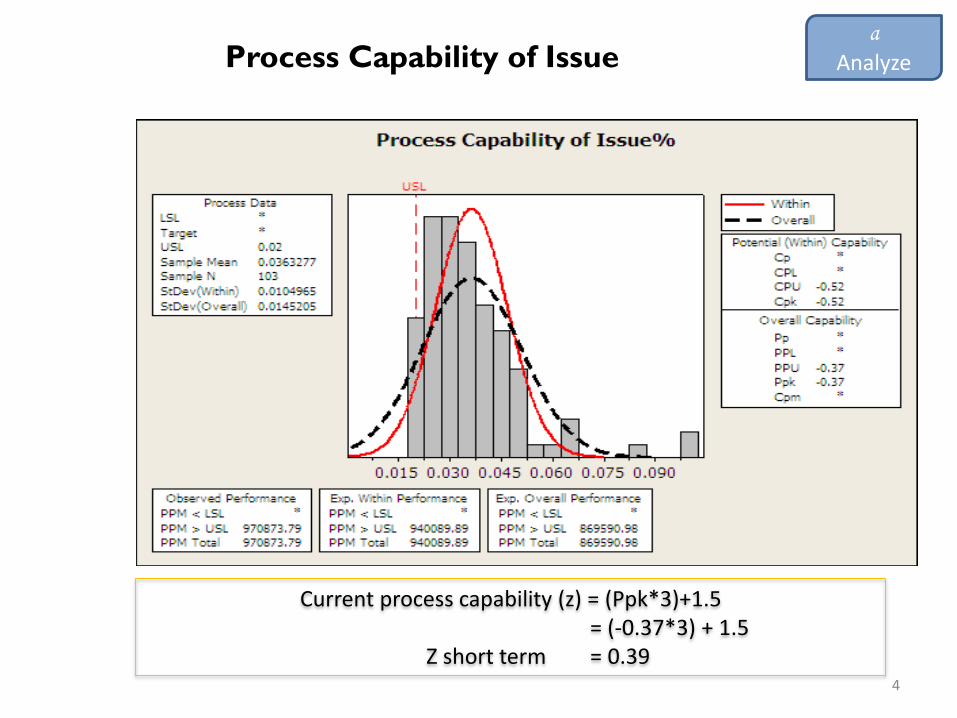
Process Capability of Issue a
Analyze
4
Current process capability (z) = (Ppk*3)+1.5= (-0.37*3) + 1.5
Z short term = 0.39
5
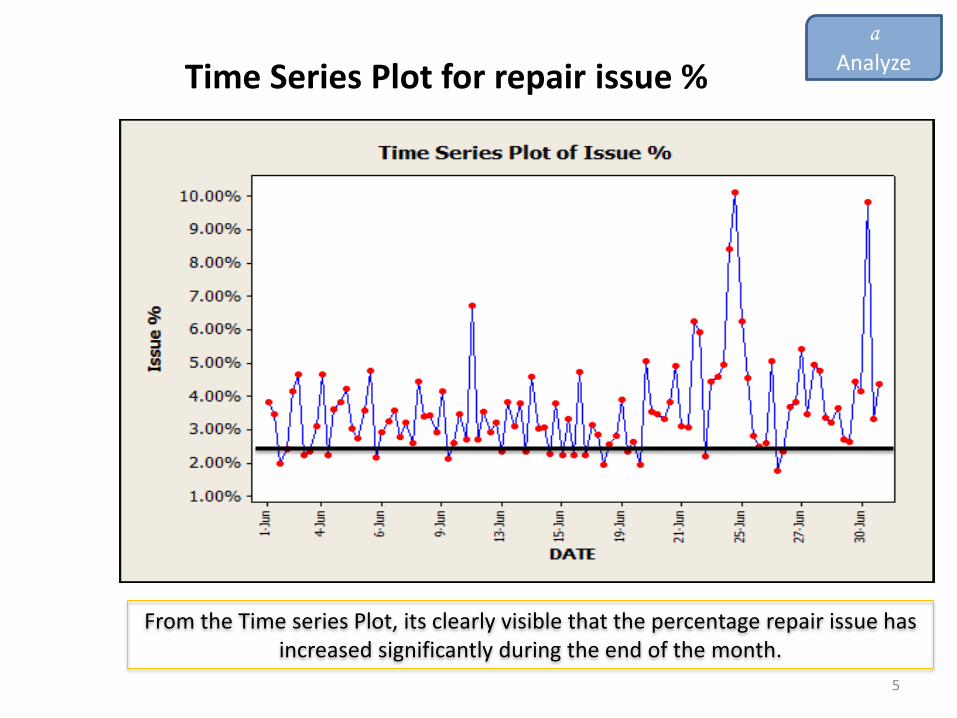
Time Series Plot for repair issue %
a
Analyze
From the Time series Plot, its clearly visible that the percentage repair issue has increased significantly during the end of the month.

6
The quality for Campus is out of control at one instance on 23rd June when the repair issue was 10.13%, need to identify the root cause.
Control Chart for Issue Count
a
Analyze
7
a
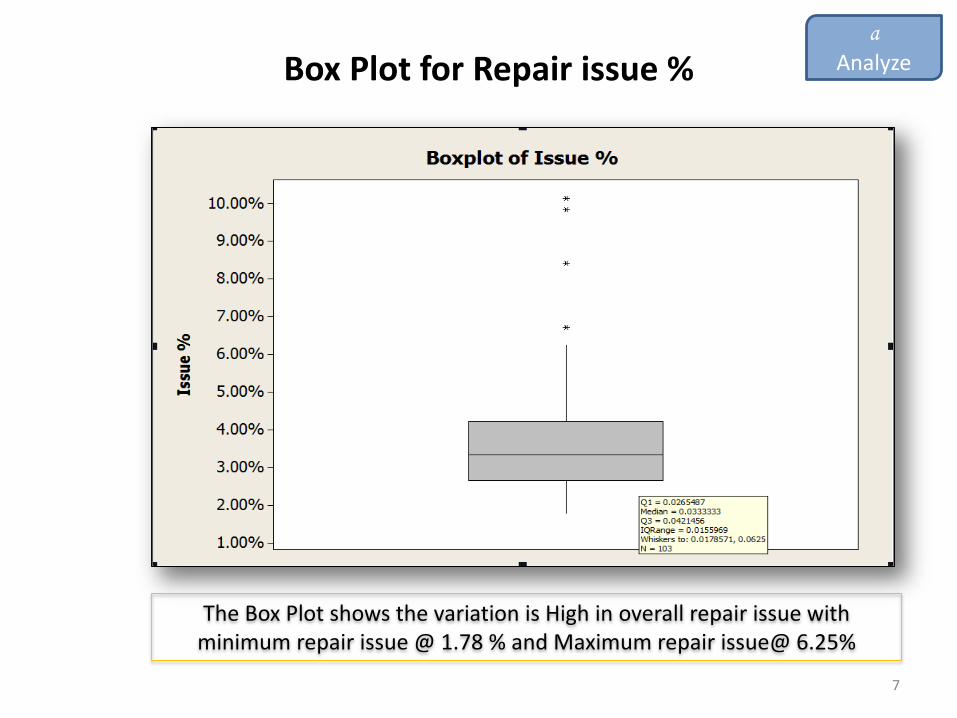
AnalyzeBox Plot for Repair issue %
The Box Plot shows the variation is High in overall repair issue with minimum repair issue @ 1.78 % and Maximum repair issue@ 6.25%
8
a
Analyze
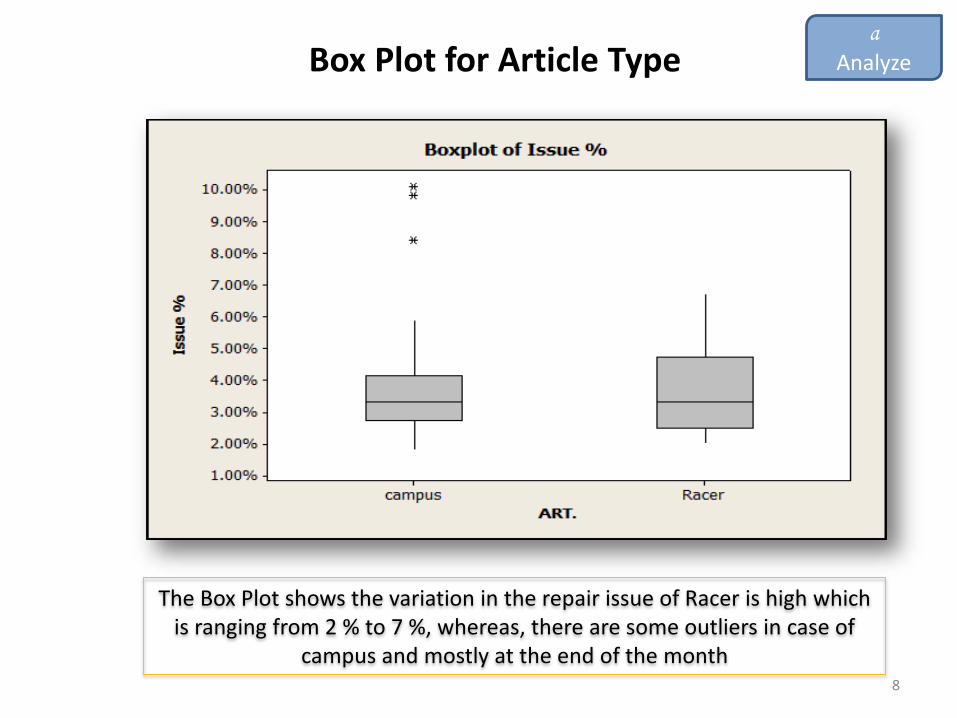
The Box Plot shows the variation in the repair issue of Racer is high which is ranging from 2 % to 7 %, whereas, there are some outliers in case of
campus and mostly at the end of the month
Box Plot for Article Type

9
a
AnalyzeDot Plot for Repair issue % of Article Type
The Dot Plot shows the variation in repair issue is High

10
a
Analyze
Issue Count 37 34 34 18 16 16 4021911010798 96 95 65 55
Percent 4 3 3 2 2 2 421 11 10 9 9 9 6 5
Cum % 85 88 91 93 95 9610021 32 4251 61 70 76 81
Issue Category
Oth
er
wro
ng p
lac e
men
t of
st if
fner
notche
s no
t fo
lled
stitc
h leng
t h in
correc
t
poor
eye
stay
stit
c hing/
off cen
tere
d
D- r
ing
brea
kage
stit c
hing
margin<
1.5->2.0
mm
poor
cou
nter
st it
ching ba
ck o
ff c
ent e
red
poor
prin
t ing
loos
e th
read
ten
sion/
exce
ss 1
mm
Poor
Top
line
stitc
h
Stit c
hing
run
off
Nee
dle m
ark.
tong
ue p
laced
3m
m /of
f cen
ter/t o
o long
/ sho
rt
poor
toe
stit
c hing/
off c
ente
red
1000
800
600
400
200
0
100
80
60
40
20
0
Percent
PARETO CHART OF REPAIR ISSUE%
Pareto chart is showing that the Maximum Repairs are due to Poor Toe Stitching which is contributing 21 %
11
a
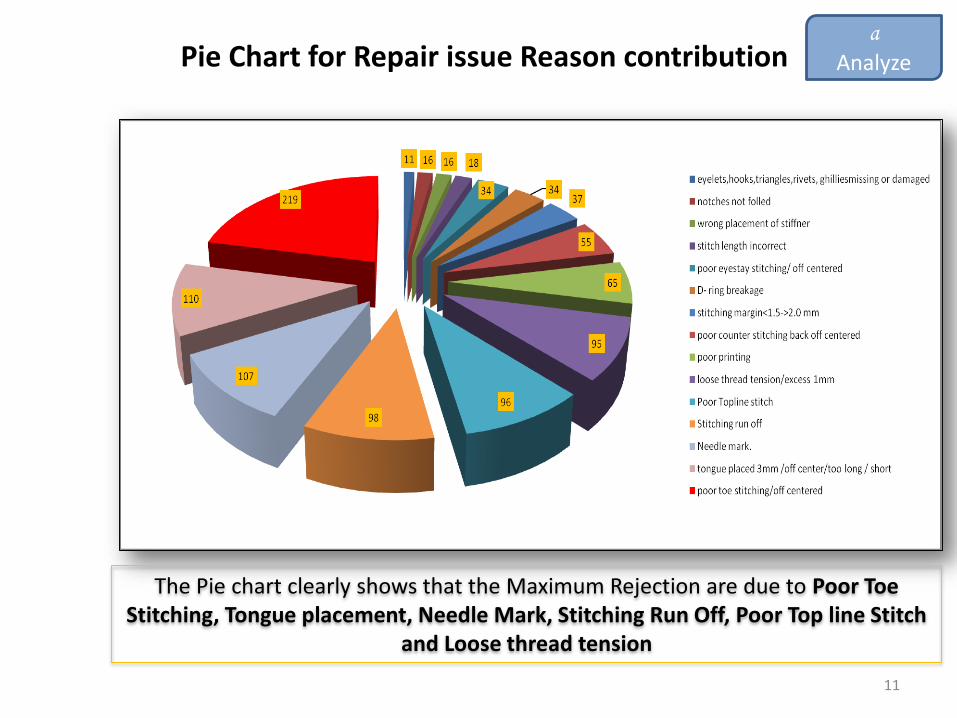
AnalyzePie Chart for Repair issue Reason contribution
The Pie chart clearly shows that the Maximum Rejection are due to Poor Toe Stitching, Tongue placement, Needle Mark, Stitching Run Off, Poor Top line Stitch
and Loose thread tension

12
Repair issue %
Check top (Thick)&
bottom(less thick,(Material, thread & needle
combination)
Stitching run off
skill improvement
Poor Topline stitch
Machine maintenance
(shuttle & needle
adjustment)
Loose Top Thread/Tight
Bottom thread
loose thread tension/excess
1mm
Wrong top (Thick)& bottom(less thick)thread combination
Machine adjustment should be known to
operator
Materialstongue placed 3mm /off center/too long / short
Centre marking on vamp & tongue
required
skill improvement
Marking from the edge should be
done on tongue
poor toe stitching/off centered
Centre marking required
Machine maintainence &
adjustment
Skill improvement
Six Sigma Fishbone Analysis Diagram
a
Analyze
Needle mark.
skill improvement
Machine maintenance
(shuttle & needle
adjustment)