Embed Size (px)
Citation preview
STOP moving data aroundEdge Analytics made easy
Analytics built for IoT

Imagine a world…
Where IoT analytics delivers 15% more output
from renewable energy sources
30TBAnalyze Data
in Real-time
15%Increase
Efficiency
$18K/hr; $158M/yrGenerate Operational/
Economic Benefits
(20,000 Wind Turbines; 10 GW Capacity; .3 Capacity Factor; $40/MW-hour)
2
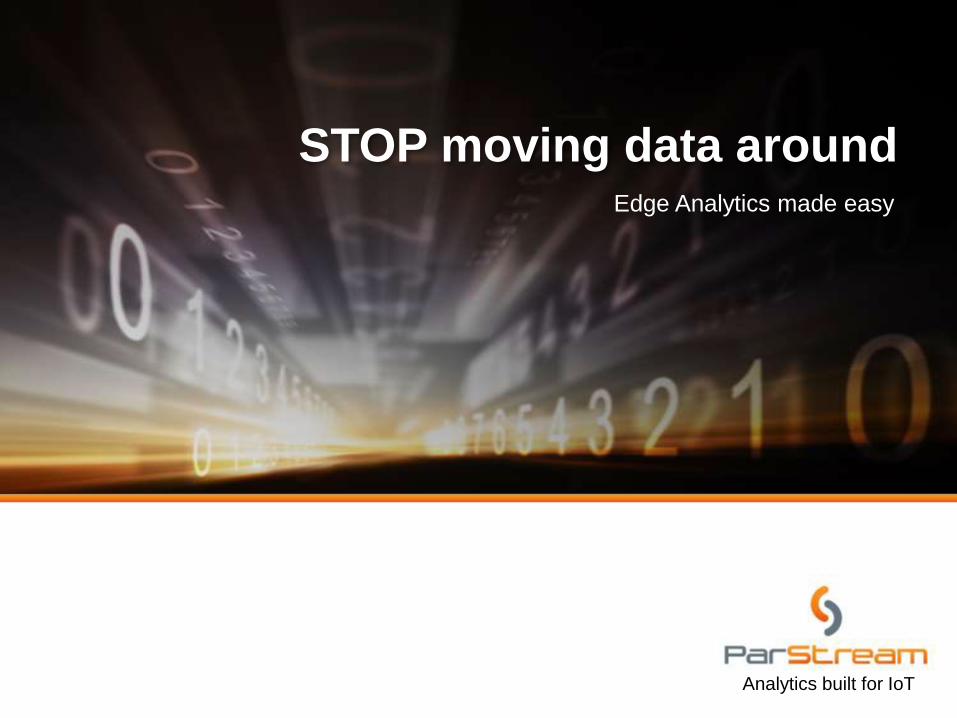
IoT analytics has a set of distinct requirements.
3
Big DataData is growing faster and bigger
because of number of sensors
10B+ rows
5TB+
Fast DataData streamed from sensors
requires fast ingestion
1M+ rows
per sec
Edge AnalyticsIoT data is mostly generated
at the ‘Edges’ of the network
100+
Locations
Real-Time InsightsUse cases require near
Real Time Analytics
<1 sec query
response
time
Problem
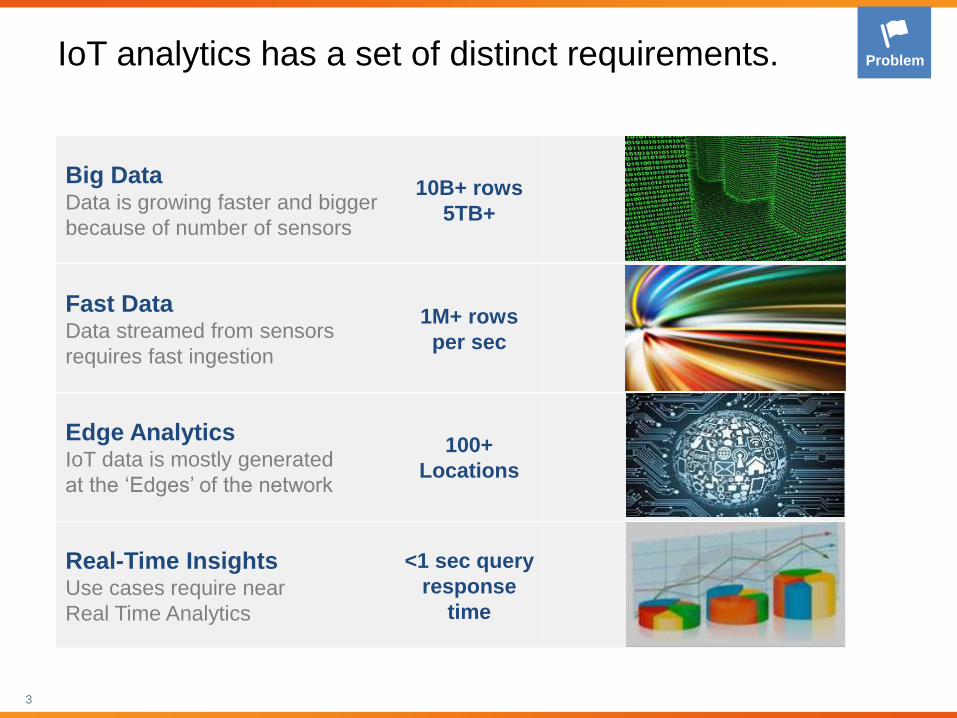
Horizontal Integration, Vertical ApplicationsDelivering actionable insights requires use-case specific
applications that are adapted to changing needs rappidly
4
Network
Analytics
Query
4 billion
records
4 billion
records
Today - Purpose built Solutions stacks
Mobile
Analytics
Query
Network
Analytics
Query
Future – Flexible Application Architecture
Mobile
Analytics
User-Experience
Management?
Data Collection
Storage &
Analytics
Application
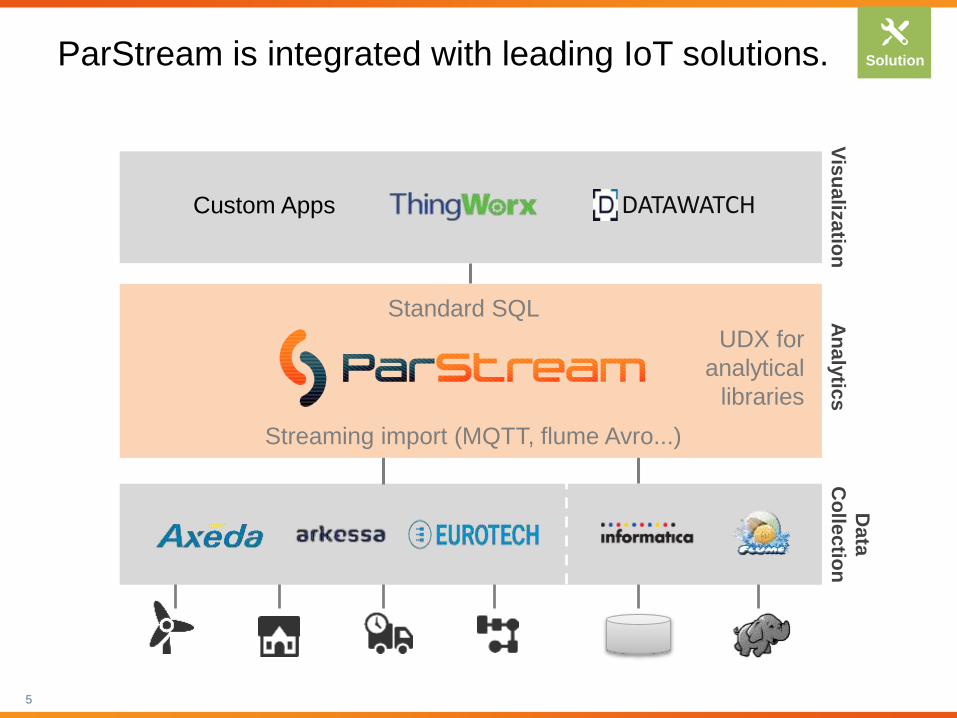
ParStream is integrated with leading IoT solutions.
5
Custom Apps DATAWATCH
An
aly
tics
Vis
ua
liza
tion
Data
Co
llec
tion
Solution
Standard SQL
Streaming import (MQTT, flume Avro...)
UDX for
analytical
libraries
Geo-Distributed setup substantially reduces network traffic enabling continuous monitoring (sampling proofed insufficient)
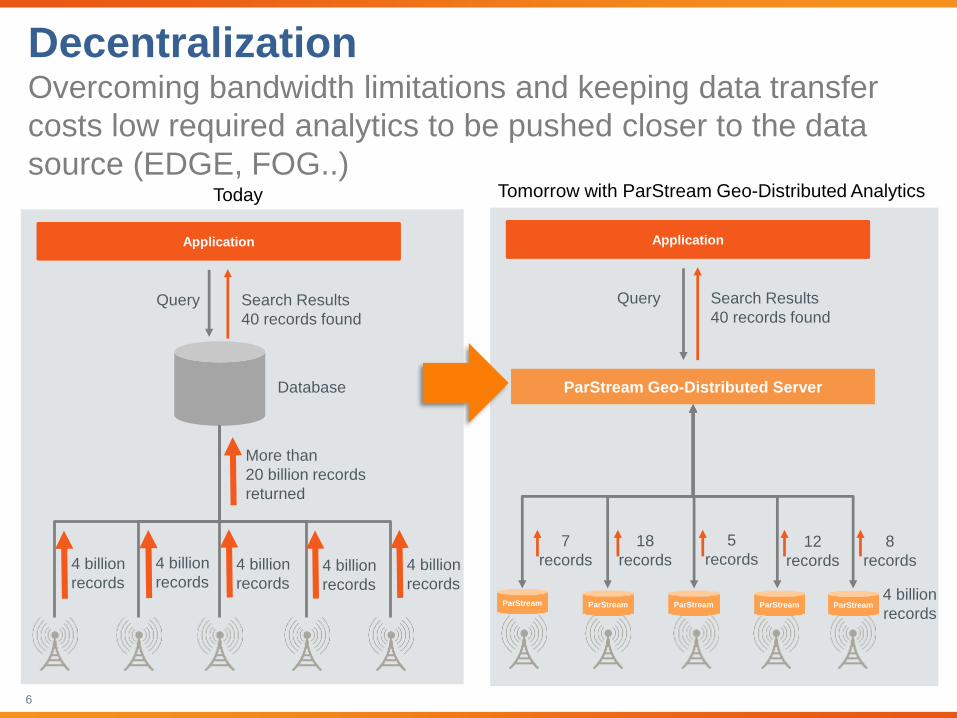
DecentralizationOvercoming bandwidth limitations and keeping data transfer
costs low required analytics to be pushed closer to the data
source (EDGE, FOG..)
6
Application
Database
More than
20 billion records
returned
Query Search Results
40 records found
4 billion
records
4 billion
records4 billion
records4 billion
records
4 billion
records
Today
Application
Query Search Results
40 records found
ParStream
ParStream Geo-Distributed Server
7
records
18
records
5
records12
records
8
records
4 billion
recordsParStream ParStream ParStream ParStream
Tomorrow with ParStream Geo-Distributed Analytics
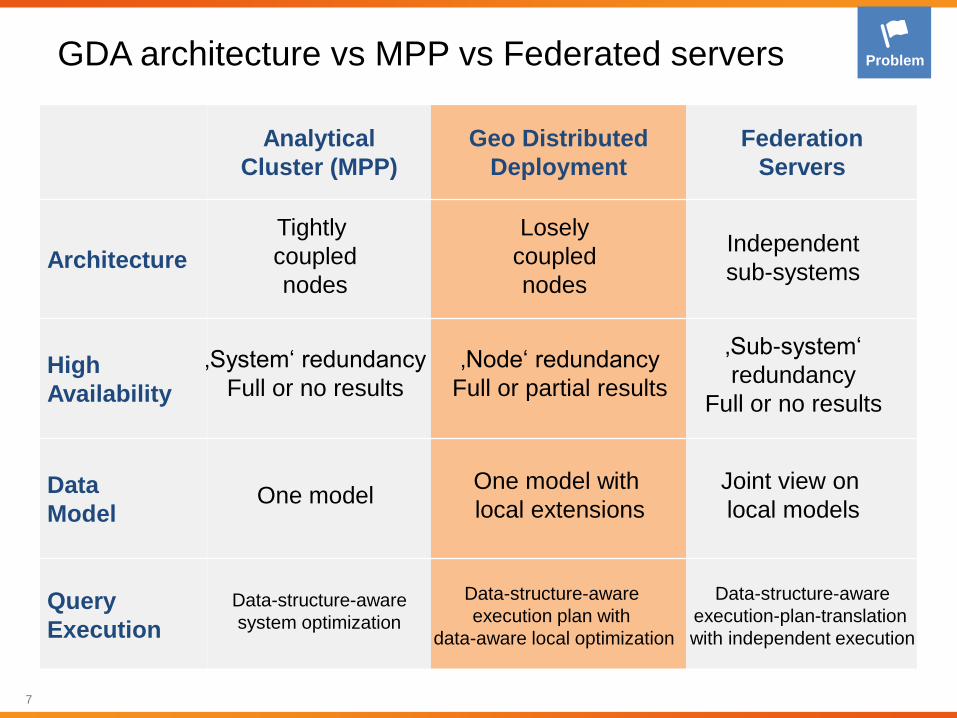
GDA architecture vs MPP vs Federated servers
7
Analytical
Cluster (MPP)
Geo Distributed
Deployment
Federation
Servers
Architecture
High
Availability
Data
Model
Query
Execution
Problem
Tightly
coupled
nodes
Losely
coupled
nodes
Independent
sub-systems
‚System‘ redundancy
Full or no results
‚Node‘ redundancy
Full or partial results
‚Sub-system‘
redundancy
Full or no results
One modelOne model with
local extensions
Joint view on
local models
Data-structure-aware
system optimization
Data-structure-aware
execution plan with
data-aware local optimization
Data-structure-aware
execution-plan-translation
with independent execution
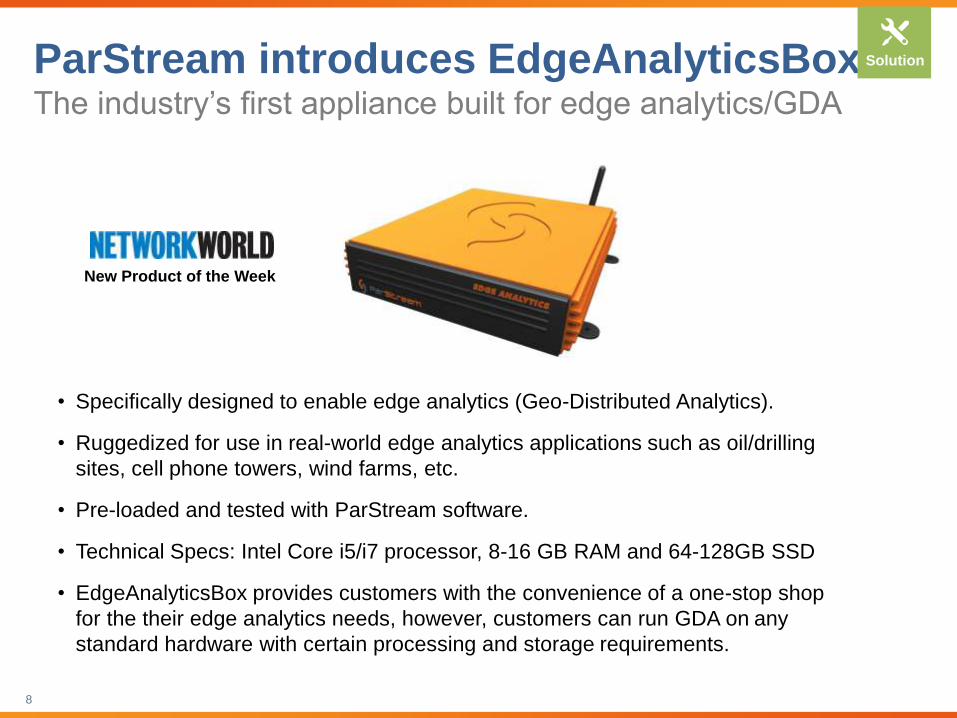
ParStream introduces EdgeAnalyticsBoxThe industry’s first appliance built for edge analytics/GDA
• Specifically designed to enable edge analytics (Geo-Distributed Analytics).
• Ruggedized for use in real-world edge analytics applications such as oil/drilling
sites, cell phone towers, wind farms, etc.
• Pre-loaded and tested with ParStream software.
• Technical Specs: Intel Core i5/i7 processor, 8-16 GB RAM and 64-128GB SSD
• EdgeAnalyticsBox provides customers with the convenience of a one-stop shop
for the their edge analytics needs, however, customers can run GDA on any
standard hardware with certain processing and storage requirements.
8
Solution
New Product of the Week
Geo-Distributed setup substantially reduces network traffic enabling continuous monitoring (sampling proofed insufficient)
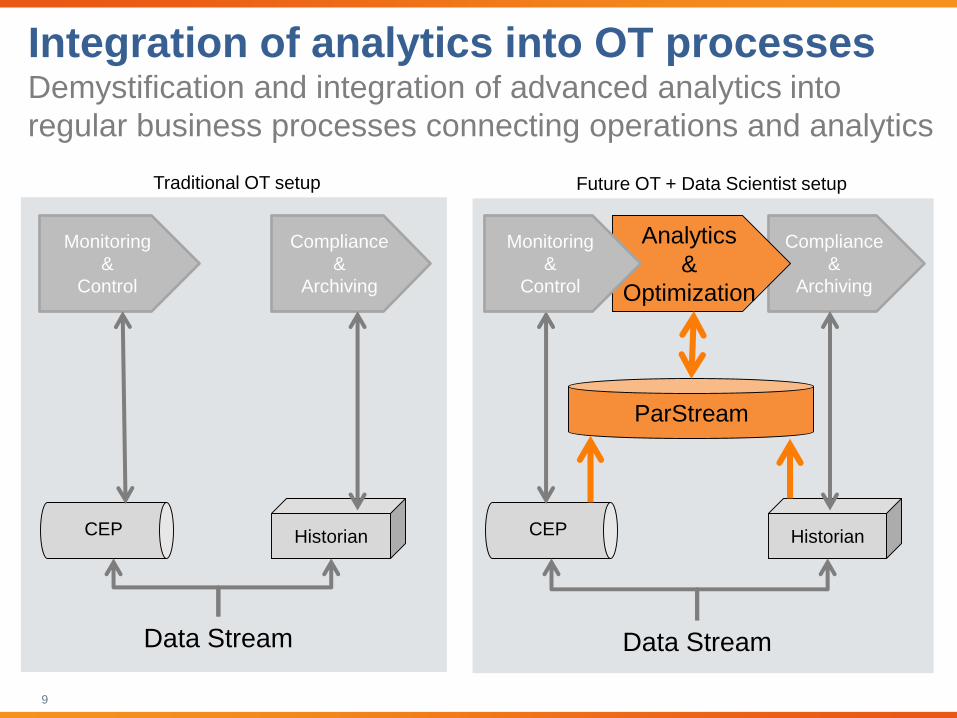
Integration of analytics into OT processesDemystification and integration of advanced analytics into
regular business processes connecting operations and analytics
9
Traditional OT setup Future OT + Data Scientist setup
Monitoring
&
Control
Compliance
&
Archiving
HistorianCEP
Data Stream
Compliance
&
Archiving
HistorianCEP
Data Stream
Analytics
&
Optimization
ParStream
Monitoring
&
Control
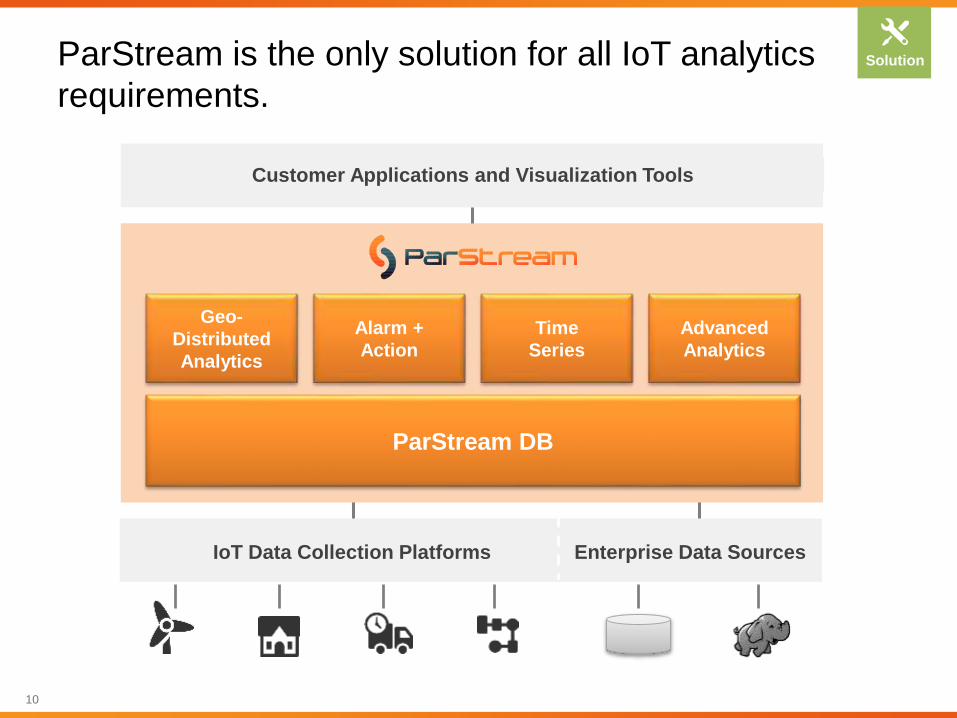
ParStream is the only solution for all IoT analytics
requirements.
10
Customer Applications and Visualization Tools
IoT Data Collection Platforms Enterprise Data Sources
ParStream DB
Geo-
Distributed
Analytics
Alarm +
Action
Time
Series
Advanced
Analytics
Solution
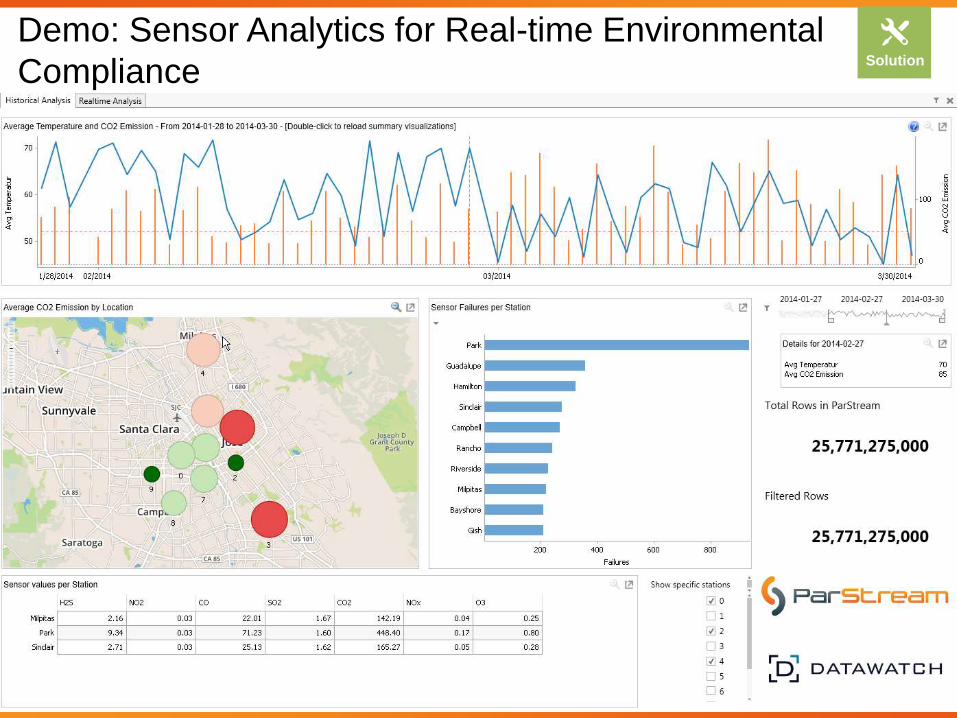
Demo: Sensor Analytics for Real-time Environmental
Compliance
11
Solution

Backup
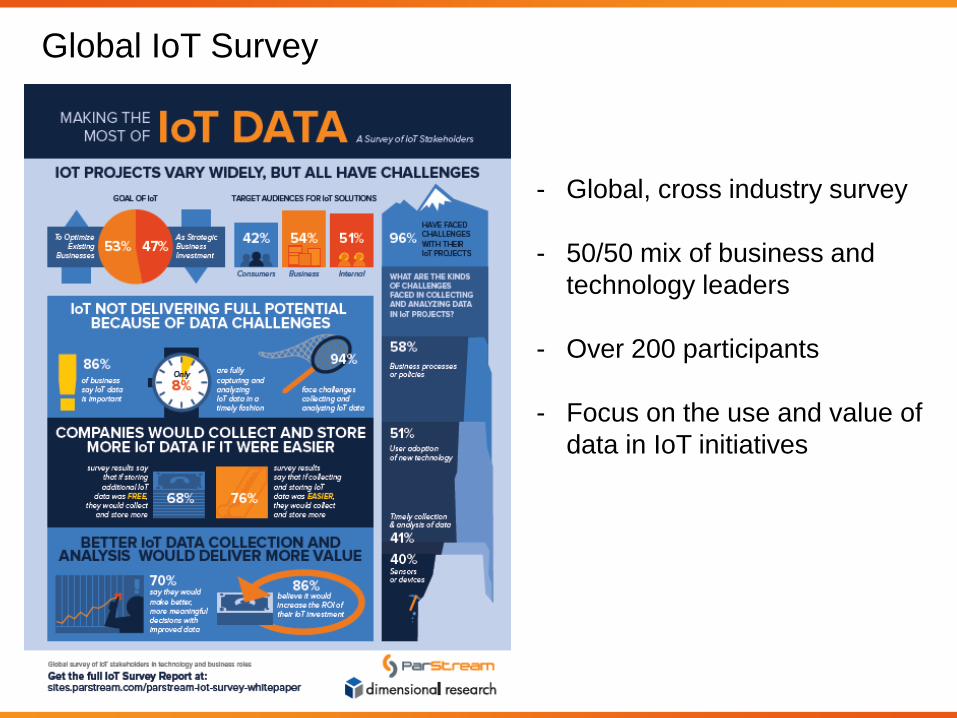
Global IoT Survey
- Global, cross industry survey
- 50/50 mix of business and
technology leaders
- Over 200 participants
- Focus on the use and value of
data in IoT initiatives
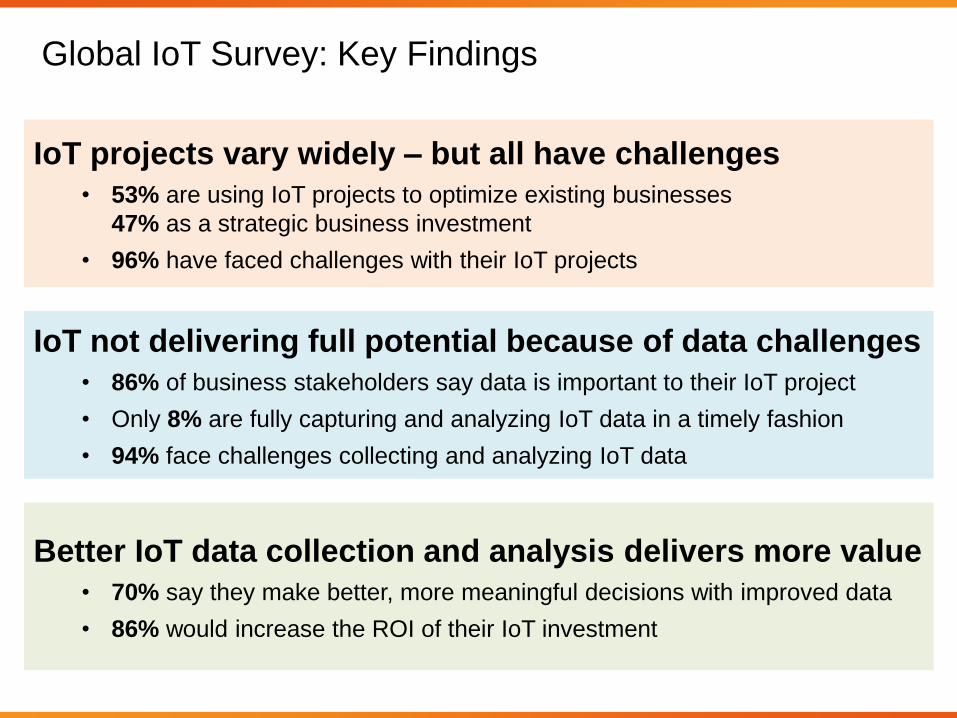
Better IoT data collection and analysis delivers more value
• 70% say they make better, more meaningful decisions with improved data
• 86% would increase the ROI of their IoT investment
IoT not delivering full potential because of data challenges
• 86% of business stakeholders say data is important to their IoT project
• Only 8% are fully capturing and analyzing IoT data in a timely fashion
• 94% face challenges collecting and analyzing IoT data
IoT projects vary widely – but all have challenges
• 53% are using IoT projects to optimize existing businesses
47% as a strategic business investment
• 96% have faced challenges with their IoT projects
Global IoT Survey: Key Findings
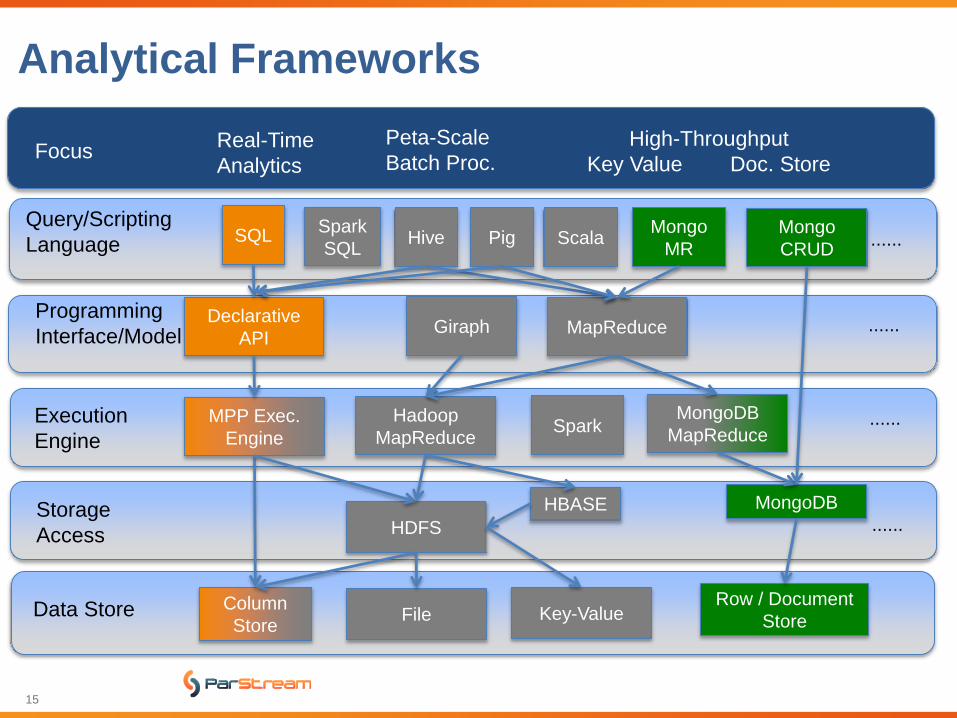
Analytical Frameworks
15
Query/Scripting
Language SQL Hive PigMongo
MR
Data Store
Execution
Engine
Programming
Interface/Model MapReduce
Hadoop
MapReduce
MongoDB
MapReduce
MongoDB
Column
Store
HBASE
Row / Document
Store
Giraph
......
......
......
......
MPP Exec.
Engine
Declarative
API
Mongo
CRUD
Storage
Access
Key-ValueFile
HDFS
Spark
Spark
SQLScala
FocusReal-Time
Analytics
Peta-Scale
Batch Proc.High-Throughput
Key Value Doc. Store
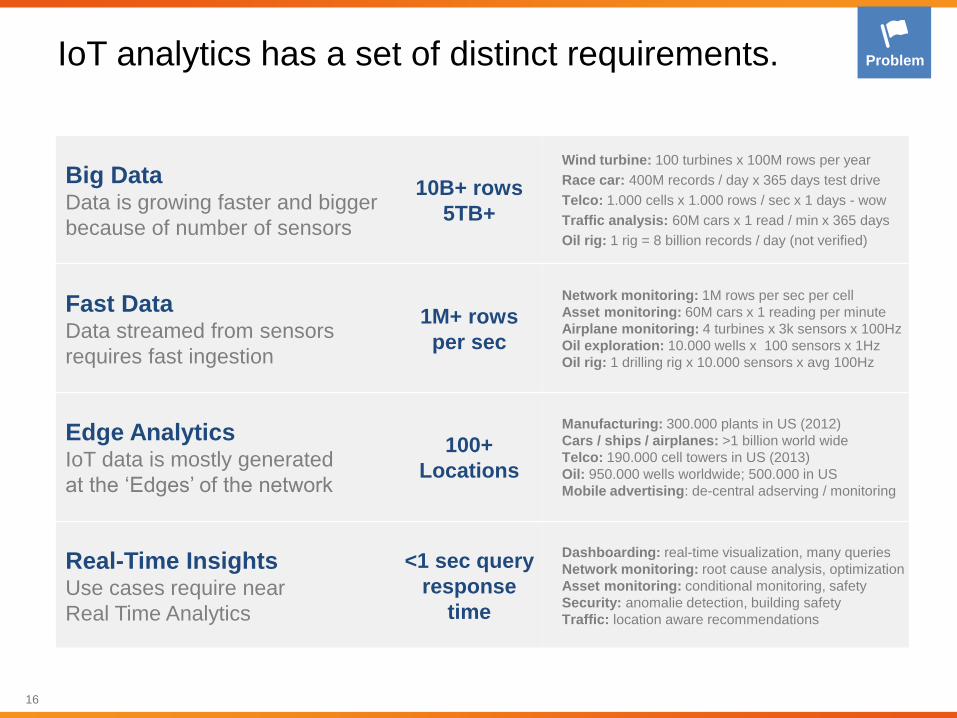
IoT analytics has a set of distinct requirements.
16
Big DataData is growing faster and bigger
because of number of sensors
10B+ rows
5TB+
Wind turbine: 100 turbines x 100M rows per year
Race car: 400M records / day x 365 days test drive
Telco: 1.000 cells x 1.000 rows / sec x 1 days - wow
Traffic analysis: 60M cars x 1 read / min x 365 days
Oil rig: 1 rig = 8 billion records / day (not verified)
Fast DataData streamed from sensors
requires fast ingestion
1M+ rows
per sec
Network monitoring: 1M rows per sec per cell
Asset monitoring: 60M cars x 1 reading per minute
Airplane monitoring: 4 turbines x 3k sensors x 100Hz
Oil exploration: 10.000 wells x 100 sensors x 1Hz
Oil rig: 1 drilling rig x 10.000 sensors x avg 100Hz
Edge AnalyticsIoT data is mostly generated
at the ‘Edges’ of the network
100+
Locations
Manufacturing: 300.000 plants in US (2012)
Cars / ships / airplanes: >1 billion world wide
Telco: 190.000 cell towers in US (2013)
Oil: 950.000 wells worldwide; 500.000 in US
Mobile advertising: de-central adserving / monitoring
Real-Time InsightsUse cases require near
Real Time Analytics
<1 sec query
response
time
Dashboarding: real-time visualization, many queries
Network monitoring: root cause analysis, optimization
Asset monitoring: conditional monitoring, safety
Security: anomalie detection, building safety
Traffic: location aware recommendations
Problem
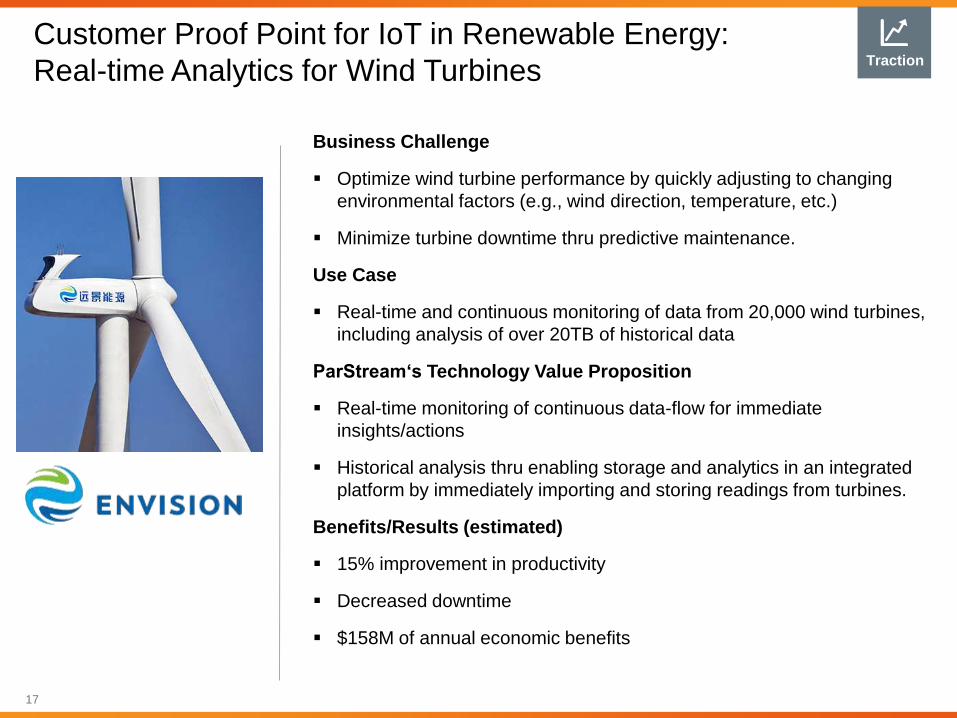
Customer Proof Point for IoT in Renewable Energy:
Real-time Analytics for Wind Turbines
17
Business Challenge
Optimize wind turbine performance by quickly adjusting to changing
environmental factors (e.g., wind direction, temperature, etc.)
Minimize turbine downtime thru predictive maintenance.
Use Case
Real-time and continuous monitoring of data from 20,000 wind turbines,
including analysis of over 20TB of historical data
ParStream‘s Technology Value Proposition
Real-time monitoring of continuous data-flow for immediate
insights/actions
Historical analysis thru enabling storage and analytics in an integrated
platform by immediately importing and storing readings from turbines.
Benefits/Results (estimated)
15% improvement in productivity
Decreased downtime
$158M of annual economic benefits
Traction
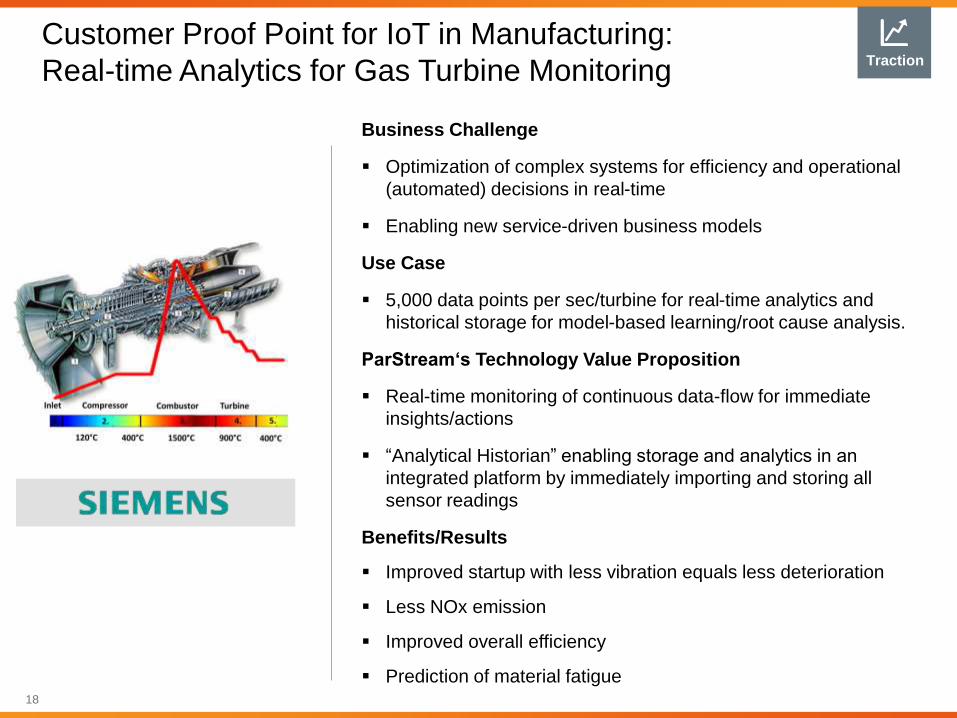
Customer Proof Point for IoT in Manufacturing:
Real-time Analytics for Gas Turbine Monitoring
18
Business Challenge
Optimization of complex systems for efficiency and operational
(automated) decisions in real-time
Enabling new service-driven business models
Use Case
5,000 data points per sec/turbine for real-time analytics and
historical storage for model-based learning/root cause analysis.
ParStream‘s Technology Value Proposition
Real-time monitoring of continuous data-flow for immediate
insights/actions
“Analytical Historian” enabling storage and analytics in an
integrated platform by immediately importing and storing all
sensor readings
Benefits/Results
Improved startup with less vibration equals less deterioration
Less NOx emission
Improved overall efficiency
Prediction of material fatigue
Traction
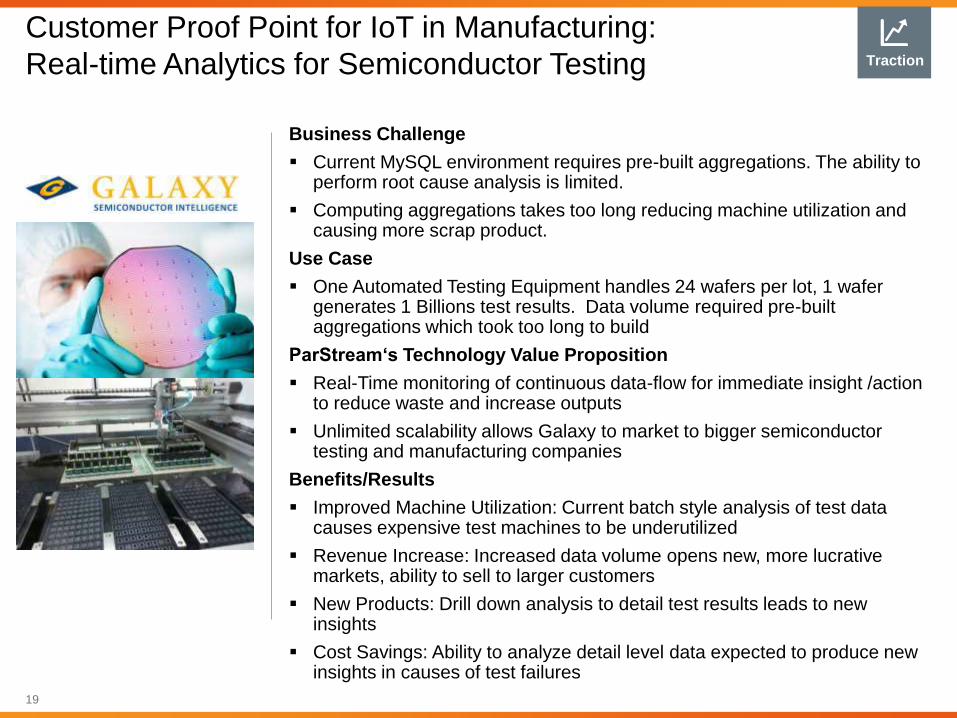
Customer Proof Point for IoT in Manufacturing:
Real-time Analytics for Semiconductor Testing
19
Business Challenge
Current MySQL environment requires pre-built aggregations. The ability to perform root cause analysis is limited.
Computing aggregations takes too long reducing machine utilization and causing more scrap product.
Use Case
One Automated Testing Equipment handles 24 wafers per lot, 1 wafer generates 1 Billions test results. Data volume required pre-built aggregations which took too long to build
ParStream‘s Technology Value Proposition
Real-Time monitoring of continuous data-flow for immediate insight /action to reduce waste and increase outputs
Unlimited scalability allows Galaxy to market to bigger semiconductor testing and manufacturing companies
Benefits/Results
Improved Machine Utilization: Current batch style analysis of test data causes expensive test machines to be underutilized
Revenue Increase: Increased data volume opens new, more lucrative markets, ability to sell to larger customers
New Products: Drill down analysis to detail test results leads to new insights
Cost Savings: Ability to analyze detail level data expected to produce new insights in causes of test failures
Traction
Customer Proof Point for IoT in Automotive/Telematics:
Real-time Analytics for Sensor Data/Vehicle Monitoring
20
Business Challenge
Optimization of multiple systems for efficiency and operational
(automated) decisions on billions of records
Enabling new service-driven business models
Use Case
Real-time monitoring of continuous GPS data and events flows
ParStream‘s Technology Value Proposition
Over 260 million new records/month for real-time analytics
31 billion records of historical data
ParStream collects all data from different systems near-real-time
Benefits/Results
Reduced overall data manipulation time by over 90%
Reduced annual hardware by over 60%
Improved execution time and scheduling efforts
Improved analysis/prediction of driver profiles
Traction
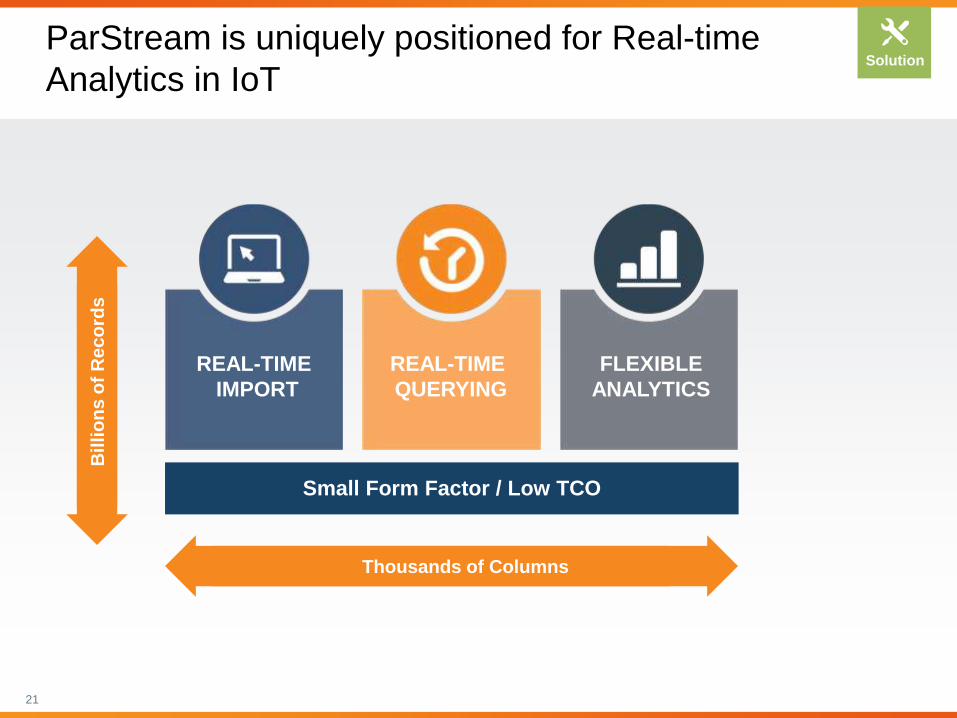
ParStream is uniquely positioned for Real-time
Analytics in IoT
21
REAL-TIME
IMPORT
REAL-TIME
QUERYING
FLEXIBLE
ANALYTICS
Small Form Factor / Low TCO
Bil
lio
ns
of
Re
co
rds
Thousands of Columns
Solution
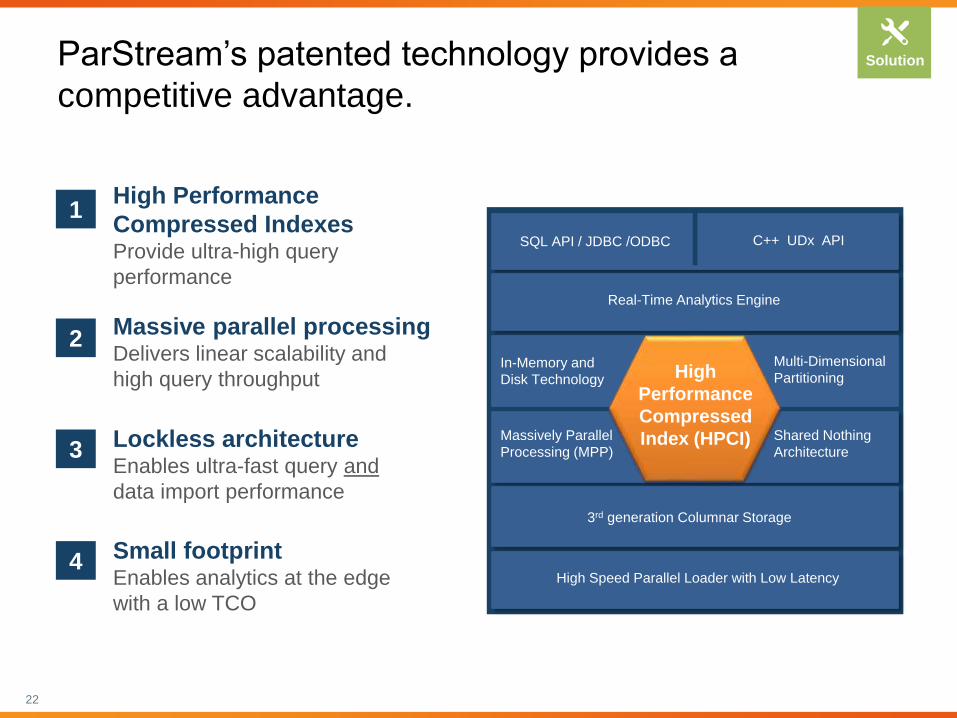
ParStream’s patented technology provides a
competitive advantage.
1
2
3 Lockless architectureEnables ultra-fast query and
data import performance
Massive parallel processingDelivers linear scalability and
high query throughput
4 Small footprint Enables analytics at the edge
with a low TCO
High Performance
Compressed IndexesProvide ultra-high query
performance
SQL API / JDBC /ODBC C++ UDx API
Real-Time Analytics Engine
In-Memory and
Disk Technology
Multi-Dimensional
Partitioning
Massively Parallel
Processing (MPP)
Shared Nothing
Architecture
3rd generation Columnar Storage
High Speed Parallel Loader with Low Latency
High
Performance
Compressed
Index (HPCI)
22
Solution
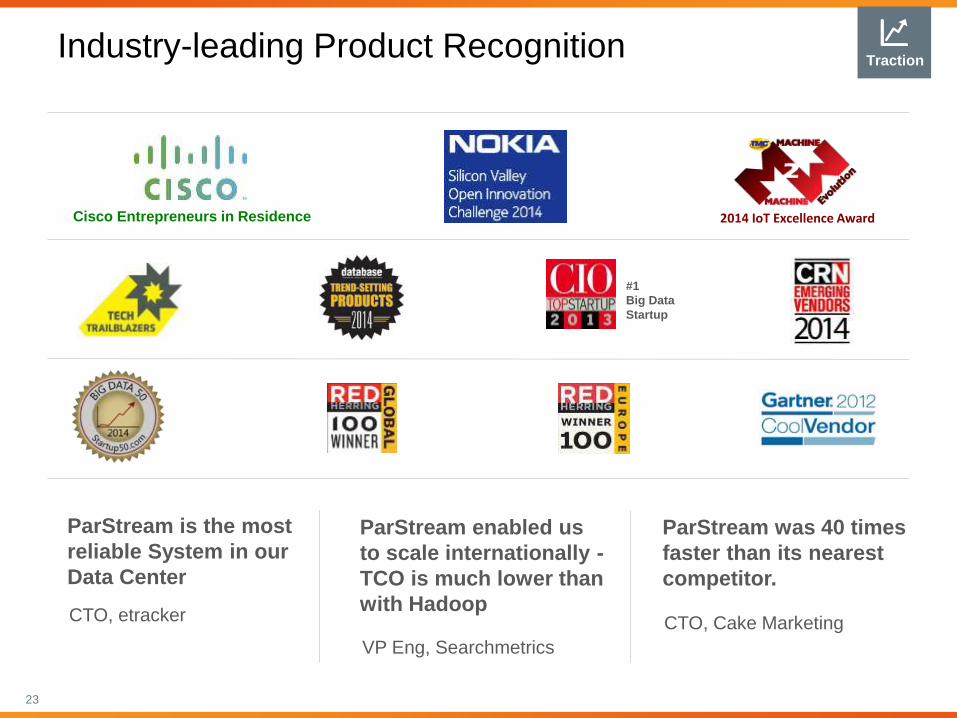
Industry-leading Product Recognition
23
ParStream is the most
reliable System in our
Data Center
CTO, etracker
ParStream was 40 times
faster than its nearest
competitor.
CTO, Cake Marketing
ParStream enabled us
to scale internationally -
TCO is much lower than
with Hadoop
VP Eng, Searchmetrics
#1
Big Data
Startup
Cisco Entrepreneurs in Residence
Traction
2014 IoT Excellence Award
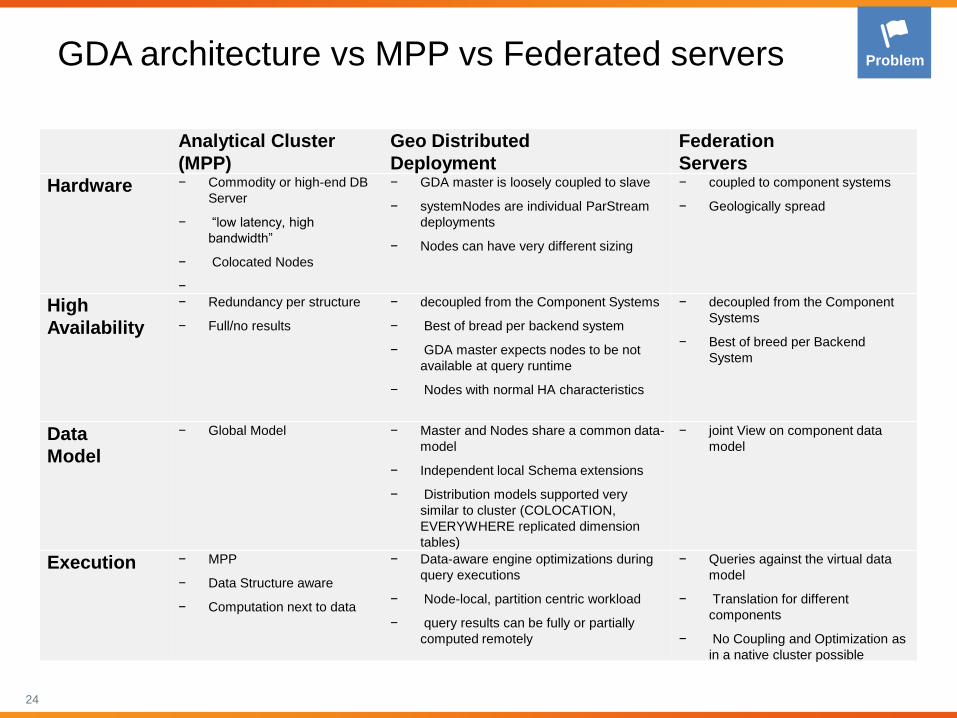
GDA architecture vs MPP vs Federated servers
24
Analytical Cluster
(MPP)
Geo Distributed
Deployment
Federation
Servers
Hardware − Commodity or high-end DB
Server
− “low latency, high
bandwidth”
− Colocated Nodes
−
− GDA master is loosely coupled to slave
− systemNodes are individual ParStream
deployments
− Nodes can have very different sizing
− coupled to component systems
− Geologically spread
High
Availability
− Redundancy per structure
− Full/no results
− decoupled from the Component Systems
− Best of bread per backend system
− GDA master expects nodes to be not
available at query runtime
− Nodes with normal HA characteristics
− decoupled from the Component
Systems
− Best of breed per Backend
System
Data
Model
− Global Model − Master and Nodes share a common data-
model
− Independent local Schema extensions
− Distribution models supported very
similar to cluster (COLOCATION,
EVERYWHERE replicated dimension
tables)
− joint View on component data
model
Execution − MPP
− Data Structure aware
− Computation next to data
− Data-aware engine optimizations during
query executions
− Node-local, partition centric workload
− query results can be fully or partially
computed remotely
− Queries against the virtual data
model
− Translation for different
components
− No Coupling and Optimization as
in a native cluster possible
Problem