Embed Size (px)
Citation preview
Transportation Research Part A 38 (2004) 201–222www.elsevier.com/locate/tra
What type of vehicle do people drive? The role of attitudeand lifestyle in influencing vehicle type choice
Sangho Choo a,1, Patricia L. Mokhtarian a,b,*
a Department of Civil and Environmental Engineering, University of California, Davis, CA 95616, USAb Institute of Transportation Studies, University of California, One Shields Avenue, Davis, CA 95616, USA
Received 5 August 2002; received in revised form 5 August 2002; accepted 9 October 2003
Abstract
Traditionally, economists and market researchers have been interested in identifying the factors that affect
consumers� car buying behaviors to estimate market share, and to that end they have developed various
models of vehicle type choice. However, they do not usually consider consumers� travel attitudes, person-ality, lifestyle, and mobility as factors that may affect the vehicle type choice. The purpose of this study is toexplore the relationship of such factors to individuals� vehicle type choices, and to develop a disaggregate
choice model of vehicle type based on these factors as well as typical demographic variables. The data for this
study comes from a 1998 mail-out/mail-back survey of 1904 residents in the San Francisco Bay Area. The
dependent variable (the vehicle type the respondent drives most often) is classified into nine categories: small,
compact, mid-sized, large, luxury, sports, minivan/van, pickup, and sport utility vehicle. Based on these
categories, we first related vehicle type to travel attitude, personality, lifestyle, mobility, and demographic
variables individually, using one-way analysis of variance and chi-squared tests. Then, a multinomial logit
model for vehicle type choice was estimated. The final model (which possessed the IIA property) confirmedthat the variables analyzed significantly affect an individual�s vehicle type choice. These results provide usefulbackground not only to vehicle manufacturers, but also to decision makers and planners of transportation
policy related to vehicle ownership, traffic congestion, and energy consumption.
� 2003 Elsevier Ltd. All rights reserved.
1. Introduction
The US is a highly motorized society. As such, each year nearly 200 new vehicle models areproduced by domestic and foreign vehicle manufacturers, and millions of new vehicles are sold.
* Corresponding author. Tel.: +1-530-752-7062; fax: +1-530-752-7872.
E-mail addresses: [email protected] (S. Choo), [email protected] (P.L. Mokhtarian).1 Tel.: +1-530-754-7421; fax: +1-530-752-6572.
0965-8564/$ - see front matter � 2003 Elsevier Ltd. All rights reserved.
doi:10.1016/j.tra.2003.10.005
202 S. Choo, P.L. Mokhtarian / Transportation Research Part A 38 (2004) 201–222
There is a wide range of makes and models, and people make choices based on their own pref-erences and needs when choosing which car to buy. Historically, different vehicle types have beenpopular in various time periods: for example, small and compact cars in the mid-1970s, minivansin the 1980s, pickups/sport utility vehicles in the 1990s. What determines the preference for andchoice of a certain kind of car? What characteristics do people who drive the same kind of carhave in common? What can attitudes, personality, and lifestyle characteristics tell us about vehicletype choices, compared to the role of demographics?Traditionally, economists and market researchers have been interested in identifying the factors
that affect consumers� car buying behaviors to estimate market share, and to that end they havedeveloped various models of vehicle type choice. Specifically, such disaggregate choice models asmultinomial logit (e.g. Lave and Train, 1979; Manski and Sherman, 1980; Mannering andWinston, 1985; Kitamura et al., 2000) and nested logit (e.g. Hocherman et al., 1983; Berkovec andRust, 1985; Berkovec, 1985; Mannering et al., 2002) have been used to explain vehicle type choice.These models are generally focused on vehicle attributes (such as operating and capital costs,horsepower, and fuel efficiency), household characteristics (such as number of household mem-bers, number of vehicles, and household income), and principal driver characteristics (such as age,education, and income) (Train, 1986; Golob et al., 1997). However, they do not usually considerconsumers� travel attitudes, personality, lifestyle, and mobility as factors that may affect thevehicle type choice.Of course, there are stereotypes for what kind of person drives a certain vehicle make and
model, assuming that attitudes influence the vehicle type choice. However, a better understandingof the relationships between travel attitude, personality, or lifestyle factors and vehicle typechoices will improve vehicle type choice models. Furthermore, although perhaps not directlysusceptible to policy intervention, a better understanding of these relationships will be usefulbackground for decision makers and transportation planners developing transportation policiesrelated to vehicle ownership, traffic congestion, and energy consumption. For example, it is rel-evant to learn, as our study found, that those with strong ‘‘pro-high density’’ attitudes––and whotherefore might be amenable to living in a neo-traditional residential neighborhood––are alsomore likely to be driving a sport utility vehicle (SUV) or a luxury car, neither of which aregenerally fuel-efficient alternatives.The purpose of this study is to explore the travel attitude, personality, lifestyle, and mobility
factors that affect individuals� vehicle type choices, and to develop a disaggregate choice model ofvehicle type based on these factors as well as typical demographic variables. The data for thisstudy comes from a 1998 mail-out/mail-back survey of 1904 residents in the San Francisco BayArea. The dependent variable, make and model of the vehicle the respondent drives most often, isclassified into nine vehicle type categories: small, compact, mid-sized, large, luxury, sports,minivan/van, pickup, and SUV. Based on these vehicle categories, we explore questions such ashow travel attitude affects type of vehicle driven, what kind of person chooses a particular vehicletype, or whether mobility affects the type of vehicle driven.The following section discusses key literature related to vehicle type choice models. Then, we
describe the characteristics of our sample, the vehicle classification we used in this study, and keyexplanatory variables included in the vehicle type choice model. We next present descriptiveanalyses relating vehicle type to travel attitude, personality, lifestyle, mobility, and demographicvariables individually, using one-way analysis of variance and chi-squared tests, and then a
S. Choo, P.L. Mokhtarian / Transportation Research Part A 38 (2004) 201–222 203
multinomial logit model for vehicle type choice is developed. Finally, conclusions and limitationsare discussed.
2. Review of relevant literature
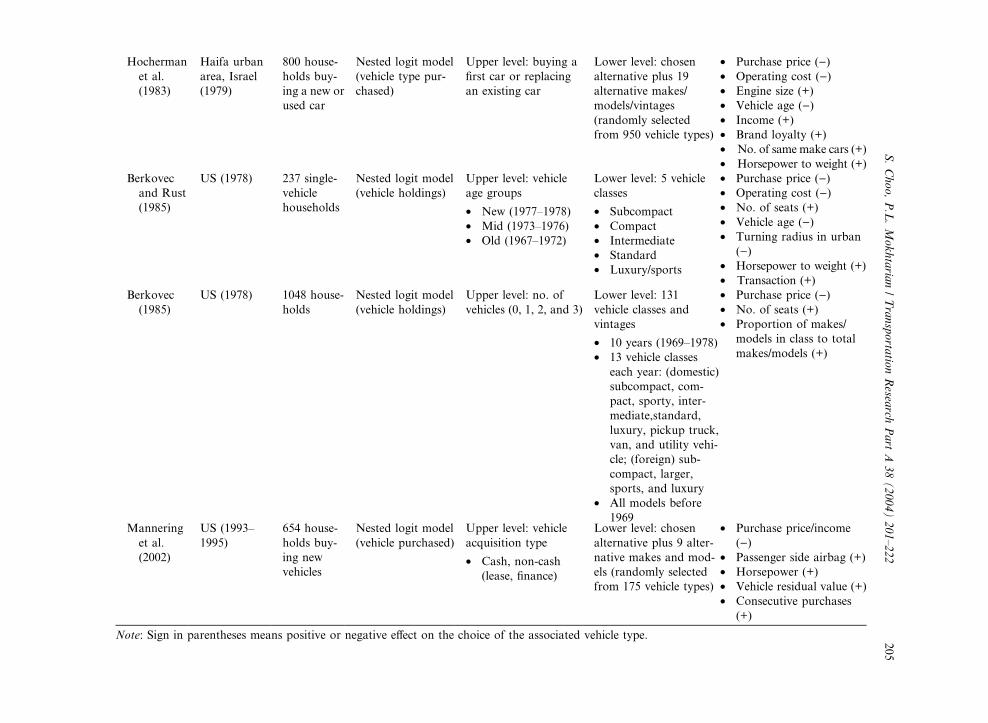
Most published studies of vehicle type choice concentrate on vehicle attributes, household andprimary driver characteristics, and brand loyalty. There is little open literature on vehicle typechoice focusing on travel attitude, personality, and lifestyle factors (there are doubtless numerousproprietary studies of the role of these factors in vehicle type choice). Nevertheless, the review ofthis topic is helpful in identifying the types of models that have been used in this area, and theexplanatory variables that have previously been found to affect vehicle type choice.Table 1 summarizes the vehicle type choice models reviewed, comparing model types, dependent
variables, significant explanatory variables, and data. As mentioned before, disaggregate choicemodels (multinomial logit and nested logit) are generally used for the vehicle type choice, andvehicle and household characteristics generally constitute the explanatory variables in the models.These vehicle type choice models can be further divided into two categories, vehicle holdings andvehicle purchase models, depending on whether the chosen vehicle type is viewed as already ownedor newly purchased. In contrast to those for vehicle purchase, the models for vehicle holdingsusually include scrappage rate, transaction cost, and vehicle age as explanatory variables.However, it is difficult to compare significant variables across the vehicle type choice models
because each model has a different set of vehicle type categories such as vehicle classes and makes/models. Not surprisingly, the most common variable is vehicle price, which is significant across allmodels except Kitamura et al. (2000). That is, all else equal, the more a vehicle costs, the lower itschoice probability. Of greatest interest to the present study is the impact of demographic variableson vehicle type choice, with income, age, gender, and number of household members positivelyaffecting the choice probability of vehicle type in one or more models.The data used in our study were not collected with a vehicle type choice model in mind, so we
do not have a full inventory of all households� vehicles, including their acquisition history. Wehave only the make, model, and year of the single vehicle driven most often by the respondent.However, in addition to the demographic characteristics normally used in vehicle type choicemodels, we have unique data on attitudes, personality, and lifestyle that are also relevant tovehicle choice. In this study, then, we develop models of most-often-driven vehicle class using thefull range of individual characteristics available in our data set. Over a large enough sample, onewould expect the distribution of vehicle types driven most often to roughly reflect the distributionof vehicle holdings (and in fact that distribution is identical for single-vehicle households). In anycase, the distribution of vehicle types driven most often is arguably the most directly relevant(better even than the distribution of vehicles newly-purchased) to analyzing the consequential fuelconsumption and emissions.
3. Data
The data for this study come from a 14-page mail-out/mail-back survey containing questionsabout attitudes toward travel, lifestyle and personality, mobility, travel liking, and demographics.
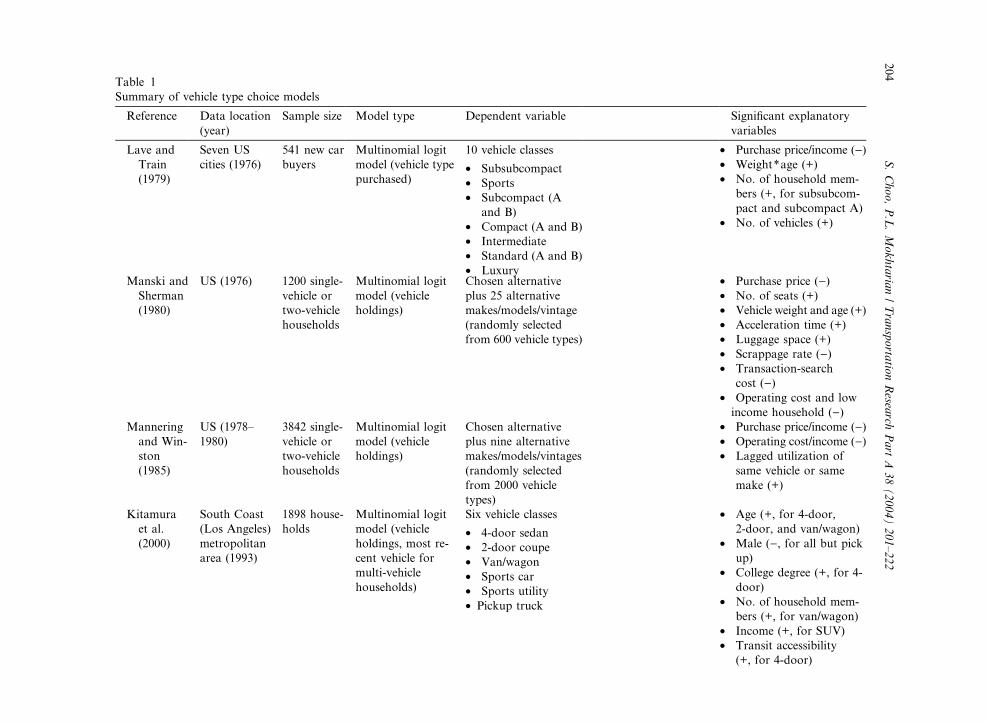
Table 1
Summary of vehicle type choice models
Reference Data location
(year)
Sample size Model type Dependent variable Significant explanatory
variables
Lave and
Train
(1979)
Seven US
cities (1976)
541 new car
buyers
Multinomial logit
model (vehicle type
purchased)
10 vehicle classes
• Subsubcompact
• Sports
• Subcompact (A
and B)
• Compact (A and B)
• Intermediate
• Standard (A and B)
• Luxury
• Purchase price/income ())• Weight*age (+)
• No. of household mem-
bers (+, for subsubcom-
pact and subcompact A)
• No. of vehicles (+)
Manski and
Sherman
(1980)
US (1976) 1200 single-
vehicle or
two-vehicle
households
Multinomial logit
model (vehicle
holdings)
Chosen alternative
plus 25 alternative
makes/models/vintage
(randomly selected
from 600 vehicle types)
• Purchase price ())• No. of seats (+)
• Vehicle weight and age (+)
• Acceleration time (+)
• Luggage space (+)
• Scrappage rate ())• Transaction-search
cost ())• Operating cost and low
income household ())Mannering
and Win-
ston
(1985)
US (1978–
1980)
3842 single-
vehicle or
two-vehicle
households
Multinomial logit
model (vehicle
holdings)
Chosen alternative
plus nine alternative
makes/models/vintages
(randomly selected
from 2000 vehicle
types)
• Purchase price/income ())• Operating cost/income ())• Lagged utilization of
same vehicle or same
make (+)
Kitamura
et al.
(2000)
South Coast
(Los Angeles)
metropolitan
area (1993)
1898 house-
holds
Multinomial logit
model (vehicle
holdings, most re-
cent vehicle for
multi-vehicle
households)
Six vehicle classes
• 4-door sedan
• 2-door coupe
• Van/wagon
• Sports car
• Sports utility
• Pickup truck
• Age (+, for 4-door,
2-door, and van/wagon)
• Male (), for all but pickup)
• College degree (+, for 4-
door)
• No. of household mem-
bers (+, for van/wagon)
• Income (+, for SUV)
• Transit accessibility
(+, for 4-door)
204
S.Choo,P.L.Mokhtaria
n/Transporta
tionResea
rchPart
A38(2004)201–222
Hocherman
et al.
(1983)
Haifa urban
area, Israel
(1979)
800 house-
holds buy-
ing a new or
used car
Nested logit model
(vehicle type pur-
chased)
Upper level: buying a
first car or replacing
an existing car
Lower level: chosen
alternative plus 19
alternative makes/
models/vintages
(randomly selected
from 950 vehicle types)
• Purchase price ())• Operating cost ())• Engine size (+)
• Vehicle age ())• Income (+)
• Brand loyalty (+)
• No. of same make cars (+)
• Horsepower to weight (+)
Berkovec
and Rust
(1985)
US (1978) 237 single-
vehicle
households
Nested logit model
(vehicle holdings)
Upper level: vehicle
age groups
• New (1977–1978)
• Mid (1973–1976)
• Old (1967–1972)
Lower level: 5 vehicle
classes
• Subcompact
• Compact
• Intermediate
• Standard
• Luxury/sports
• Purchase price ())• Operating cost ())• No. of seats (+)
• Vehicle age ())• Turning radius in urban
())• Horsepower to weight (+)
• Transaction (+)
Berkovec
(1985)
US (1978) 1048 house-
holds
Nested logit model
(vehicle holdings)
Upper level: no. of
vehicles (0, 1, 2, and 3)
Lower level: 131
vehicle classes and
vintages
• 10 years (1969–1978)
• 13 vehicle classes
each year: (domestic)
subcompact, com-
pact, sporty, inter-
mediate,standard,
luxury, pickup truck,
van, and utility vehi-
cle; (foreign) sub-
compact, larger,
sports, and luxury
• All models before
1969
• Purchase price ())• No. of seats (+)
• Proportion of makes/
models in class to total
makes/models (+)
Mannering
et al.
(2002)
US (1993–
1995)
654 house-
holds buy-
ing new
vehicles
Nested logit model
(vehicle purchased)
Upper level: vehicle
acquisition type
• Cash, non-cash
(lease, finance)
Lower level: chosen
alternative plus 9 alter-
native makes and mod-
els (randomly selected
from 175 vehicle types)
• Purchase price/income
())• Passenger side airbag (+)
• Horsepower (+)
• Vehicle residual value (+)
• Consecutive purchases
(+)
Note: Sign in parentheses means positive or negative effect on the choice of the associated vehicle type.
S.Choo,P.L.Mokhtaria
n/Transporta
tionResea
rchPart
A38(2004)201–222
205
206 S. Choo, P.L. Mokhtarian / Transportation Research Part A 38 (2004) 201–222
The surveys were sent to 8000 randomly selected households in three neighborhoods of the SanFrancisco Bay Area in May and June, 1998: Concord, Pleasant Hill, and an area defined as NorthSan Francisco. Here, as defined by Kitamura et al. (1994), Concord and Pleasant Hill representsuburban neighborhoods, and North San Francisco represents an urban neighborhood. NorthSan Francisco has more mixed land uses, higher residential density, and a more grid-like streetsystem compared to the suburban examples. On the other hand, Concord has more segregatedland uses and lower residential density. Pleasant Hill was selected to represent another part of thespectrum of suburban neighborhoods. Compared to Concord, Pleasant Hill has greater resi-dential density, indicating fewer single-family homes.Half of the total surveys were sent to North San Francisco and the other half were divided
evenly between Concord and Pleasant Hill. Approximately 2000 surveys were completed by arandomly-selected adult member of the household (the person age 18 or older whose birthday wasclosest to the cover letter date) and returned. After screening out surveys with too much missingdata on key variables, we were left with 1904 surveys for an overall response rate of 23.8% (22.2%for North San Francisco, 23.7% for Concord and 27.2% for Pleasant Hill).
4. The key variables
4.1. The dependent variable
One question on the survey asked for the make, model, and year of the vehicle the respondentdrives most often, with a ‘‘not applicable’’ response for completeness. In a previous study on thesedata, Curry (2000) created a vehicle type variable based on vehicle makes and models. The makesand models were classified into ten categories mostly based on the classification scheme presentedin Consumer Reportsmagazine (1956–1998): subcompact, small, compact, 2 mid-sized (at one timereferred to as ‘‘medium’’ by Consumer Reports), large, luxury, sports, minivan/van, pickup, andSUV. He also assumed (as we do) that the Consumer Reports� classification scheme accuratelyreflects consumer perception, even though the definition of categories has changed from year toyear. 3 That is, a make/model combination is classified according to its Consumer Reports des-ignation for that model year, even if the same make and model are classified differently today.Table 2 shows some other vehicle classification schemes found in the academic literature and instatistical reports. These schemes are focused on vehicle size, vehicle function, or both. Similar tothe Consumer Reports classification system, most schemes of vehicle classification first groupvehicles by size, and then special categories such as sports, pickup, and SUV are added.
2 Consumer Reports distinguished compact and mid-sized cars by saying that compact cars are ‘‘models that offer
practical transportation for a small family’’, while mid-sized cars are models that are ‘‘bigger and roomier than
compacts but priced about the same’’ (Consumer Reports, April 1991, p. 246).3 Some vehicle categories used by Consumer Reports have entered and dropped out in particular time periods. For
example, the ‘‘subcompact car’’ classification has not been used since 1980, while ‘‘sports car’’ and ‘‘SUV’’ were created
in 1984 and 1990, respectively. In particular, the size of a ‘‘mid-sized car’’ has not been consistent across all time
periods, especially in periods without a ‘‘compact car’’ category (1980–1983 and 1995–1998).
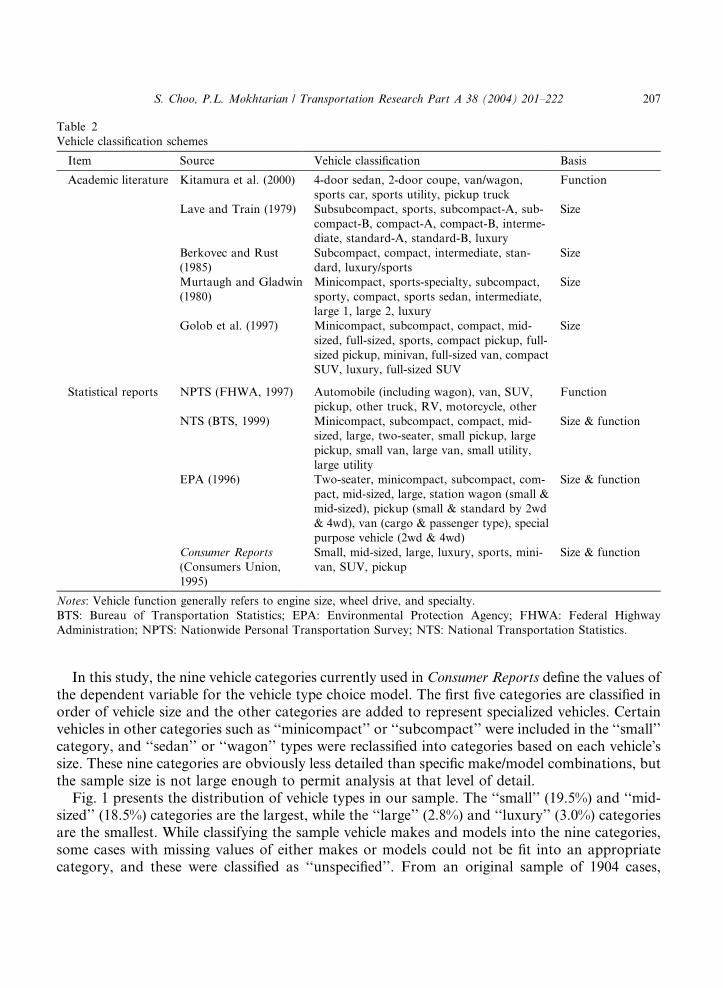
Table 2
Vehicle classification schemes
Item Source Vehicle classification Basis
Academic literature Kitamura et al. (2000) 4-door sedan, 2-door coupe, van/wagon,
sports car, sports utility, pickup truck
Function
Lave and Train (1979) Subsubcompact, sports, subcompact-A, sub-
compact-B, compact-A, compact-B, interme-
diate, standard-A, standard-B, luxury
Size
Berkovec and Rust
(1985)
Subcompact, compact, intermediate, stan-
dard, luxury/sports
Size
Murtaugh and Gladwin
(1980)
Minicompact, sports-specialty, subcompact,
sporty, compact, sports sedan, intermediate,
large 1, large 2, luxury
Size
Golob et al. (1997) Minicompact, subcompact, compact, mid-
sized, full-sized, sports, compact pickup, full-
sized pickup, minivan, full-sized van, compact
SUV, luxury, full-sized SUV
Size
Statistical reports NPTS (FHWA, 1997) Automobile (including wagon), van, SUV,
pickup, other truck, RV, motorcycle, other
Function
NTS (BTS, 1999) Minicompact, subcompact, compact, mid-
sized, large, two-seater, small pickup, large
pickup, small van, large van, small utility,
large utility
Size & function
EPA (1996) Two-seater, minicompact, subcompact, com-
pact, mid-sized, large, station wagon (small &
mid-sized), pickup (small & standard by 2wd
& 4wd), van (cargo & passenger type), special
purpose vehicle (2wd & 4wd)
Size & function
Consumer Reports
(Consumers Union,
1995)
Small, mid-sized, large, luxury, sports, mini-
van, SUV, pickup
Size & function
Notes: Vehicle function generally refers to engine size, wheel drive, and specialty.
BTS: Bureau of Transportation Statistics; EPA: Environmental Protection Agency; FHWA: Federal Highway
Administration; NPTS: Nationwide Personal Transportation Survey; NTS: National Transportation Statistics.
S. Choo, P.L. Mokhtarian / Transportation Research Part A 38 (2004) 201–222 207
In this study, the nine vehicle categories currently used in Consumer Reports define the values ofthe dependent variable for the vehicle type choice model. The first five categories are classified inorder of vehicle size and the other categories are added to represent specialized vehicles. Certainvehicles in other categories such as ‘‘minicompact’’ or ‘‘subcompact’’ were included in the ‘‘small’’category, and ‘‘sedan’’ or ‘‘wagon’’ types were reclassified into categories based on each vehicle�ssize. These nine categories are obviously less detailed than specific make/model combinations, butthe sample size is not large enough to permit analysis at that level of detail.Fig. 1 presents the distribution of vehicle types in our sample. The ‘‘small’’ (19.5%) and ‘‘mid-
sized’’ (18.5%) categories are the largest, while the ‘‘large’’ (2.8%) and ‘‘luxury’’ (3.0%) categoriesare the smallest. While classifying the sample vehicle makes and models into the nine categories,some cases with missing values of either makes or models could not be fit into an appropriatecategory, and these were classified as ‘‘unspecified’’. From an original sample of 1904 cases,
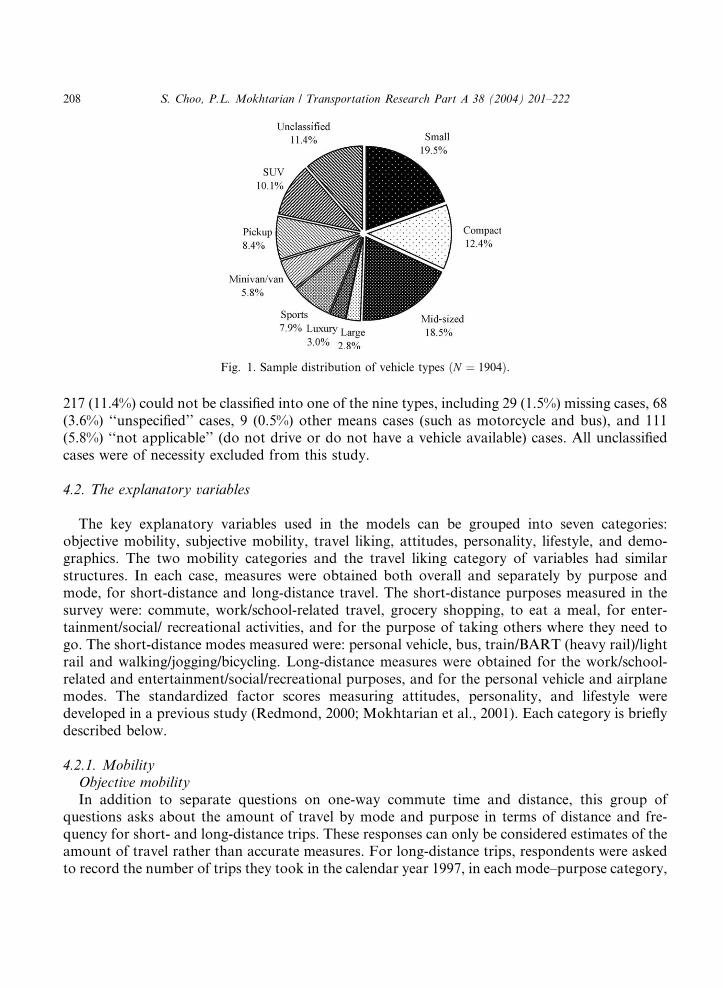
Fig. 1. Sample distribution of vehicle types ðN ¼ 1904Þ.
208 S. Choo, P.L. Mokhtarian / Transportation Research Part A 38 (2004) 201–222
217 (11.4%) could not be classified into one of the nine types, including 29 (1.5%) missing cases, 68(3.6%) ‘‘unspecified’’ cases, 9 (0.5%) other means cases (such as motorcycle and bus), and 111(5.8%) ‘‘not applicable’’ (do not drive or do not have a vehicle available) cases. All unclassifiedcases were of necessity excluded from this study.
4.2. The explanatory variables
The key explanatory variables used in the models can be grouped into seven categories:objective mobility, subjective mobility, travel liking, attitudes, personality, lifestyle, and demo-graphics. The two mobility categories and the travel liking category of variables had similarstructures. In each case, measures were obtained both overall and separately by purpose andmode, for short-distance and long-distance travel. The short-distance purposes measured in thesurvey were: commute, work/school-related travel, grocery shopping, to eat a meal, for enter-tainment/social/ recreational activities, and for the purpose of taking others where they need togo. The short-distance modes measured were: personal vehicle, bus, train/BART (heavy rail)/lightrail and walking/jogging/bicycling. Long-distance measures were obtained for the work/school-related and entertainment/social/recreational purposes, and for the personal vehicle and airplanemodes. The standardized factor scores measuring attitudes, personality, and lifestyle weredeveloped in a previous study (Redmond, 2000; Mokhtarian et al., 2001). Each category is brieflydescribed below.
4.2.1. MobilityObjective mobility
In addition to separate questions on one-way commute time and distance, this group ofquestions asks about the amount of travel by mode and purpose in terms of distance and fre-quency for short- and long-distance trips. These responses can only be considered estimates of theamount of travel rather than accurate measures. For long-distance trips, respondents were askedto record the number of trips they took in the calendar year 1997, in each mode–purpose category,
S. Choo, P.L. Mokhtarian / Transportation Research Part A 38 (2004) 201–222 209
by region of the world. These responses indicated number of trips directly, and were also con-verted into approximate distances by measuring from a central position in the Bay Area to acentral location within the destination region. Then, we created three different measures of dis-tance: total miles (the simple sum of the estimated miles for each reported trip in the category), logof miles (the natural logarithm of one plus the total number of miles in the category), and sum ofthe log-miles (obtained by taking the natural logarithm of one plus the number of miles of eachtrip in the category separately, and summing across all trips in the category).The latter two measures represent a diminishing marginal contribution of distance, with the last
one giving some weight to trips as well as distance. The sum of the natural log of miles for eachtrip gives more weight to a larger number of trips traveling the same number of miles, comparedto the natural log of the total miles. For example, the natural log of total travel for nine trips toWestern States ðln½9� 700þ 1� ¼ 8:75Þ is roughly the same as that for one trip to Asiaðln½1� 7500þ 1� ¼ 8:92Þ. However, summing the natural log of each trip (the third measure)results in values of 58.97 ð¼ 9� ln½700þ 1�Þ for the Western States trips and 8.92 ð¼ 1�ln½7500þ 1�Þ for the Asia trip. This reflects the idea that each trip comes with a certain amount of‘‘effort overhead’’ that is not directly proportional to its length, and thus the nine Western Statestrips carry greater weight than the single Asia trip (adapted from Curry, 2000).The hypothesized relationships of objective mobility to vehicle type are indirect, with mobility
serving as an indicator or proxy for an underlying cause or effect. For example, those who travel alot by airplane may be more likely to drive a comfortable or expensive car (luxury category)because both characteristics are indicative of a high-income lifestyle, or because frequent flyersmay place a higher value on comfort and time while traveling. One could also speculate thatvehicle type affects objective mobility as well. However, a previous study (Redmond and Mo-khtarian, 2001; Mokhtarian et al., 2001) of objective mobility using the same data set found thatactual amounts of travel (e.g. weekly miles traveled) are significantly affected not by vehicle typebut by travel attitudes, personality, and lifestyle in addition to demographic variables such asincome and household size.
Subjective mobilityWe are interested not only in the objective amount an individual travels, but also in how that
amount of travel is perceived. One person may consider 100 miles a week to be a lot, while anotherconsiders it minimal. For each of the same overall, purpose, and mode categories for short- andlong-distance, respondents were asked to rate the amount of their travel on a five-point semantic-differential scale anchored by ‘‘none’’ to ‘‘a lot’’. The previous study (Collantes and Mokhtarian,2002) that modeled these variables shows that objective mobility is strongly positively related tosubjective mobility, accounting for more than 50% of the variance explained by each model. Thus,we expect that subjective mobility has effects on vehicle type that are similar to those of objectivemobility. It can also be hypothesized that those who perceive they do a lot of travel may be morelikely to use a larger, more powerful, and/or more luxurious car (pickup, luxury, sports, and SUVcategories) in order to accomplish their travel more comfortably.
4.2.2. Travel liking
These questions ask how much respondents enjoy traveling itself (distinguished in the surveyinstructions from the activity at the destination), for each of the same overall, purpose, and modecategories for short- and long-distance. All responses are rated on a five-point scale ranging from
210 S. Choo, P.L. Mokhtarian / Transportation Research Part A 38 (2004) 201–222
‘‘strongly dislike’’ to ‘‘strongly like’’. The hypothesized relationship of travel liking to vehicle typeis ambiguous. Those who dislike travel may be more likely to use a larger and more comfortablecar (large and luxury categories) to make the unpleasantness of travel more palatable, whereasthose who like their travel may prefer similar kinds of cars, to make their travel even moreenjoyable.
4.2.3. Attitudes
The survey contained 32 attitudinal statements related to travel, land use, and the environment,to which individuals responded on the five-point Likert-type scale from ‘‘strongly disagree’’ to‘‘strongly agree’’. These 32 variables were then distilled, through factor analysis, into six under-lying dimensions: travel dislike, pro-environmental solutions, commute benefit, travel freedom,travel stress, and pro-high density. (For details on the definition of these and the personality andlifestyle factors, see Redmond, 2000 or Mokhtarian et al., 2001. When discussing results below, weprovide further information on the nature of the significant factors.)Alternate hypotheses are plausible. On the one hand, an individual may enjoy traveling because
she drives a luxurious car, or a fun car (sports or SUV categories). Or, an innate love of travel mayprompt a person to buy a car that supports that feeling. On the other hand, those who dislike travelmay be more likely to use a larger car (large, luxury, and SUV categories) because they seek to bemore comfortable and to minimize travel fatigue even for short-distance trips. Those who have thefreedom to travel anywhere they want and relatively low travel stress may be more likely to use amore powerful car or a leisure car (sports and SUV categories). Those who strongly support pro-environmental policies are more likely to prioritize reducing mobile source emissions and thereforeto drive a smaller car (small and compact categories). Those who like living in high-density areasmay choose a smaller car (small and compact categories) because they have accessible public transitand restrictions on parking, making them less likely to commute by car. Those who recognizebenefits of commuting may be more likely to use a more comfortable or versatile car (luxurycategory) that allows them to do other activities such as playing CDs while driving.
4.2.4. PersonalityRespondents were asked to indicate how well (on a five-point scale from ‘‘hardly at all’’ to
‘‘almost completely’’) each of 17 words and phrases described their personality. Each of thesetraits was hypothesized to relate in some way to one�s orientation toward travel, or to reasons forwanting to travel for its own sake. These 17 attributes reduced to four personality factors:adventure seeker, organizer, loner, and the calm personality. We expect that adventure seekersmay be more likely to use a powerful car (sports and SUV categories) that fits their self-imageand/or allows them the flexibility needed for a variety of activities and outdoor adventures.Conversely, calm people may be less likely to use such car types, which are typically associatedwith more aggressive drivers. Loners are probably less likely to use a family car (minivan/vancategory).
4.2.5. Lifestyle
The survey contained 18 Likert-type scale statements relating to work, family, money, statusand the value of time. These 18 questions comprised four lifestyle factors: status seeker, worka-holic, family/community-oriented, and a frustrated factor. Several hypotheses can be made.

S. Choo, P.L. Mokhtarian / Transportation Research Part A 38 (2004) 201–222 211
Frustrated people may be less likely to use a more powerful car (sports and SUV categories)because such cars may be a symbol of confidence and control. Family-oriented people are pre-sumably more likely to use a family car (minivan/van category). Status seekers are more likely todrive an expensive car (luxury and sports categories) because such cars are common statussymbols in modern society.
4.2.6. Demographics
The demographic variables include neighborhood, gender, age, education and employmentinformation, and household information such as number of people in the household, their agegroup, and personal and household income.
5. Descriptive analyses
We conducted descriptive analyses using one-way analysis of variance (ANOVA) andchi-squared tests to identify statistical differences among groups classified by vehicle type. TheANOVA test was used for continuous or quasi-continuous variables such as the travel attitude,personality, lifestyle, mobility, and travel liking variables, while the chi-squared test was used forcategorical variables such as gender or neighborhood. (Although the five-point subjective mobilityand travel liking scales are, strictly speaking, purely ordinal variables, it is common practice totreat such variables as effectively continuous, i.e. ratio-scaled, by assigning them equally-spacedinteger values, combining them into composite scales through simple addition or more complexapproaches such as factor analysis, and so on––see e.g. Babbie, 1998.) The Bonferroni multiplecomparisons test was additionally conducted for the variables that had statistical differencesamong vehicle type groups based on the ANOVA test, to identify which categories are signifi-cantly different from other categories.Here, we briefly summarize the key characteristics associated with each vehicle type, focusing
on the variables that are significantly different among vehicle type groups at a level of a ¼ 0:05(see Choo and Mokhtarian, 2002 for a more detailed discussion). All vehicle type groups, exceptthe mid-sized car group, have distinct characteristics with respect to the key variables. The mid-sized car group tends to be ‘‘middle-of-the-road’’ in its characteristics. Also, no significant dif-ferences across vehicle types were found with respect to the commute time and commute distancevariables. The distinct characteristics for each vehicle category are as follows:
• Small car. Small car drivers tend to have stronger pro-environmental (supporting environmen-tal solutions to improve air quality and reduce congestion) and pro-high density (preferringhigher-density residential locations like urban neighborhoods) attitudes, and a weaker travelfreedom (representing the ability to ‘‘go anywhere I want to’’) attitude. They tend to be loners(who ‘‘like being alone’’), and not workaholics (who put a high priority on work) or status seek-ers (who seek higher social status related to wealth and want to display their wealth). Addition-ally, small car drivers tend to perceive themselves as traveling less for short-distance trips in apersonal vehicle than others do, and are less likely to enjoy personal vehicle travel. In terms ofdemographic characteristics, the small car driver group has higher than average proportions ofNorth San Francisco residents, females, people age 40 or younger, and people with 4-year
212 S. Choo, P.L. Mokhtarian / Transportation Research Part A 38 (2004) 201–222
college degrees. It also has higher proportions in clerical or professional jobs, and lower in-comes. In particular, small car drivers are overrepresented in single-vehicle and single-adulthouseholds.
• Compact car. Compact car drivers tend to have a weaker travel freedom attitude, and travel lessfor long-distance trips by personal vehicle. They tend to perceive that they travel less by per-sonal vehicle and overall short-distance. Similar to small car drivers, the compact car drivergroup has higher proportions in professional jobs and single-vehicle households. In addition,they are overrepresented in middle income categories, and especially in single-adult households.
• Mid-sized car. Mid-sized car drivers have no distinct travel attitude, personality, lifestyle,mobility, or travel liking characteristics. On demographic traits, mid-sized car drivers are morelikely than average to be females or homemakers, and to have higher incomes or larger house-holds.
• Large car. In contrast to small car drivers, large car drivers tend to have weaker pro-environ-mental and pro-high density attitudes. They are also more likely to be Concord residents,males, older or retired people, and part-time employees. Interestingly, large car drivers areoverrepresented among less educated or lower income people. They are also overrepresentedin multi-vehicle or older-adult households. We speculate that the large cars driven by thesegroups may tend to be second-hand.
• Luxury car. Luxury car drivers are more likely to be status seekers, and to travel long-distanceby airplane a lot. They are more likely to be North San Francisco residents, males, and older orretired people. In particular, luxury car drivers are overrepresented among highly educated orhigher income people. Similar to large car drivers, the luxury car driver group has higher thanaverage proportions in multi-vehicle or older-adult households.
• Sports car. Sports car drivers are more likely to be adventure seekers (who are ‘‘adventurous’’,‘‘risk-taking’’, and ‘‘variety-seeking’’), and less likely to be calm (‘‘patient’’ and less ‘‘aggres-sive’’). They are more likely than average to have 4-year college degrees or lower incomes.Additionally, sports car drivers are overrepresented in two-worker or younger-adult house-holds.
• Minivan/van. Minivan drivers tend to have a weaker pro-high density attitude. They tend to becalm, and not to be loners. Minivan drivers tend to perceive that they travel more by personalvehicle and overall short-distance than others do. Further, they tend to enjoy traveling by per-sonal vehicle more than average. In terms of demographics, minivan drivers are more likely tobe Concord residents, females, homemakers, or age 41–64. They also tend to have higherhousehold incomes as well as lower personal incomes. Minivan drivers are overrepresentedin multi-vehicle households or larger households with children.
• Pickup. Pickup drivers tend to have a weaker pro-high density attitude, and are more likely tobe frustrated (feel less in control and less satisfied with their life) and workaholic. Their short-distance travel is higher than average, while their long-distance travel by airplane is lower. Like-wise, pickup drivers tend to perceive their long-distance travel by airplane as lower than othersdo. Demographically, pickup drivers are more likely to be Pleasant Hill residents, males, andage 41–64. They are also overrepresented among lower education levels, full-time employees,service-related jobs, middle incomes, and two-vehicle households.
• SUV. SUV drivers tend to have a stronger travel freedom attitude, and are less likely to be frus-trated. They tend to enjoy short-distance traveling by personal vehicle. Demographically, SUV
S. Choo, P.L. Mokhtarian / Transportation Research Part A 38 (2004) 201–222 213
drivers are more likely to be Pleasant Hill residents and age 40 or younger. They are alsooverrepresented among highly educated or higher income people. Similar to minivan driv-ers, the SUV driver group has a higher than average proportion in larger households withchildren.
6. Modeling vehicle type choice
6.1. Model specification and estimation
In the previous section, we explored whether the explanatory variables individually are sta-tistically different among vehicle type groups. In reality, however, the relationship of one variableto vehicle type can be affected by other variables. The relationship of one variable to vehicle typemay be significant in isolation, but disappear or diminish in importance when the impact of arelated variable is accounted for. Conversely, a simple pairwise relationship may appear insig-nificant due to the counteracting influences of other variables, but become significant when thoseother variables are controlled for. Thus, we developed a disaggregate discrete choice model toestimate the probability of choosing each vehicle type based on the collective effect of factors suchas travel attitude, personality, lifestyle, travel liking, and demographic variables. Since thedependent variable, vehicle type driven most often by the respondent, consisted of nine mutuallyexclusive categories, a multinomial logit model was developed for vehicle type choice. The sta-tistical software package LIMDEP (Greene, 1995) was used to estimate the model.All variables were considered as potential explanatory variables in the initial model specifica-
tion, even though some variables were not significantly different across vehicle type groups basedon the individual analysis using ANOVA and chi-squared tests. We also chose the pickup truckalternative as the base alternative in the model, in view of its relatively distinct characteristicsagainst most other vehicle types. Based on the initial model specification, statistically insignificantvariables were eliminated in stages, and then variations on the subsequent specifications weretested to obtain a final model having all significant explanatory variables (possibly excepting thealternative-specific constants (ASCs), which should be included to correct for sampling bias evenif they are not significant, Manski and Lerman, 1977; Cosslett, 1981). When initial estimationssuggested that some variables had a similar impact on more than one vehicle type, we thenconstrained those coefficients to be equal for the sake of parsimony and to increase the degrees offreedom available in the sample.Through this procedure, the final model with eight ASCs and 40 alternative-specific variables
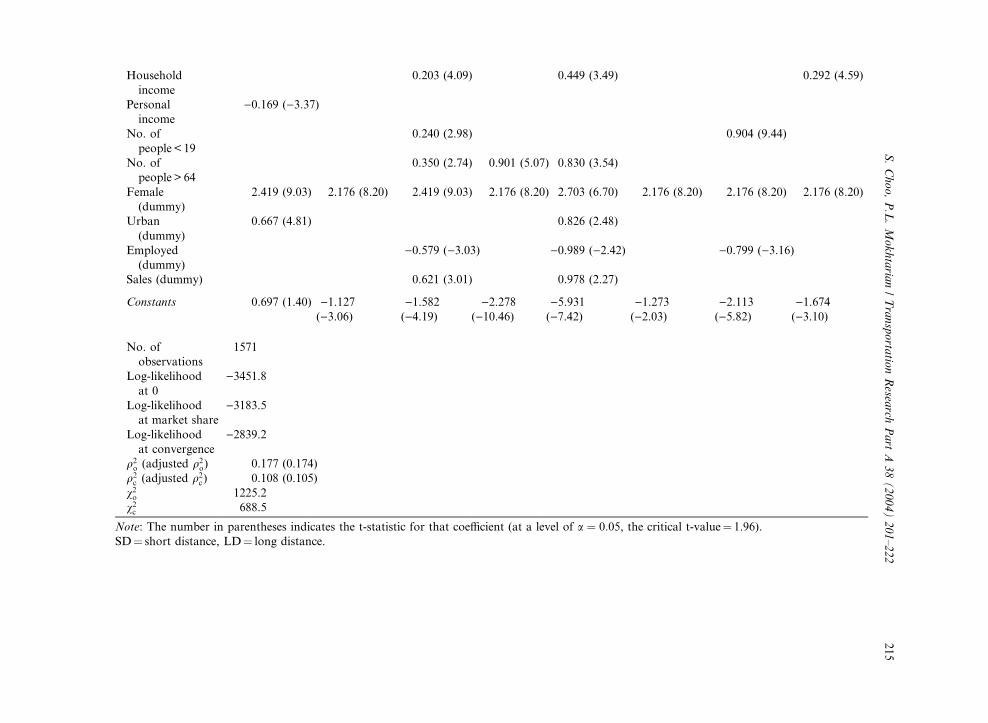
(ASVs), representing 22 different variables, was developed. As shown in Table 3, all explanatoryvariables were statistically significant and conceptually interpretable. Additionally, as a goodness-of-fit test statistic, the v2 value of 1225.2 shows that the final model significantly differs from theequally likely model (in which all coefficients are equal to zero) at a � 0:005.The q2 value of the final model is 0.177, indicating that the model explains 17.7% of the
information in the data. Compared to the q2 value of 0.108 for the market share model (the modelcontaining only constant terms), the final model explains substantially more information, and thev2 value of 688.5 indicates there is a significant difference between the two models at a � 0:005.Further, the q2 value of 0.177 of the final model falls within the range of other models found in the
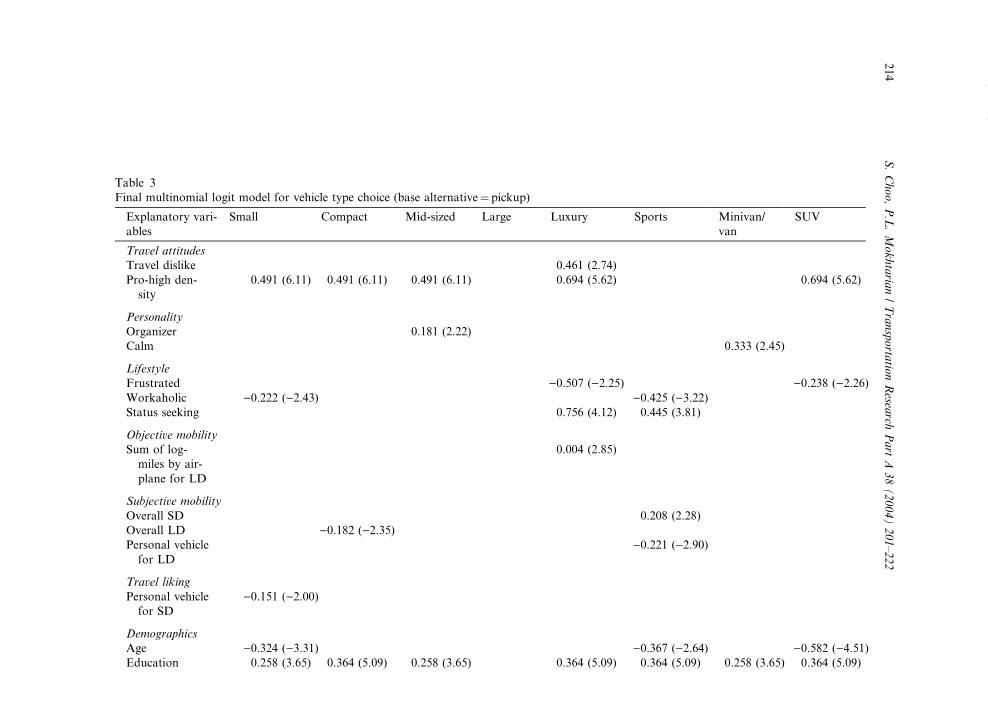
Table 3
Final multinomial logit model for vehicle type choice (base alternative¼ pickup)
Explanatory vari-
ables
Small Compact Mid-sized Large Luxury Sports Minivan/
van
SUV
Travel attitudes
Travel dislike 0.461 (2.74)
Pro-high den-
sity
0.491 (6.11) 0.491 (6.11) 0.491 (6.11) 0.694 (5.62) 0.694 (5.62)
Personality
Organizer 0.181 (2.22)
Calm 0.333 (2.45)
Lifestyle
Frustrated )0.507 ()2.25) )0.238 ()2.26)Workaholic )0.222 ()2.43) )0.425 ()3.22)Status seeking 0.756 (4.12) 0.445 (3.81)
Objective mobility
Sum of log-
miles by air-
plane for LD
0.004 (2.85)
Subjective mobility
Overall SD 0.208 (2.28)
Overall LD )0.182 ()2.35)Personal vehicle
for LD
)0.221 ()2.90)
Travel liking
Personal vehicle
for SD
)0.151 ()2.00)
Demographics
Age )0.324 ()3.31) )0.367 ()2.64) )0.582 ()4.51)Education 0.258 (3.65) 0.364 (5.09) 0.258 (3.65) 0.364 (5.09) 0.364 (5.09) 0.258 (3.65) 0.364 (5.09)
214
S.Choo,P.L.Mokhtaria
n/Transporta
tionResea
rchPart
A38(2004)201–222
Household
income
0.203 (4.09) 0.449 (3.49) 0.292 (4.59)
Personal
income
)0.169 ()3.37)
No. of
people < 19
0.240 (2.98) 0.904 (9.44)
No. of
people > 64
0.350 (2.74) 0.901 (5.07) 0.830 (3.54)
Female
(dummy)
2.419 (9.03) 2.176 (8.20) 2.419 (9.03) 2.176 (8.20) 2.703 (6.70) 2.176 (8.20) 2.176 (8.20) 2.176 (8.20)
Urban
(dummy)
0.667 (4.81) 0.826 (2.48)
Employed
(dummy)
)0.579 ()3.03) )0.989 ()2.42) )0.799 ()3.16)
Sales (dummy) 0.621 (3.01) 0.978 (2.27)
Constants 0.697 (1.40) )1.127()3.06)
)1.582()4.19)
)2.278()10.46)
)5.931()7.42)
)1.273()2.03)
)2.113()5.82)
)1.674()3.10)
No. of
observations
1571
Log-likelihood
at 0
)3451.8
Log-likelihood
at market share
)3183.5
Log-likelihood
at convergence
)2839.2
q2o (adjusted q2
o) 0.177 (0.174)
q2c (adjusted q2
c) 0.108 (0.105)
v2o 1225.2
v2c 688.5
Note: The number in parentheses indicates the t-statistic for that coefficient (at a level of a ¼ 0:05, the critical t-value¼ 1.96).
SD¼ short distance, LD¼ long distance.
S.Choo,P.L.Mokhtaria
n/Transporta
tionResea
rchPart
A38(2004)201–222
215
216 S. Choo, P.L. Mokhtarian / Transportation Research Part A 38 (2004) 201–222
literature, such as a q2 of 0.126 found in Lave and Train (1979) and 0.249 in Kitamura et al.(2000). 4
Turning to the explanatory variables in the final model, the results are similar to those of theindividual tests discussed in the previous section. One difference from the previous results is thattwo travel attitude and personality variables are significant for mid-sized cars. Some demographicvariables are significant for many vehicle type alternatives, which is natural considering that thebase alternative is the pickup. Additionally, the negative signs on all the ASCs except the one forsmall cars (which is not significant) show that the average impact of all unmeasured variables is toreduce the probability of choosing that vehicle type alternative. Especially, the ASC for luxurycars has a much higher magnitude than those for the other vehicle type alternatives, suggestingthat the choice of luxury cars is least well-explained by the available variables.In the following subsections, we first describe the results for each explanatory variable (dis-
cussion by row of Table 3), focusing on its sign and magnitude for a specific vehicle type alter-native. Then, we analyze some key significant variables by vehicle type (discussion by column), todevelop a profile of typical drivers of each kind of vehicle.
6.2. Significant variables
Two travel attitude factors, travel dislike (representing agreement with statements such as‘‘traveling is boring’’ and ‘‘travel time is generally wasted time’’) and pro-high density, are sig-nificant in the model. Those who have a stronger dislike for travel are more likely to drive luxurycars, perhaps to ameliorate the unpleasantness of travel. Interestingly, the pro-high density atti-tude factor has a positive sign both for smaller cars (small, compact, and mid-sized cars) and forexpensive cars (luxury cars and SUVs), with the larger magnitude occurring for the second cat-egory. Those who have a stronger pro-high density attitude (who tend to live in the urbanneighborhood of North San Francisco) may be more likely to drive smaller cars due to theirgreater maneuverability in tight traffic and parking situations. On the other hand, in our samplethose who have a stronger pro-high density attitude are also likely to have higher incomes, so theytend to drive expensive cars.Two of the personality factors, organizer and calm, turn out to be significant in the model.
Interestingly, the organizer personality factor is significant (and positive) only for mid-sized cars.Organizers (who like to be in charge) may be more likely to be mid-level manager types, and henceto drive moderate cars rather than smaller, larger or specialty cars. The calm personality factor issignificant (and positive) only for minivans. That is, calmer people are more likely to driveminivans, suggesting the settled status and maturity of parenthood.All lifestyle factors except family/community oriented are significant in the model. Not sur-
prisingly, the frustrated lifestyle factor has a negative sign for luxury cars and SUVs, although notdriving an expensive car is more likely an indicator of being frustrated for other reasons (or acontributory cause of being frustrated), than a direct consequence of being frustrated. Theworkaholic lifestyle factor has a negative sign for small and sports cars, perhaps because work-
4 These two models have multinomial logit structures and their dependent variables are vehicle type categories (not
makes/models), similar to our final model.

S. Choo, P.L. Mokhtarian / Transportation Research Part A 38 (2004) 201–222 217
aholics are likely to be career-oriented with potentially higher incomes. Additionally, the statusseeking lifestyle factor has a positive sign for luxury and sports cars, as status seekers are likely tothink of their cars as a status symbol.The model also contains four mobility variables and one travel liking variable. For objective
mobility, the sum of the natural log of the miles traveled by airplane for long-distance trips has apositive sign for luxury cars, with both variables being likely consequences of high incomes ratherthan representing direct causality. For subjective mobility, an interesting contrast between shortand long distance appears. Those who think they travel a lot for short distance overall are morelikely to drive sports cars, whereas those who think they travel a lot by personal vehicle for longdistance are less likely to drive sports cars. Similarly, those who think they travel long distance a lotoverall are less likely to drive compact cars. The implication is that compact and sports cars aredesirable for traveling around town, but less comfortable or practical for long trips. The result forcompact cars may also partially represent an income effect (although, since income was also al-lowed to enter the model directly and was not significant for the compact car type, we conclude thatit is not purely an income effect). Those who like traveling by personal vehicle for short distance areless likely to drive a small car. Again, the direction of causality is ambiguous: those who liketraveling by car may be more motivated to invest more money in a vehicle, but the degree of likingfor travel by car may be somewhat influenced by the degree of comfort and amenities offered byone�s current vehicle.Ten demographic characteristics turn out to be significant in the model, in logical ways. The
sign and magnitude of each variable are similar to the results of the individual tests. Therespondent�s age is negatively associated with driving small or sports cars, or SUVs, as expected.Education has a positive sign for all vehicle type categories except large cars, indicating thatdrivers of pickups (the base category) and large cars tend to be less-educated than drivers of theother vehicle types. The household income variable has a positive sign for expensive cars such asluxury cars and SUVs, while the personal income variable has a negative sign for small cars. Thenumber of people in the household under age 19 has a positive sign and highest magnitude forminivans, with a smaller positive coefficient for mid-sized cars. On the other hand, the number ofpeople age 65 or older has a positive sign for larger cars such as large and luxury cars. Similar toeducation, the female variable has a positive sign for all vehicle type categories. That is, all elseequal, females are significantly less likely to drive pickups (the base alternative) than any othervehicle type. As expected, the urban neighborhood variable has a positive sign for small andluxury cars. The employed variable has a negative sign for mid-sized or luxury cars, and minivans.This indicates that unemployed people such as homemakers and retired people may tend to drivefamily vehicles or bigger and more comfortable cars. The sales variable has a positive sign formid-sized and luxury cars, indicating the need for a comfortable vehicle in an occupation ofteninvolving a lot of travel. The coefficient for luxury cars has the higher magnitude of the two,suggestive of the need to appear successful in a sales occupation.
6.3. Vehicle type profiles
Focusing now on each vehicle type (discussion by column), the propensity to drive small cars ishigher for those who have a stronger pro-high density attitude, while those who are workaholicsor do not enjoy personal vehicle travel for short distance are less likely to choose small cars.
218 S. Choo, P.L. Mokhtarian / Transportation Research Part A 38 (2004) 201–222
Additionally, the probability of driving a compact car is higher for those who have a stronger pro-high density attitude, and lower for those who perceive that they have a lot of overall long-distancetravel. Interestingly, the likelihood of driving mid-sized cars is higher for those who have a strongerpro-high density attitude or tend to be organizers. Those who have higher household incomes arealso more likely to choose mid-sized cars, but are even more likely to drive luxury cars and SUVs.In contrast to the individual tests, no travel attitude, personality, lifestyle, mobility, or travel
liking characteristics are significant to choosing large cars. Luxury car drivers, on the other hand,tend to have stronger travel dislike or pro-high density attitudes, to be status seeking, or notfrustrated. With respect to the mobility variables, those who travel long-distance by airplane a lotalso tend to drive luxury cars.Looking at sports cars and SUVs, those who tend to be status seekers, not workaholics, or
younger are more likely to drive sports cars. Sports car drivers also tend to perceive their overallshort-distance travel to be a lot but their long-distance personal vehicle travel to be lower. Thepropensity to drive SUVs is higher for those who have a stronger pro-high density attitude, andlower for those who are frustrated. Conversely, those who tend to be calm are more likely to driveminivans.
6.4. IIA testing
We examined whether the Independence from Irrelevant Alternatives (IIA) assumption of themultinomial logit model is violated for our specification or not by using two types of tests for IIA:the Hausman–McFadden and nested logit (NL) structure tests (Hausman and McFadden, 1984).The former set of tests could not be completed due to the (near) singularity of the V ðrÞ–V ðf Þmatrix, which is a common empirical occurrence (Small and Hsiao, 1985), especially when IIAholds (and therefore V ðrÞ and V ðf Þ are expected to be very similar). The latter tests were con-ducted on 17 conceptual nested structure models (see Choo and Mokhtarian, 2002 for moredetailed information) with two or three levels based on vehicle size (e.g., grouping small andcompact or compact and mid-sized into one nest), and vehicle specialty (e.g., grouping sports,minivan/van, pickup, and SUV or sports and SUV into one nest). Fifteen of those NL models hadinclusive value (IV) parameters statistically equal to one, and the remaining two had IVparameters significantly greater than one, violating theory and requiring that the models bediscarded. Thus, the IIA test results for the NL models strongly suggest that no NL models aresuperior to the final MNL model. That is, the IIA property of the final model holds. Despiteconceptual similarities among the nine vehicle types modeled, this is not necessarily surprisingconsidering the fact that all of our explanatory variables are ASVs. Allowing a variable to bealternative-specific is recommended as one potential solution to IIA violations of a multinomiallogit model (McFadden et al., 1977; Ben-Akiva and Lerman, 1985), since doing so tends to reducecorrelations of the unobserved portions of utility across alternatives.
7. Summary and conclusions
Differing from the traditional vehicle type choice models previously developed by economistsand market researchers, this study identified travel attitude, personality, lifestyle, and mobility
S. Choo, P.L. Mokhtarian / Transportation Research Part A 38 (2004) 201–222 219
factors that affect individuals� vehicle type choices (the type the respondent drives most often),using data from a 1998 mail-out/mail-back survey of 1904 residents in three neighborhoods in theSan Francisco Bay Area. Here, similar to the Consumer Reports classification scheme, vehicle typewas classified into nine categories based on make, model, and vintage of a vehicle: small, compact,mid-sized, large, luxury, sports, minivan/van, pickup, and SUV.Tests of individual variables against vehicle type, using one-way ANOVA and chi-squared
tests, show that all vehicle type groups, except the mid-sized car group, have distinct character-istics with respect to travel attitude, personality, lifestyle, mobility, and demographic variables.Interestingly, the mid-sized car group tends to be ‘‘middle-of-the-road’’ in its characteristics. Onthe other hand, no significant differences across vehicle types were found with respect to thecommute time and commute distance variables.Furthermore, we developed a disaggregate discrete choice model (specifically, a multinomial
logit model) for vehicle type choice to estimate the joint effect of the key variables on the prob-ability of choosing each vehicle type. The final model (with the pickup vehicle type as base) in-cludes 40 significant ASVs representing travel attitude, personality, lifestyle, mobility factors, anddemographic variables together with the eight ASCs.This study has some limitations. The available data did not have detailed information on all
the vehicles in a household, including their acquisition history. Most importantly, we did nothave data on vehicle characteristics (e.g. price, capacity, horsepower) readily available. Thus, itis possible that the novel variables we have included are partially capturing the effects ofthose excluded variables. However, the sizable proportions of unexplained information in thedata, both in our model and in those with more traditional variables, plus the fact that ourincluded variables are highly subjective whereas the excluded variables are objective, suggeststhat it is quite possible that the two sets of variables are capturing relatively different kinds ofdimensions. Clearly, it would be useful to design and execute a study in which both kindsof variables are measured and included in a vehicle type choice model, so that their rela-tive separate and joint (interactive) contributions can be formally assessed. It would also bedesirable to explore segmentation of the vehicle type market, identifying clusters of drivers whoweight various dimensions differently, and analyzing how those taste variations affect vehiclechoice.In any case, our empirical results do support the contention that travel attitudes, personality,
and lifestyle are important to vehicle type choice, in ways that are relevant to transportationplanners and policy-makers as well as vehicle manufacturers. For example, as mentioned in theIntroduction, it is of interest to know that those who might be most likely to live in higher-densitymixed use urban areas are also more likely to drive luxury cars or SUVs (used collectively byabout 15% of our sample who reported driving a car), indicating that a taste for urban living maynot be as strongly associated with a desire for fuel-efficient transportation as new urbanist pro-ponents might wish. The further association of luxury car drivers with a status-seeking lifestyle isno surprise, but suggests that that market segment will be less amenable to policies designed tocurtail the consumption of transportation or fuel. Perhaps more important is the finding that adislike for travel in general is associated with driving a luxury car, possibly to make an undesirableactivity more pleasant. This could have the slightly ominous implication that the worse travelconditions get, the more some people will try to compensate not by curtailing travel, but byincreasing consumption through acquiring a more expensive (and typically less fuel-efficient)
220 S. Choo, P.L. Mokhtarian / Transportation Research Part A 38 (2004) 201–222
vehicle. The finding that those who think they do a lot of long-distance travel are less likely todrive compact cars carries a similar implication.Beyond the specific results of this study, the general conclusion is that future models of vehicle
type choice can be substantially more powerful with the inclusion of travel attitudes, personality,lifestyle, and mobility factors such as the ones analyzed here. On the other hand, there are logicalreasons why such variables are not more often included in travel behavior models. One reason isthat their inclusion makes a survey substantially longer. Second, the design and analysis of anattitudinal survey (using techniques such as factor analysis) involves skills that are not necessarilystandard among travel modelers. Third, the objection is often raised that attitudes and othersubjective variables cannot be easily forecast, and hence future demand as a function of thosevariables also cannot be forecast. These barriers are legitimate, and currently limit the extent towhich the inclusion of attitudinal and related variables is practical for large-scale demand fore-casting models. However, first, this does not negate their usefulness for providing insight intobehavioral relationships beyond what is possible with purely objective variables alone, and thus ata minimum they have an important role to play in behavioral modeling (if not demand fore-casting) studies such as the present one. Second, we believe that the concept of forecasting atti-tudes has been rejected without ever having been seriously attempted. We do not consider itimpossible a priori, and suggest that efforts devoted to this end could prove rewarding. Steg et al.(2001) and Outwater et al. (2003) offer independent initial approaches to the inclusion of sub-jective variables into large-scale travel demand forecasting models. Although additional work isneeded to refine the variable measurement, forecasting, and modeling steps of the process, theirwork points to a way forward that could be pursued with the appropriate motivation.
Acknowledgements
This research was funded by the DaimlerChrysler Corporation, with special thanks to Hans-Christian Winter, and the University of California Transportation Center. We are grateful toLothlorien Redmond, Richard Curry, Naomi Otsuka, and Ilan Salomon for their previous workon the mobility project. We also acknowledge Gustavo Collantes for his fresh comments andsupport. The comments of two anonymous referees improved the paper.
References
Babbie, E., 1998. The Practice of Social Research, eighth ed. Wadsworth Publishing Company, Belmont, CA.
Ben-Akiva, M., Lerman, S.R., 1985. Discrete Choice Analysis: Theory and Application to Travel Demand. MIT Press,
Cambridge, MA.
Berkovec, J., 1985. Forecasting automobile demand using disaggregate choice models. Transportation Research B 19
(4), 315–329.
Berkovec, J., Rust, J., 1985. A nested logit model of automobile holdings for one vehicle households. Transportation
Research B 19 (4), 275–285.
Bureau of Transportation Statistics, 1999. National Transportation Statistics 1999. Tables 1–16 and 1–17.
Choo, S., Mokhtarian, P.L., 2002. The Relationship of Vehicle Type Choice to Personality, Lifestyle, Attitudinal, and
Demographic Variables. Research Report UCD-ITS-RR-02-06, Institute of Transportation Studies, University of
California, Davis. Available at its.ucdavis.edu/publications/2002/RR-02-06.pdf.
S. Choo, P.L. Mokhtarian / Transportation Research Part A 38 (2004) 201–222 221
Collantes, G.O., Mokhtarian, P.L., 2002. Qualitative subjective assessments of personal mobility: Exploring the
magnifying and diminishing cognitive mechanisms involved. Unpublished manuscript, available from the
authors.
Consumers Union, 1956–1998. Consumer Reports. Usually the April issue of every year (relating to new auto models of
that year).
Cosslett, S., 1981. Efficient estimation of discrete choice models. In: Manski, C.F., McFadden, D. (Eds.), Structural
Analysis of Discrete Data with Econometric Applications. MIT Press, Cambridge, MA, pp. 51–111.
Curry, R., 2000. Attitudes Toward Travel: The Relationships Among Perceived Mobility, Travel Liking, and Relative
Desired Mobility. Master�s Thesis. Department of Civil and Environmental Engineering, University of California,
Davis. Available at its.ucdavis.edu/publications/2000/RR-00-06.pdf.
Environmental Protection Agency, 1996. Model Year 1996 Fuel Economy Guide. Available at http://www.epa.gov/
oms/mpg.htm. Accessed on September 5, 2000.
Federal Highway Administration, 1997. 1995 NPTS Early Results Report. Publication No. FHWA-PL-97-028, US
Department of Transportation, Federal Highway Administration, Washington, DC.
Golob, T.F., Bunch, D.S., Brownstone, D., 1997. A vehicle use forecasting model based on revealed and stated vehicle
type choice and utilization data. Journal of Transport Economics and Policy, 69–92.
Greene, W.H., 1995. LIMDEP Version 7.0 User�s Manual. Econometric Software, Inc., Bellport, New York.
Hausman, J., McFadden, D., 1984. Specification tests for the multinomial logit model. Econometrica 52 (5), 1219–
1240.
Hocherman, I., Prashker, J.N., Ben-Akiva, M., 1983. Estimation and use of dynamic transaction models of automobile
ownership. Transportation Research Record 944, 134–141.
Kitamura, R., Laidet, L., Mokhtarian, P.L., Buckinger, C., Gianelli, F., 1994. Land Use and Travel Behavior. Research
Report UCD-ITS-RR-94-27. Institute of Transportation Studies, University of California, Davis.
Kitamura, R., Golob, T.F., Yamamoto, T., Wu, G., 2000. Accessibility and auto use in a motorized metropolis. TRB
ID Number 00-2273, Paper presented at the 79th Transportation Research Board Annual Meeting, Washington,
DC.
Lave, C.A., Train, K., 1979. A disaggregate model of auto-type choice. Transportation Research A 13 (1), 1–9.
Mannering, F., Winston, C., 1985. A dynamic empirical analysis of household vehicle ownership and utilization. Rand
Journal of Economics 16 (2), 215–236.
Mannering, F., Winston, C., Starkey, W., 2002. An exploratory analysis of automobile leasing by US households.
Journal of Urban Economics 52 (1), 154–176.
Manski, C.F., Sherman, L., 1980. An empirical analysis of household choice among motor vehicles. Transportation
Research A 14 (5/6), 349–366.
Manski, C.F., Lerman, S.R., 1977. The estimation of choice probabilities from choice based samples. Econometrica 45
(8), 1977–1988.
McFadden, D., Train, K., Tye, W., 1977. An application of diagnostic tests for the independence of irrelevant
alternatives property of the multinomial logit model. Transportation Research Record 637, 39–46.
Mokhtarian, P.L., Salomon, I., Redmond, L., 2001. Understanding the demand for travel: It�s not purely ‘‘derived’’.
Innovation: The European Journal of Social Science Research 14 (4), 355–380.
Murtaugh, M., Gladwin, H., 1980. A hierarchical decision-process model for forecasting automobile type-choice.
Transportation Research A 14 (5/6), 337–348.
Outwater, M.L., Castleberry, S., Shiftan, Y., Ben-Akiva, M., Zhou, Y.S., Kuppam, A., 2003. Use of structural equation
modeling for an attitudinal market segmentation approach to mode choice and ridership forecasting. Presented at
the 10th International Conference on Travel Behaviour Research, Lucerne, Switzerland.
Redmond, L., 2000. Identifying and Analyzing Travel-related Attitudinal, Personality, and Lifestyle Clusters in the San
Francisco Bay Area. Master�s Thesis. Transportation Technology and Policy Graduate Group, Institute of
Transportation Studies, University of California, Davis. Available at its.ucdavis.edu/publications/2000/RR-00-
08.pdf.
Redmond, L., Mokhtarian, P.L., 2001. Modeling Objective Mobility: The Impact of Travel-related Attitudes,
Personality, and Lifestyle on Distance Traveled. Research Report UCD-ITS-RR-01-09, Institute of Transportation
Studies, University of California, Davis. Available at its.ucdavis.edu/publications/2001/RR-01-09.pdf.
Small, K.A., Hsiao, C., 1985. Multinomial logit specification tests. International Economic Review 26 (3), 619–627.

222 S. Choo, P.L. Mokhtarian / Transportation Research Part A 38 (2004) 201–222
Steg, L., Geurs, K., Ras, M., 2001. The effects of motivational factors on car use: A multidisciplinary modelling
approach. Transportation Research A 35 (9), 789–806.
Train, K., 1986. Qualitative Choice Analysis: Theory, Econometrics, and An Application to Automobile Demand. MIT
Press, Cambridge, MA.