Embed Size (px)
Citation preview

DATA VISUALIZATION
FOR THE REST OF US:
A BEGINNER’S GUIDE
Linda Hofschire | @lindahofschire
Library Research Service, Colorado State Library
Zeth Lietzau | @zeth
Denver Public Library

SCHOOL LIBRARY IMPACT STUDIES


Stories are how numbers talk to people.-Thomas Davenport
By visualizing information, we turn it into a landscape that you can explore with your eyes, a sort of information map. And when you’re lost in information, an information map is kind of useful.―David McCandless
Numbers have an important story to tell. They rely on you to give them a clear and convincing voice.―Stephen Few

The Data Visualization Continuum
Excel chart/
number art in a
report or
presentation
Complex infographic
that includes a variety
of visual elements


The Data Visualization Continuum
Excel chart/
number art in a
report or
presentation
Complex infographic
that includes a variety
of visual elements
Where are you on the continuum?

FOUR SIMPLE
TWEAKS
to make numbers and charts more accessible
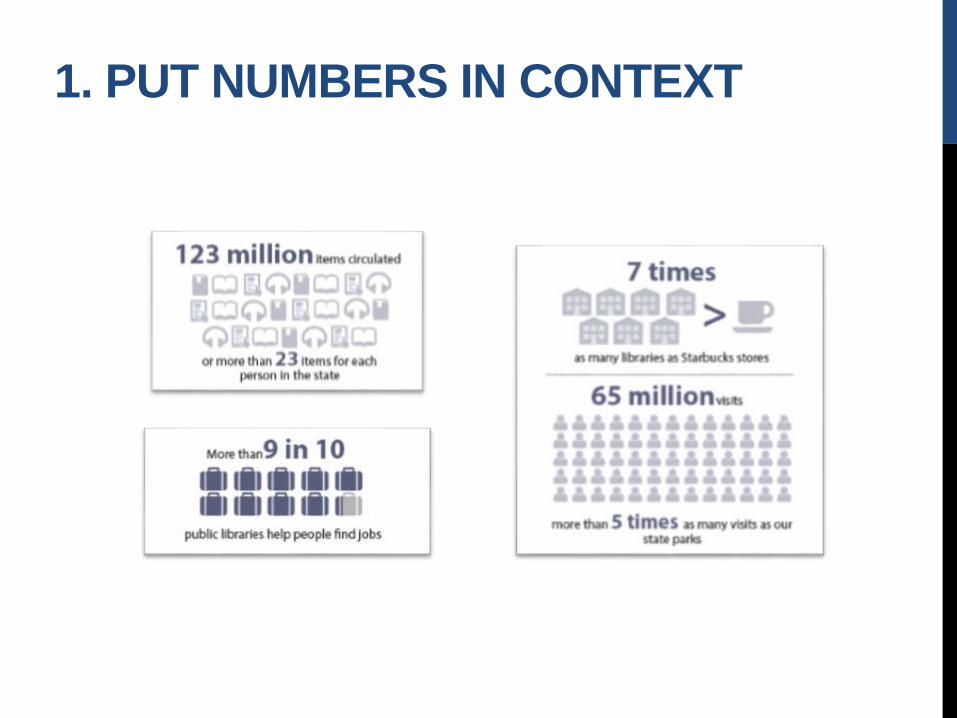
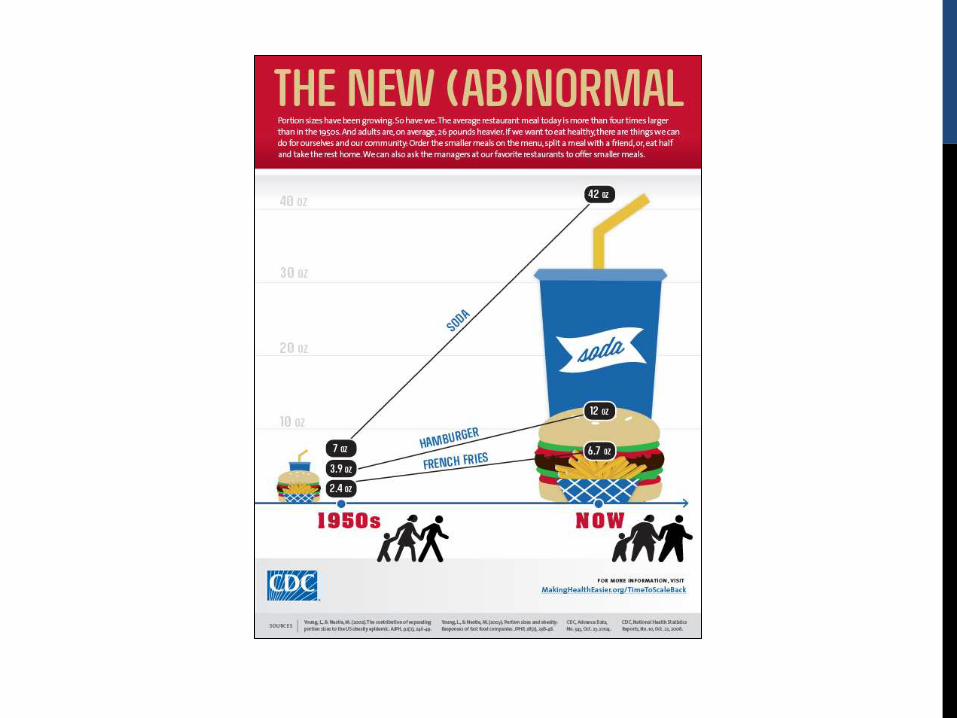
1. PUT NUMBERS IN CONTEXT

Source: Data is Beautiful/Reddit
2. CHOOSE THE APPROPRIATE CHART

2. CHOOSE THE APPROPRIATE CHART

3. SIMPLIFY AND ESTABLISH A
FOCAL POINT

Image credit: Stephanie Evergreen
3. SIMPLIFY AND ESTABLISH A
FOCAL POINT

Image credit: Stephanie Evergreen
3. SIMPLIFY AND ESTABLISH A
FOCAL POINT

4. DON’T MAKE PEOPLE WORK TOO
HARD TO FIND INFORMATION
0%
10%
20%
30%
40%
50%
60%
70%
80%
90%
100%
<10k 10k-24,999 25k-99,999 100k-499,999 500k+
Pe
rce
nta
ge
of
Lib
rari
es
Population Group
Percentage of U.S. Public Libraries with Text, Chat, and Email Reference, 2014
Text Chat Email

2%
11% 14%
21%
67%
9%
26% 28%
43%
100%
25% 26%
48%
75%
100%
0%
10%
20%
30%
40%
50%
60%
70%
80%
90%
100%
<10k 10k-24,999 25k-99,999 100k-499,999 500k+
Pe
rce
nta
ge
of
Lib
rari
es
Population Group
Percentage of U.S. Public Libraries with Text, Chat, and Email Reference, 2014
Text Chat Email
4. DON’T MAKE PEOPLE WORK TOO
HARD TO FIND INFORMATION

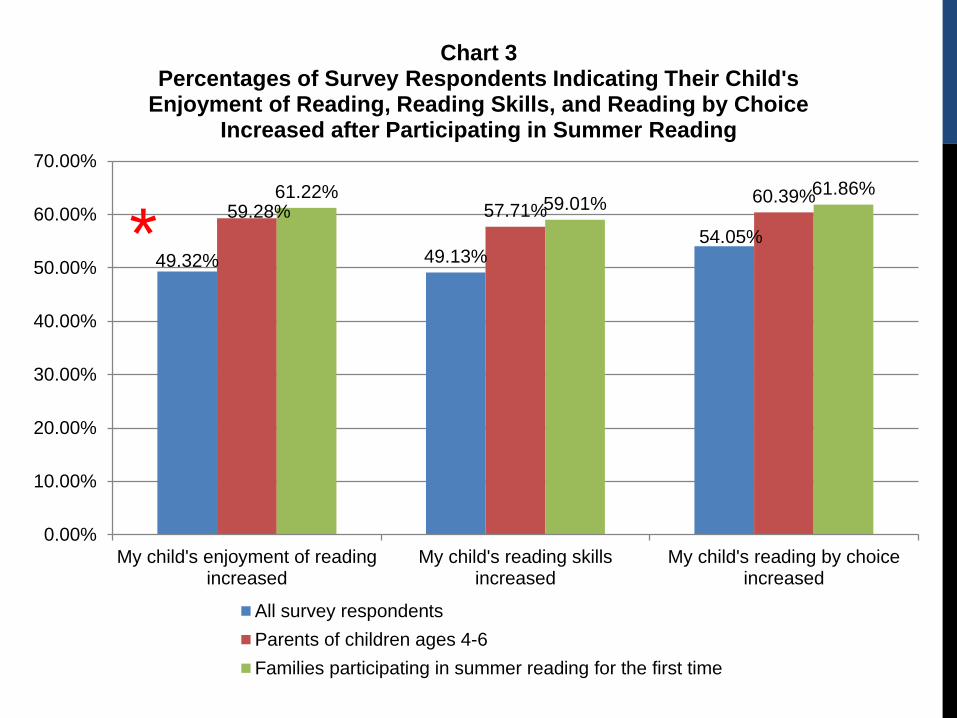
CHART DISSECTION

49.32% 49.13%54.05%
59.28% 57.71%60.39%61.22%
59.01%61.86%
0%
10%
20%
30%
40%
50%
60%
70%
My child's enjoyment of readingincreased
My child's reading skillsincreased
My child's reading by choiceincreased
Chart 3Percentages of Survey Respondents Indicating Their Child's
Enjoyment of Reading, Reading Skills, and Reading by Choice Increased after Participating in Summer Reading
All survey respondents
Parents of children ages 4-6
Families participating in summer reading for the first time
*

49.32% 49.13%54.05%
59.28% 57.71%60.39%61.22%
59.01%61.86%
0.00%
10.00%
20.00%
30.00%
40.00%
50.00%
60.00%
70.00%
My child's enjoyment of readingincreased
My child's reading skillsincreased
My child's reading by choiceincreased
Chart 3Percentages of Survey Respondents Indicating Their Child's
Enjoyment of Reading, Reading Skills, and Reading by Choice Increased after Participating in Summer Reading
All survey respondents
Parents of children ages 4-6
Families participating in summer reading for the first time
*

49.32% 49.13%54.05%
59.28% 57.71%60.39%61.22%
59.01%61.86%
0.00%
10.00%
20.00%
30.00%
40.00%
50.00%
60.00%
70.00%
My child's enjoyment of readingincreased
My child's reading skillsincreased
My child's reading by choiceincreased
Chart 3Percentages of Survey Respondents Indicating Their Child's
Enjoyment of Reading, Reading Skills, and Reading by Choice Increased after Participating in Summer Reading
All survey respondents
Parents of children ages 4-6
Families participating in summer reading for the first time

49.32% 49.13%54.05%
59.28% 57.71%60.39%61.22%
59.01%61.86%
0.00%
10.00%
20.00%
30.00%
40.00%
50.00%
60.00%
70.00%
My child's enjoyment of readingincreased
My child's reading skillsincreased
My child's reading by choiceincreased
Chart 3Percentages of Survey Respondents Indicating Their Child's
Enjoyment of Reading, Reading Skills, and Reading by Choice Increased after Participating in Summer Reading
All survey respondents
Parents of children ages 4-6
Families participating in summer reading for the first time
Color
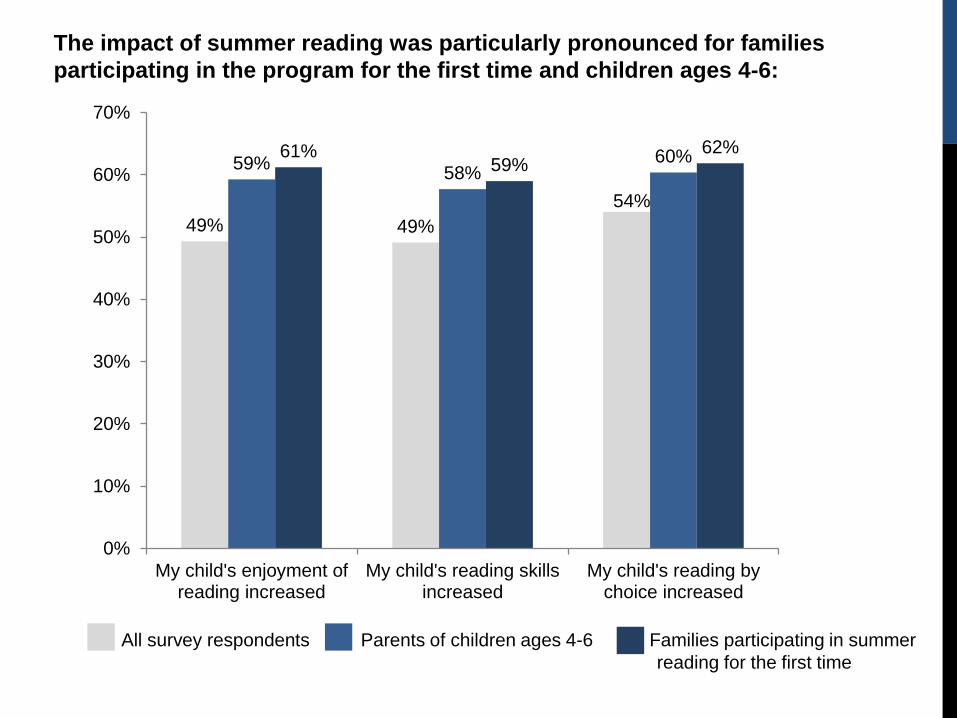
49% 49%
54%
59%58%
60%61%59%
62%
0%
10%
20%
30%
40%
50%
60%
70%
My child's enjoyment ofreading increased
My child's reading skillsincreased
My child's reading bychoice increased
The impact of summer reading was particularly pronounced for families
participating in the program for the first time and children ages 4-6:
All survey respondents Parents of children ages 4-6 Families participating in summer
reading for the first time

49.32% 49.13%54.05%
59.28% 57.71%60.39%61.22%
59.01%61.86%
0%
10%
20%
30%
40%
50%
60%
70%
My child's enjoyment of readingincreased
My child's reading skillsincreased
My child's reading by choiceincreased
Chart 3Percentages of Survey Respondents Indicating Their Child's
Enjoyment of Reading, Reading Skills, and Reading by Choice Increased after Participating in Summer Reading
All survey respondents
Parents of children ages 4-6
Families participating in summer reading for the first time

ACTIVITY:
CHART DISSECTION


10%
25%
27%
29%
30%
32%
34%
51%
0% 10% 20% 30% 40% 50% 60%
Entrepreneurship
Employment
Education
eGovernment
Health & wellness
eCommerce
Civic engagement
Social networking
Using technology to stay in touch with family and friends and maintain
social networks was the most popular activity on Rock Creek Public
Library computers.


The percentages of Stony Brook Public Library computer users accomplishing
work-related tasks have increased steadily since 2013.


About half of Boulder Bay Public Library computer users are white,
and more than 1 in 4 are Hispanic or Latino.

48%
27%
11%
10%
4%
White
Hispanic or Latino
Black or African-American
American Indian and AlaskaNative
Asian
More than 1 in 4 Boulder Bay Public Library computer users are
Hispanic or Latino.

3 DESIGN GUIDELINES
1. K.I.S.S.
2. Show rather than tell
3. Colors and fonts


3 DESIGN GUIDELINES
1. K.I.S.S.
2. Show rather than tell
3. Colors and fonts


3 DESIGN GUIDELINES
1. K.I.S.S.
2. Show rather than tell
3. Colors and fonts


THE DESIGN
PROCESS

STEPS FOR SUCCESS
1. Begin with numbers
2. Understand your goals
and audience
3. Find your story
4. Design, refine,
repurpose
5. Share

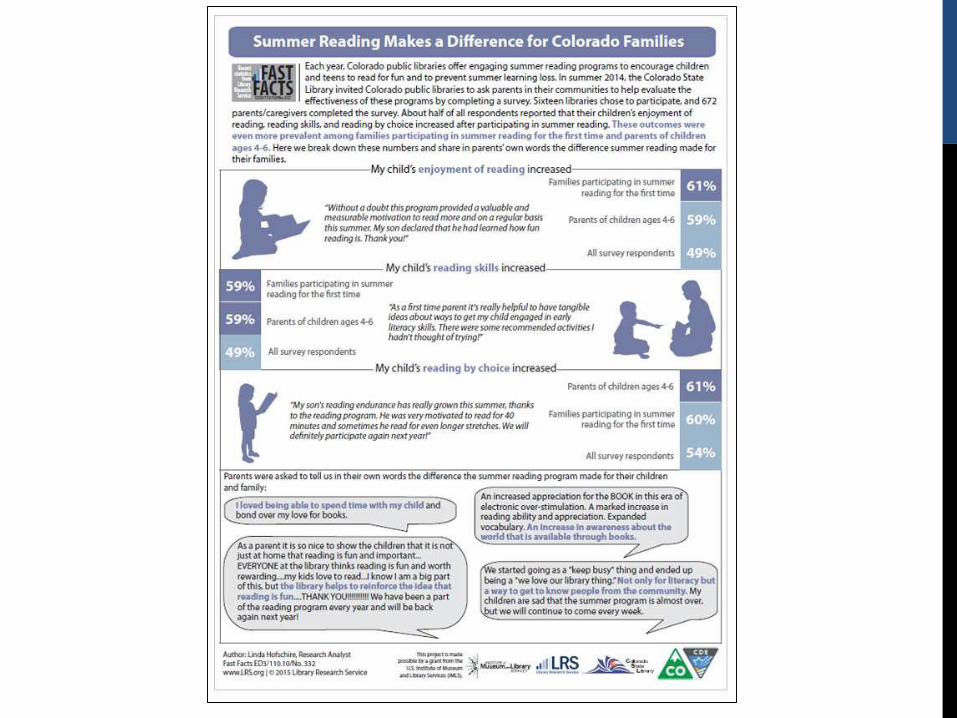
SUMMER READING SURVEY
49%
49%
54%
0% 20% 40% 60%
My child's enjoyment ofreading increased
My child's reading bychoice increased
My child's reading skillsincreased
After participating in summer reading...

STEPS FOR SUCCESS
1. Begin with numbers
2. Understand your goals
and audience
3. Establish your approach
4. Design, refine, repurpose
5. Share

GOALS AND AUDIENCE

Each year, Colorado public libraries offer
engaging summer reading programs to
encourage children and teens to read for
fun and to prevent summer learning loss…
GOALS AND AUDIENCE

STEPS FOR SUCCESS
1. Begin with numbers
2. Understand your goals
and audience
3. Find your story
4. Design, refine, repurpose
5. Share

WHAT’S THE STORY?
49%
49%
54%
0% 20% 40% 60%
My child's enjoyment ofreading increased
My child's reading bychoice increased
My child's reading skillsincreased
After participating in summer reading...

Child’s age
Summer reading
participation
historyLibrary
card
How respondent
learned about
summer reading Plan to visit
library in fall
WHAT’S THE STORY?

Child’s age
Summer reading
participation
history Library
card
How respondent
learned about
summer reading Plan to visit
library in fall
WHAT’S THE STORY?

49%
59%
61%
All survey respondents
Parents of children ages 4-6
Families participating in summerreading for the first time
My child’s enjoyment of reading increased
WHAT’S THE STORY?

49%
59%
59%
All survey respondents
Parents of children ages 4-6
Families participating in summerreading for the first time
My child’s reading skills increased
WHAT’S THE STORY?

WHAT’S THE STORY?
54%
60%
61%
All survey respondents
Families participating in summerreading for the first time
Parents of children ages 4-6
My child’s reading by choice increased

STEPS FOR SUCCESS
1. Begin with numbers
2. Understand your goals
and audience
3. Find your story
4. Design, refine,
repurpose
5. Share

DESIGN, REFINE, REPURPOSE


STEPS FOR SUCCESS
1. Begin with numbers
2. Understand your goals
and audience
3. Establish your approach
4. Design, refine, repurpose
5. Share


AN EXAMPLE
FROM THE FIELD

WHERE WE WERE

ONE SIMPLE QUESTION


INFOGRAPHIC CREATION
SOFTWARE
PowerPointAdobe
Illustrator
Piktochart


INFOGRAPHIC CREATION
SOFTWARE
PowerPointAdobe
Illustrator
Piktochart
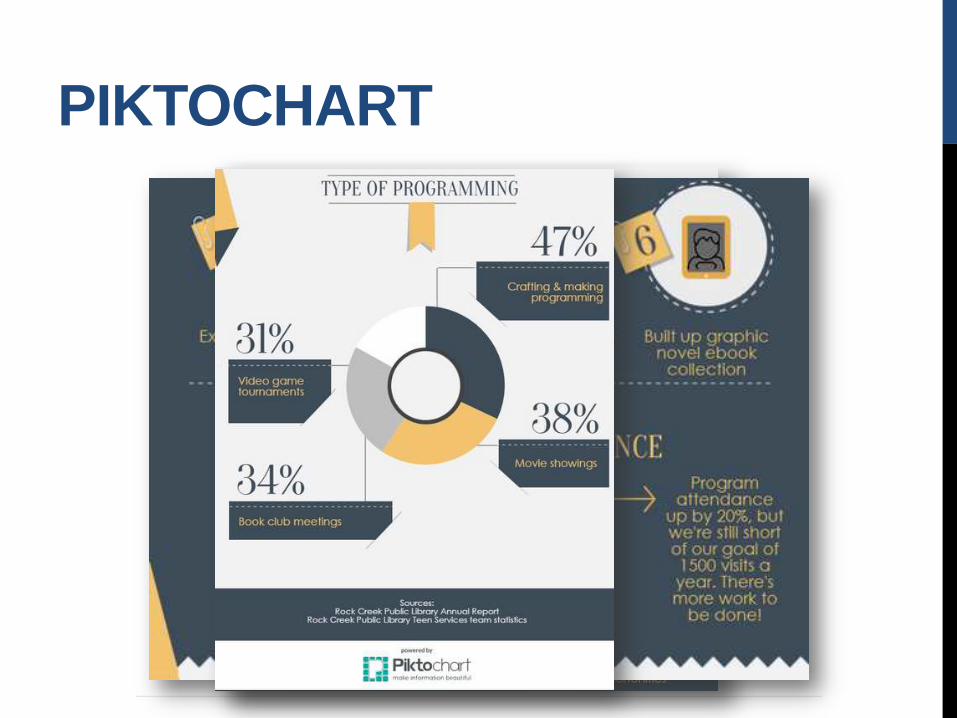
PIKTOCHART

RESOURCES
Infographic Software Selection Guide
Tips and Inspiration
Software Tutorials
Icon/Image Sources
Fonts/Symbol Fonts
Color
Palettes
Color Blindness
Chart Selection Guide

ACTION ITEMS
1. Perform a chart dissection.
2. Take a data inventory. What are you
currently collecting?
3. Think about the stories you want to tell
about your library. Do you have the data
to tell those stories?

IT’S EASIER TO BE A
CRITIC THAN IT IS
TO BE A CREATOR


QUESTIONS?


![Supporting Interface for Beginners Watching Japanese Chess ... · Japanese Chess, there are visualization methods for the spec-tators [8]. However, few methods have supported beginners](https://img.pdfslide.net/doc/110x75/5e5a923ef9b90a75e74d4142/supporting-interface-for-beginners-watching-japanese-chess-japanese-chess-there.jpg)