Embed Size (px)
Citation preview
PREVENTING PUBLIC TRANSPORT CRIME IN EL SALVADOR BACKGROUND PAPER 1: Systematic Observation of Public Transport in San Salvador and Adjacent Metropolitan Areas

PREVENTING PUBLIC TRANSPORT CRIME IN EL SALVADOR
PREVENTING PUBLIC TRANSPORT CRIME IN EL SALVADOR BACKGROUND PAPER 1: Systematic Observation of Public Transport in San Salvador and Adjacent Metropolitan Areas June 2015
SolucionES Project Cooperation Agreement No. AID-519-A-12-00003
Document prepared by: Dr. Carlos Carcach (ESEN)
DISCLAIMER
This publication was possible thanks to the support of the people of the United States of America through the
United States Agency for International Development (USAID). The views and opinions expressed in this
document are the author's and do not necessarily reflect those of USAID or the Government of the United
States.
This study had the support of Escuela Superior de Economía y Negocios, ESEN.

PREVENTING PUBLIC TRANSPORT CRIME IN EL SALVADOR


CONTENT
1. INTRODUCTION ............................................................................................................................... 1
2. BACKGROUND TO THE PUBLIC TRANSPORT SYSTEM ...................................................................... 2
3. OBJECTIVES ..................................................................................................................................... 4
4. METHODOLOGY .............................................................................................................................. 4
4.1 Routes under observation ......................................................................................................... 4
4.2 Observation processes .............................................................................................................. 5
4.3 Collected data ........................................................................................................................... 6
4.4 DATA DESCRIPTION ................................................................................................................... 7
5. MAIN FINDINGS ............................................................................................................................... 9
6. CONCLUSIONS ............................................................................................................................... 20
7. REFERENCES .................................................................................................................................. 22
Appendix 1: Systematic observation guide ....................................................................................... 23
1
PREVENTING PUBLIC TRANSPORT CRIME IN EL SALVADOR
1. INTRODUCTION In El Salvador, public transport refers to the service provided through a State concession by: a)
Institutional or private buses providing passengers with collective transport services; (b) microbuses
of the public service; (c) other types of vehicles that meet the requirements for the provision of this
service, as described in the respective regulations (Ley de Trasporte Terrestre, Tránsito y Seguridad
Vial, Art. 27). For purposes of this paper, public transport includes buses and microbuses providing
passenger transport services.
The public transport is a setting for different types of crimes which can be committed within buses
and microbuses, in the places designated as bus stops, and in related environments such as
terminals. The targets of these crimes can be the transport providers themselves (as in the cases of
fare evasion, vandalism, theft of parts or fuel, extortion, killings and other forms of violence against
the owners and employees, etc.) or its users (as in cases of theft, robbery, physical assault, sexual,
etc.) (Clarke & Smith2000). This paper considers crimes and antisocial behaviors committed on the
users of the system of public transportation operated by buses and microbuses.
Data from various sources indicate that a significant number of offences occur within the public
transportation system environments or in environments related to public transport. Data from a
victimization survey indicate that in 2012, thirty-four percent of total personal victimizations took
place within a public transport unit or at a bus stop (ESEN, 2013). According to the same source, and
always during the year 2012, in 70% of these incidents the perpetrators stole something that
belonged to the victims. The monetary value of the stolen goods amounted to $25.3 million,
equivalent to an average loss of $127.00 per incident. This loss represents 57% of the current
minimum wage for the commerce and services sectors. The average number of incidents in the
public transport system was 4.1 per each victim leading to estimate at $516.23 annual monetary
loss infringed on every victim of robbery or theft on the public transport. Very few victims reported
incidents of public transport crime to the authorities. In 2012, 17% of the victims reported an
incident to the police (ESEN, 2013).
Little is known about the factors affecting crime against public transport users in El Salvador. As in
most developing countries, official crime statistics are almost inexistent or they are difficult to
obtain. This situation is more critical in the case of the public transport system. Research on issues
relating to public transport crime is inexistent.
This paper addresses the environmental settings of the public transport system that might generate
conditions for the occurrence of crimes against users or to affect the fear of crime and perceptions
of safety among the users of the system. Its main objective is to support the identification of crime
prevention initiatives, both feasible and effective, as part of a broader research project on the
general topic of public transport crime. The paper discusses the main findings of a systematic
observation of 122 routes or segments of route in San Salvador, the capital city of El Salvador, and
neighboring metropolitan municipalities.
PREVENTING PUBLIC TRANSPORT CRIME IN EL SALVADOR
2
The second section contains background information on the public transport system in El Salvador
and defines key concepts. Section 3 outlines the objectives of the study. Section 4 describes the
methodology of the systematic observation of bus and microbus routes. Section 5 describes the
data used as part of the study. Section 6 describes and discusses the major findings on the
environmental conditions surrounding bus stops, and the internal environment of buses and
microbuses. Section 7 contains the conclusions.
2. BACKGROUND TO THE PUBLIC TRANSPORT
SYSTEM For the purposes of this paper, the term route denotes a specific public transport network that has
been approved by the Vice-Ministry of Transport for the commuting of passengers between an
origin (i.e. terminal or “punto”) and a destination (i.e. terminal or “meta”) through a designed
sequence of bus stops and interchanges.
Routes are identified with numerical or mixed numerical-character codes, and may be covered with
different types of transport units according to their capacity: (1) Buses (40 or more seats), (2)
microbuses (up to 25 seats), (3) minibuses or vans (up to 12 seats), and (4) pickups (usually these
units have no traditional seats). This study focus on the environmental conditions associated to
routes covered with buses and microbuses. Users of microbuses pay a higher fare than those of
buses.
The route codes, usually referred to as route numbers, identify the type of transport service for
which a concessionary has been granted a permit to operate. The rapid urban growth that has taken
place in El Salvador over the last 20 years or so has made the assignment by the transport authorities
of route codes more difficult. The routes are classified in four groups according to the type of
transport service they offer:
Urban: Both origin and destination are located within the borders of the same city or town.
The numbers for these routes can be any number between 1 and 99.
Inter-urban: Their origin and destination are located in different cities or towns usually
within a same metropolitan area or province. The numbers for these routes can be any
number greater than 99.
Inter-departmental: These routes join cities located in different provinces or departments.
The numbers for these routes can be any number greater than 99.
Intra-departmental: These routes join nonurban or minor urban places located within a
same province. The numbers for these routes are formed by a number followed by a two-
letter identifier for the province. For instance, the route 1-LL operates within the province
of La Libertad.
3
PREVENTING PUBLIC TRANSPORT CRIME IN EL SALVADOR
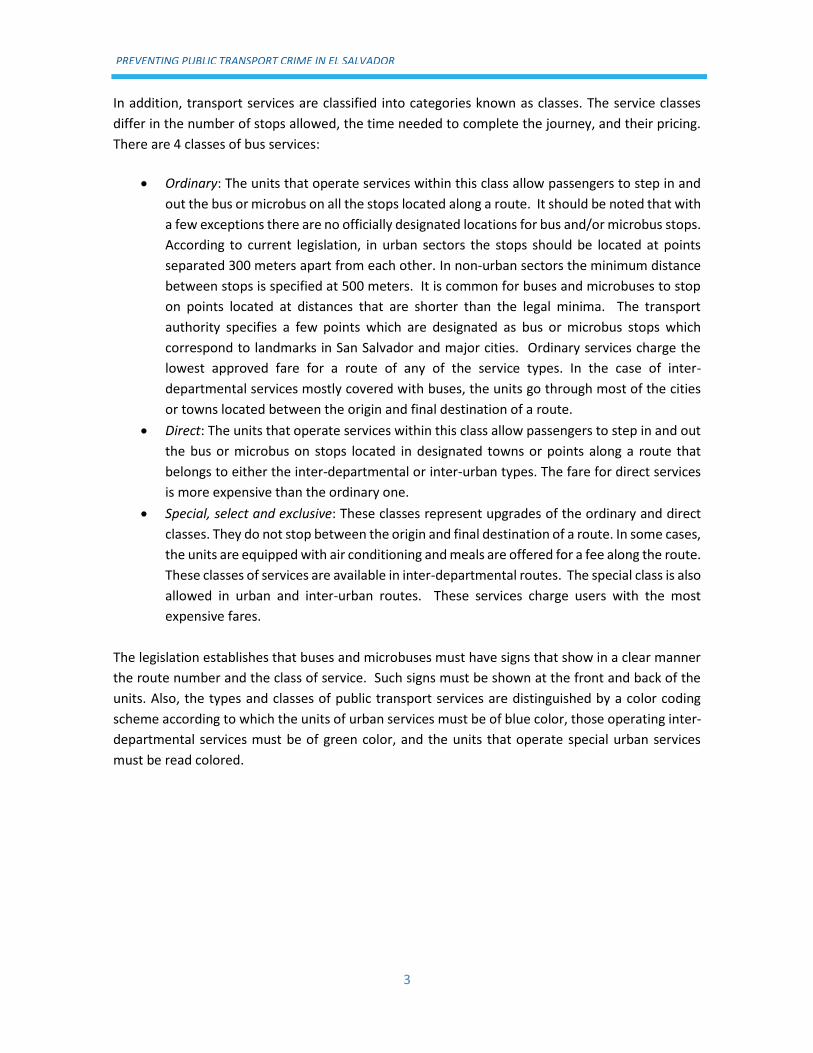
In addition, transport services are classified into categories known as classes. The service classes
differ in the number of stops allowed, the time needed to complete the journey, and their pricing.
There are 4 classes of bus services:
Ordinary: The units that operate services within this class allow passengers to step in and
out the bus or microbus on all the stops located along a route. It should be noted that with
a few exceptions there are no officially designated locations for bus and/or microbus stops.
According to current legislation, in urban sectors the stops should be located at points
separated 300 meters apart from each other. In non-urban sectors the minimum distance
between stops is specified at 500 meters. It is common for buses and microbuses to stop
on points located at distances that are shorter than the legal minima. The transport
authority specifies a few points which are designated as bus or microbus stops which
correspond to landmarks in San Salvador and major cities. Ordinary services charge the
lowest approved fare for a route of any of the service types. In the case of inter-
departmental services mostly covered with buses, the units go through most of the cities
or towns located between the origin and final destination of a route.
Direct: The units that operate services within this class allow passengers to step in and out
the bus or microbus on stops located in designated towns or points along a route that
belongs to either the inter-departmental or inter-urban types. The fare for direct services
is more expensive than the ordinary one.
Special, select and exclusive: These classes represent upgrades of the ordinary and direct
classes. They do not stop between the origin and final destination of a route. In some cases,
the units are equipped with air conditioning and meals are offered for a fee along the route.
These classes of services are available in inter-departmental routes. The special class is also
allowed in urban and inter-urban routes. These services charge users with the most
expensive fares.
The legislation establishes that buses and microbuses must have signs that show in a clear manner
the route number and the class of service. Such signs must be shown at the front and back of the
units. Also, the types and classes of public transport services are distinguished by a color coding
scheme according to which the units of urban services must be of blue color, those operating inter-
departmental services must be of green color, and the units that operate special urban services
must be read colored.
PREVENTING PUBLIC TRANSPORT CRIME IN EL SALVADOR
4
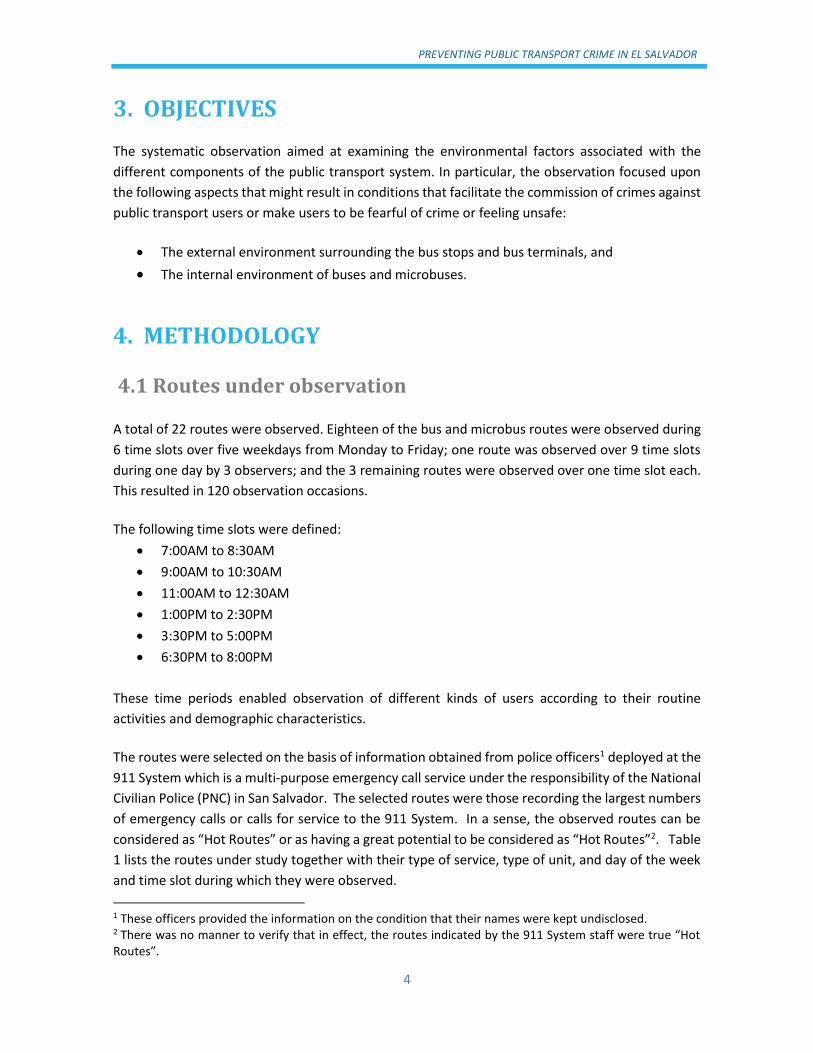
3. OBJECTIVES The systematic observation aimed at examining the environmental factors associated with the
different components of the public transport system. In particular, the observation focused upon
the following aspects that might result in conditions that facilitate the commission of crimes against
public transport users or make users to be fearful of crime or feeling unsafe:
The external environment surrounding the bus stops and bus terminals, and
The internal environment of buses and microbuses.
4. METHODOLOGY
4.1 Routes under observation
A total of 22 routes were observed. Eighteen of the bus and microbus routes were observed during
6 time slots over five weekdays from Monday to Friday; one route was observed over 9 time slots
during one day by 3 observers; and the 3 remaining routes were observed over one time slot each.
This resulted in 120 observation occasions.
The following time slots were defined:
7:00AM to 8:30AM
9:00AM to 10:30AM
11:00AM to 12:30AM
1:00PM to 2:30PM
3:30PM to 5:00PM
6:30PM to 8:00PM
These time periods enabled observation of different kinds of users according to their routine
activities and demographic characteristics.
The routes were selected on the basis of information obtained from police officers1 deployed at the
911 System which is a multi-purpose emergency call service under the responsibility of the National
Civilian Police (PNC) in San Salvador. The selected routes were those recording the largest numbers
of emergency calls or calls for service to the 911 System. In a sense, the observed routes can be
considered as “Hot Routes” or as having a great potential to be considered as “Hot Routes”2. Table
1 lists the routes under study together with their type of service, type of unit, and day of the week
and time slot during which they were observed.
1 These officers provided the information on the condition that their names were kept undisclosed. 2 There was no manner to verify that in effect, the routes indicated by the 911 System staff were true “Hot Routes”.
5
PREVENTING PUBLIC TRANSPORT CRIME IN EL SALVADOR
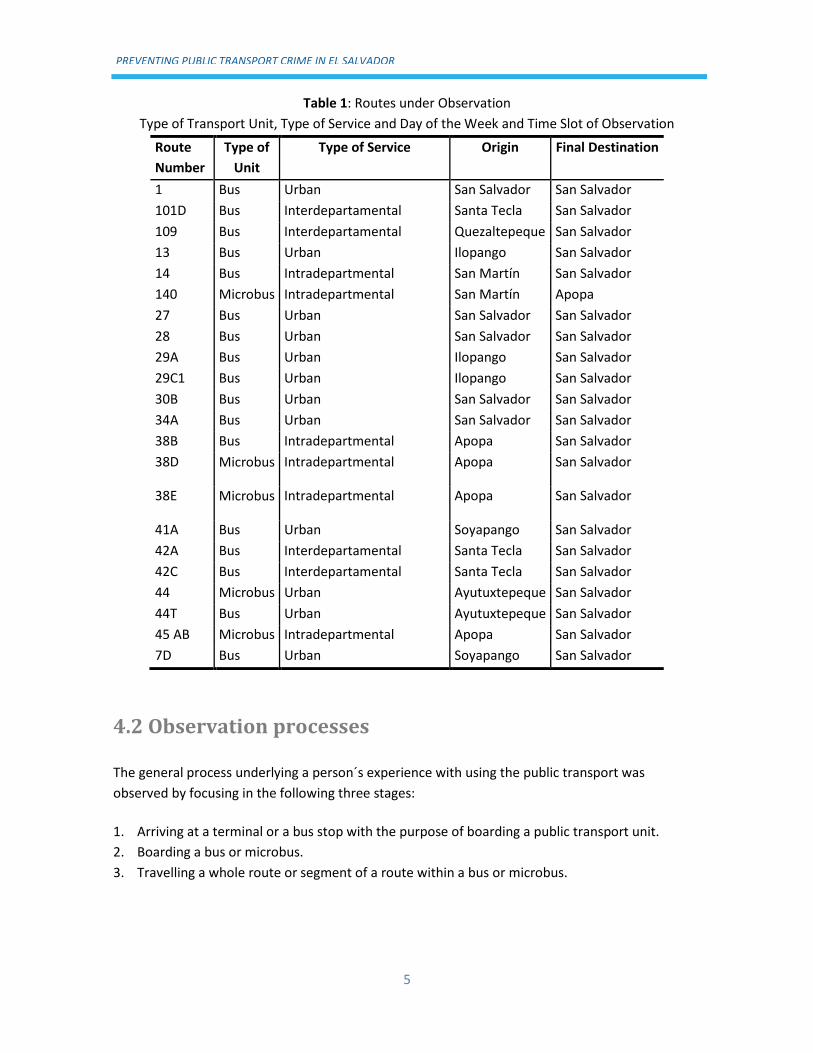
Table 1: Routes under Observation
Type of Transport Unit, Type of Service and Day of the Week and Time Slot of Observation
Route
Number
Type of
Unit
Type of Service Origin Final Destination
1 Bus Urban San Salvador San Salvador
101D Bus Interdepartamental Santa Tecla San Salvador
109 Bus Interdepartamental Quezaltepeque San Salvador
13 Bus Urban Ilopango San Salvador
14 Bus Intradepartmental San Martín San Salvador
140 Microbus Intradepartmental San Martín Apopa
27 Bus Urban San Salvador San Salvador
28 Bus Urban San Salvador San Salvador
29A Bus Urban Ilopango San Salvador
29C1 Bus Urban Ilopango San Salvador
30B Bus Urban San Salvador San Salvador
34A Bus Urban San Salvador San Salvador
38B Bus Intradepartmental Apopa San Salvador
38D Microbus Intradepartmental Apopa San Salvador
38E Microbus Intradepartmental Apopa San Salvador
41A Bus Urban Soyapango San Salvador
42A Bus Interdepartamental Santa Tecla San Salvador
42C Bus Interdepartamental Santa Tecla San Salvador
44 Microbus Urban Ayutuxtepeque San Salvador
44T Bus Urban Ayutuxtepeque San Salvador
45 AB Microbus Intradepartmental Apopa San Salvador
7D Bus Urban Soyapango San Salvador
4.2 Observation processes
The general process underlying a person´s experience with using the public transport was
observed by focusing in the following three stages:
1. Arriving at a terminal or a bus stop with the purpose of boarding a public transport unit.
2. Boarding a bus or microbus.
3. Travelling a whole route or segment of a route within a bus or microbus.
PREVENTING PUBLIC TRANSPORT CRIME IN EL SALVADOR
6
An observation guide was designed (see Appendix 1) and 8 observers were specially trained in the
use of the guide and in the procedures used to collect the data. Data collectors were organized in
pairs. Each of the pairs of observers was assigned specific route over a whole day. They boarded
several buses or microbuses of a specific route at different points (i.e. terminal, formal bus stops
and informal bus stops) on each of the specified time slots. In this way, the observers had enough
time to appreciate the different aspects under study. The time slots were separated by periods of
at least 30 minute each during which the 2 observers filled in a single data collection form
corresponding to the bus or microbus observed during the previous time slot. At the end of each
day, the completed forms were handled to a supervisor who checked them for completeness and
consistency. The data were codified, entered and edited using SPSS Data Entry Builder and a clean
SPSS data file was produced.
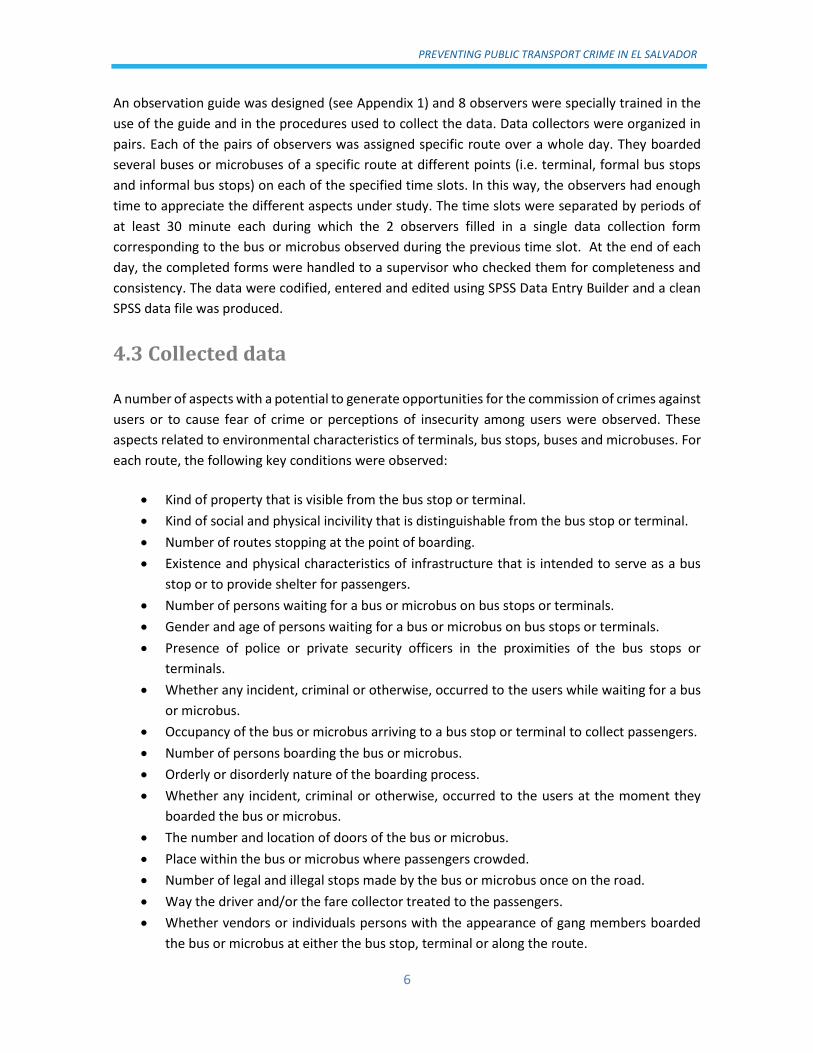
4.3 Collected data
A number of aspects with a potential to generate opportunities for the commission of crimes against
users or to cause fear of crime or perceptions of insecurity among users were observed. These
aspects related to environmental characteristics of terminals, bus stops, buses and microbuses. For
each route, the following key conditions were observed:
Kind of property that is visible from the bus stop or terminal.
Kind of social and physical incivility that is distinguishable from the bus stop or terminal.
Number of routes stopping at the point of boarding.
Existence and physical characteristics of infrastructure that is intended to serve as a bus
stop or to provide shelter for passengers.
Number of persons waiting for a bus or microbus on bus stops or terminals.
Gender and age of persons waiting for a bus or microbus on bus stops or terminals.
Presence of police or private security officers in the proximities of the bus stops or
terminals.
Whether any incident, criminal or otherwise, occurred to the users while waiting for a bus
or microbus.
Occupancy of the bus or microbus arriving to a bus stop or terminal to collect passengers.
Number of persons boarding the bus or microbus.
Orderly or disorderly nature of the boarding process.
Whether any incident, criminal or otherwise, occurred to the users at the moment they
boarded the bus or microbus.
The number and location of doors of the bus or microbus.
Place within the bus or microbus where passengers crowded.
Number of legal and illegal stops made by the bus or microbus once on the road.
Way the driver and/or the fare collector treated to the passengers.
Whether vendors or individuals persons with the appearance of gang members boarded
the bus or microbus at either the bus stop, terminal or along the route.

7
PREVENTING PUBLIC TRANSPORT CRIME IN EL SALVADOR
Whether persons with the appearance of gang members asked for money from passengers
or threatened to use or used actual violence against one or more passengers.
The actual location of the journey where persons with the appearance of gang members
stepped in or out the bus or microbus.
Whether police officers or soldiers boarded the transport unit in the course of the journey.
Whether any incident, criminal or otherwise, occurred to the users while they were
travelling in a bus or microbus.
Internal and external appearance of the bus or microbus (i.e. body, tires, the functioning of
doors, windscreen, door and window glasses, internal and external cleanliness, seats,
interior lightning, ring bell, presentation of the driver and the fare collector).
Kind of incivilities that are distinguishable inside the bus or microbus.
4.4 DATA DESCRIPTION Below there´s a description of the data collected through the systematic observation of public
transport system in El Salvador, it includes the type of unit, boarding points, time slots and day of
the week.
a) Type of transport unit
Ninety-five out of the 120 observations, equivalent to 79.2%, were performed in bus routes with
the remaining 25 or 20.8% of observations occurred in microbus routes (Figure 1).
Figure 1: Observations by Type of Public Transport Unit
79.2
20.8
0
20
40
60
80
100
Bus Microbus
% O
bs
erv
ati
on
s

PREVENTING PUBLIC TRANSPORT CRIME IN EL SALVADOR
8
b) Type of boarding point
Twenty-seven observations initiated on a location corresponding to the origin and/or final
destination of a route (22.5%), 86 observation episodes initiated on a legally designed bus stop
(71.7%), and the remaining 7 observations initiated on an unauthorized bus stop (5.8%) (Figure 2).
Figure 2: Observations by Type of Boarding Point
c) Time-slots
Observations were distributed uniformly over 6 time-slots. Figure 3 shows that 21 or 17.5% of the
total number of observations were performed in each of the following time periods: 7:00AM-
8:30AM, 9:00AM-10:30AM, 11:00AM-12:30PM and 1:00PM-2:30PM. Eighteen or 15.0% of
observations occurred during each of the remaining time-slots: 3:30PM-5:30PM and 6:30PM-
8:00PM.
Figure 3: Observations by Time-Slot
22.5
71.7
5.8
0
20
40
60
80
100
Origin or finaldestination
Legal bus stop Ilegal bus stop
% O
bs
erv
ati
on
s
17.5 17.5 17.5 17.5
15.0 15.0
0
5
10
15
20
25
7:00AM -8:30AM
9:00AM -10:30AM
11:AM -12:30AM
1:00PM -2:30PM
3:30PM -5:00PM
6:30PM -8:00PM
% O
bs
erv
ati
on
s
9
PREVENTING PUBLIC TRANSPORT CRIME IN EL SALVADOR
d) Day of the week
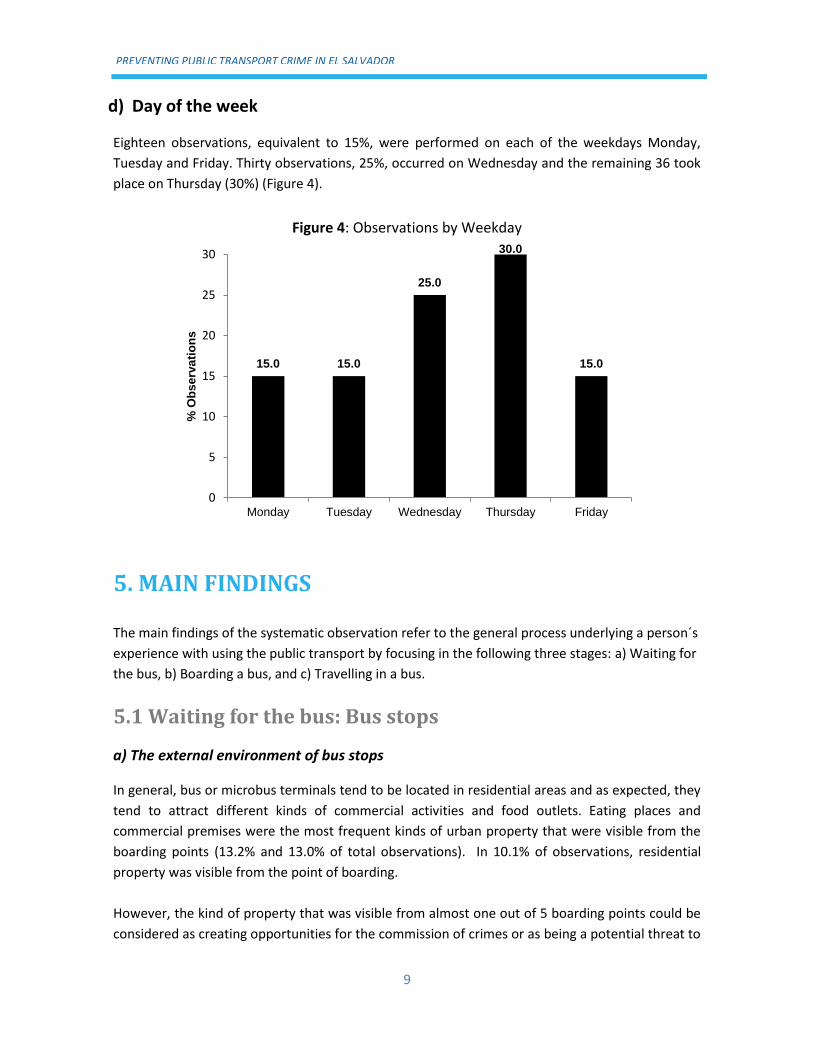
Eighteen observations, equivalent to 15%, were performed on each of the weekdays Monday,
Tuesday and Friday. Thirty observations, 25%, occurred on Wednesday and the remaining 36 took
place on Thursday (30%) (Figure 4).
Figure 4: Observations by Weekday
5. MAIN FINDINGS The main findings of the systematic observation refer to the general process underlying a person´s
experience with using the public transport by focusing in the following three stages: a) Waiting for
the bus, b) Boarding a bus, and c) Travelling in a bus.
5.1 Waiting for the bus: Bus stops
a) The external environment of bus stops
In general, bus or microbus terminals tend to be located in residential areas and as expected, they
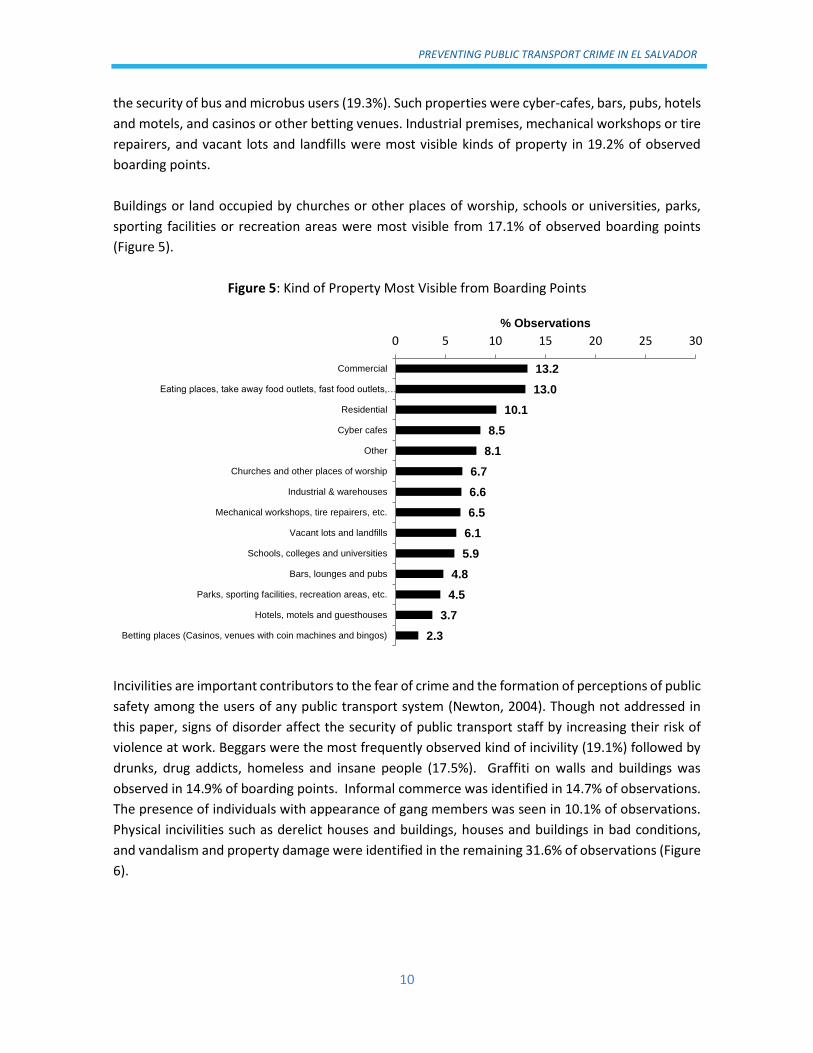
tend to attract different kinds of commercial activities and food outlets. Eating places and
commercial premises were the most frequent kinds of urban property that were visible from the
boarding points (13.2% and 13.0% of total observations). In 10.1% of observations, residential
property was visible from the point of boarding.
However, the kind of property that was visible from almost one out of 5 boarding points could be
considered as creating opportunities for the commission of crimes or as being a potential threat to
15.0 15.0
25.0
30.0
15.0
0
5
10
15
20
25
30
Monday Tuesday Wednesday Thursday Friday
% O
bs
erv
ati
on
s
PREVENTING PUBLIC TRANSPORT CRIME IN EL SALVADOR
10
the security of bus and microbus users (19.3%). Such properties were cyber-cafes, bars, pubs, hotels
and motels, and casinos or other betting venues. Industrial premises, mechanical workshops or tire
repairers, and vacant lots and landfills were most visible kinds of property in 19.2% of observed
boarding points.
Buildings or land occupied by churches or other places of worship, schools or universities, parks,
sporting facilities or recreation areas were most visible from 17.1% of observed boarding points
(Figure 5).
Figure 5: Kind of Property Most Visible from Boarding Points
Incivilities are important contributors to the fear of crime and the formation of perceptions of public
safety among the users of any public transport system (Newton, 2004). Though not addressed in
this paper, signs of disorder affect the security of public transport staff by increasing their risk of
violence at work. Beggars were the most frequently observed kind of incivility (19.1%) followed by
drunks, drug addicts, homeless and insane people (17.5%). Graffiti on walls and buildings was
observed in 14.9% of boarding points. Informal commerce was identified in 14.7% of observations.
The presence of individuals with appearance of gang members was seen in 10.1% of observations.
Physical incivilities such as derelict houses and buildings, houses and buildings in bad conditions,
and vandalism and property damage were identified in the remaining 31.6% of observations (Figure
6).
13.2
13.0
10.1
8.5
8.1
6.7
6.6
6.5
6.1
5.9
4.8
4.5
3.7
2.3
0 5 10 15 20 25 30
Commercial
Eating places, take away food outlets, fast food outlets,…
Residential
Cyber cafes
Other
Churches and other places of worship
Industrial & warehouses
Mechanical workshops, tire repairers, etc.
Vacant lots and landfills
Schools, colleges and universities
Bars, lounges and pubs
Parks, sporting facilities, recreation areas, etc.
Hotels, motels and guesthouses
Betting places (Casinos, venues with coin machines and bingos)
% Observations

11
PREVENTING PUBLIC TRANSPORT CRIME IN EL SALVADOR
Figure 6: Social and Physical Incivilities on Boarding Points
A Chi-Squared test indicated that there was a significant association between the kind of property
that was visible from the bus stops and the observed types of incivility (p<0.05).
b) Bus stop infrastructure
Both the availability of infrastructure to provide comfort and shelter to users while they wait for a
bus or microbus, and its quality are important components of the design of bus stops that affect the
perceptions of safety and security of the users of any public transport system. Only 31.7% of the
total number of observed bus stops had such infrastructure. In 29.0% of these bus stops the
observers assessed the general condition of the infrastructure as bad or very bad, in particular the
floor of the sidewalk used by passengers. Also, there was no lightning in 36.7% of bus stops and in
42.1% of those that had it the condition of the lightning was assessed as bad or very bad. These
results suggest that the majority of bus stops do not offer minimal conditions of safety for the users
of the public transport system. This is a direct consequence of the lack of regulations on the design
of bus stops.
c) Crowding in bus stops
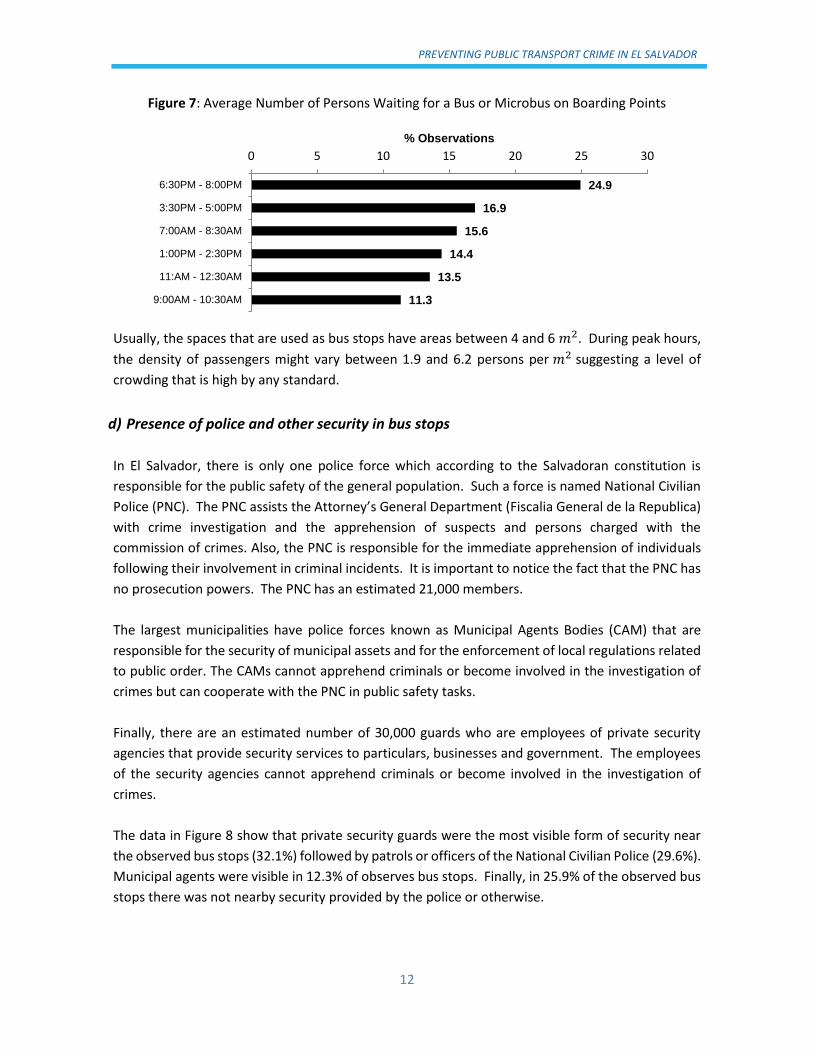
On average, there were 15.9 passengers waiting for a bus or microbus on a bus stop. The average
number of persons waiting for public transport on bus stops ranged from 11.3 to 24.9 depending on
the time of observation (Figure 7). The largest average was observed during night hours (i.e.
6:30PM-8:00PM) followed by the period from 3:30PM to 5:00PM. These time-slots correspond to
the times of the day when people commute from work to either home or a place of study.
19.1
17.5
14.9
14.7
10.1
8.7
8.0
6.9
0 5 10 15 20 25 30
Beggars
Drunks, drug addicts, homeless and insane people
Graffiti on walls and buildings
Informal commerce
Individuals with appearance of gang members
Derelict houses and buildings
Houses and buildings in bad conditions
Vandalism and property damage
% Observations
PREVENTING PUBLIC TRANSPORT CRIME IN EL SALVADOR
12
Figure 7: Average Number of Persons Waiting for a Bus or Microbus on Boarding Points
Usually, the spaces that are used as bus stops have areas between 4 and 6 𝑚2. During peak hours,
the density of passengers might vary between 1.9 and 6.2 persons per 𝑚2 suggesting a level of
crowding that is high by any standard.
d) Presence of police and other security in bus stops
In El Salvador, there is only one police force which according to the Salvadoran constitution is
responsible for the public safety of the general population. Such a force is named National Civilian
Police (PNC). The PNC assists the Attorney’s General Department (Fiscalia General de la Republica)
with crime investigation and the apprehension of suspects and persons charged with the
commission of crimes. Also, the PNC is responsible for the immediate apprehension of individuals
following their involvement in criminal incidents. It is important to notice the fact that the PNC has
no prosecution powers. The PNC has an estimated 21,000 members.
The largest municipalities have police forces known as Municipal Agents Bodies (CAM) that are
responsible for the security of municipal assets and for the enforcement of local regulations related
to public order. The CAMs cannot apprehend criminals or become involved in the investigation of
crimes but can cooperate with the PNC in public safety tasks.
Finally, there are an estimated number of 30,000 guards who are employees of private security
agencies that provide security services to particulars, businesses and government. The employees
of the security agencies cannot apprehend criminals or become involved in the investigation of
crimes.
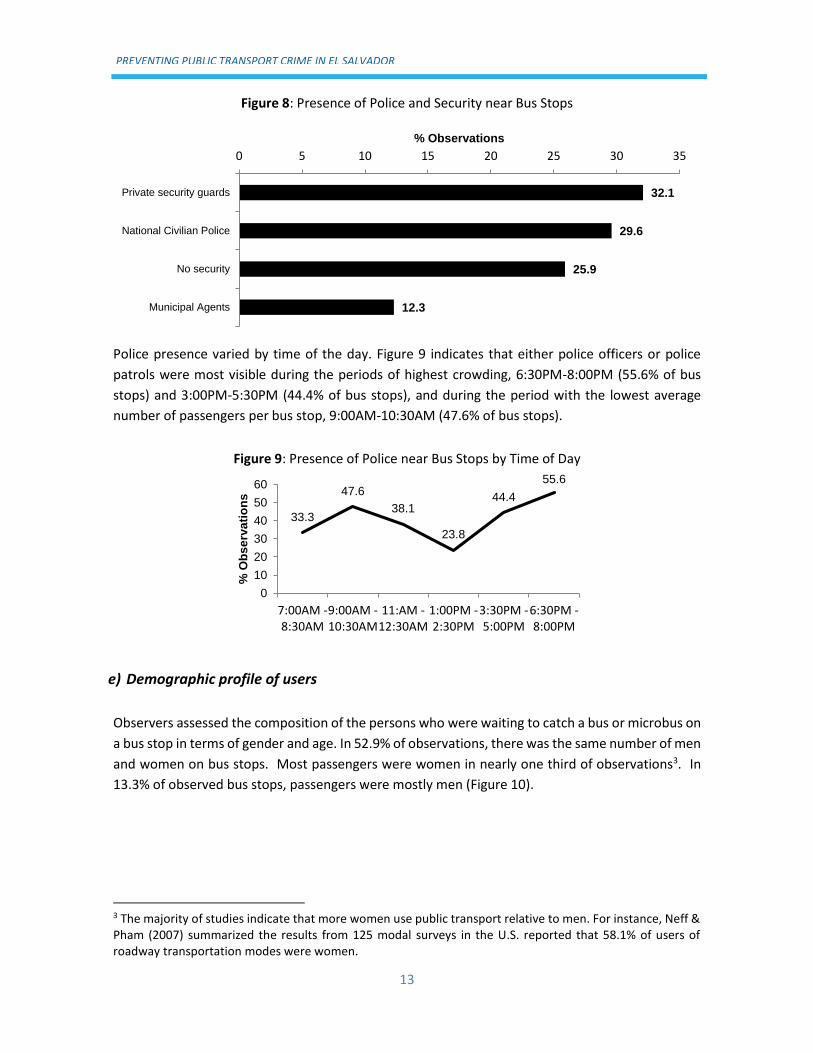
The data in Figure 8 show that private security guards were the most visible form of security near
the observed bus stops (32.1%) followed by patrols or officers of the National Civilian Police (29.6%).
Municipal agents were visible in 12.3% of observes bus stops. Finally, in 25.9% of the observed bus
stops there was not nearby security provided by the police or otherwise.
24.9
16.9
15.6
14.4
13.5
11.3
0 5 10 15 20 25 30
6:30PM - 8:00PM
3:30PM - 5:00PM
7:00AM - 8:30AM
1:00PM - 2:30PM
11:AM - 12:30AM
9:00AM - 10:30AM
% Observations
13
PREVENTING PUBLIC TRANSPORT CRIME IN EL SALVADOR
Figure 8: Presence of Police and Security near Bus Stops
Police presence varied by time of the day. Figure 9 indicates that either police officers or police
patrols were most visible during the periods of highest crowding, 6:30PM-8:00PM (55.6% of bus
stops) and 3:00PM-5:30PM (44.4% of bus stops), and during the period with the lowest average
number of passengers per bus stop, 9:00AM-10:30AM (47.6% of bus stops).
Figure 9: Presence of Police near Bus Stops by Time of Day
e) Demographic profile of users
Observers assessed the composition of the persons who were waiting to catch a bus or microbus on
a bus stop in terms of gender and age. In 52.9% of observations, there was the same number of men
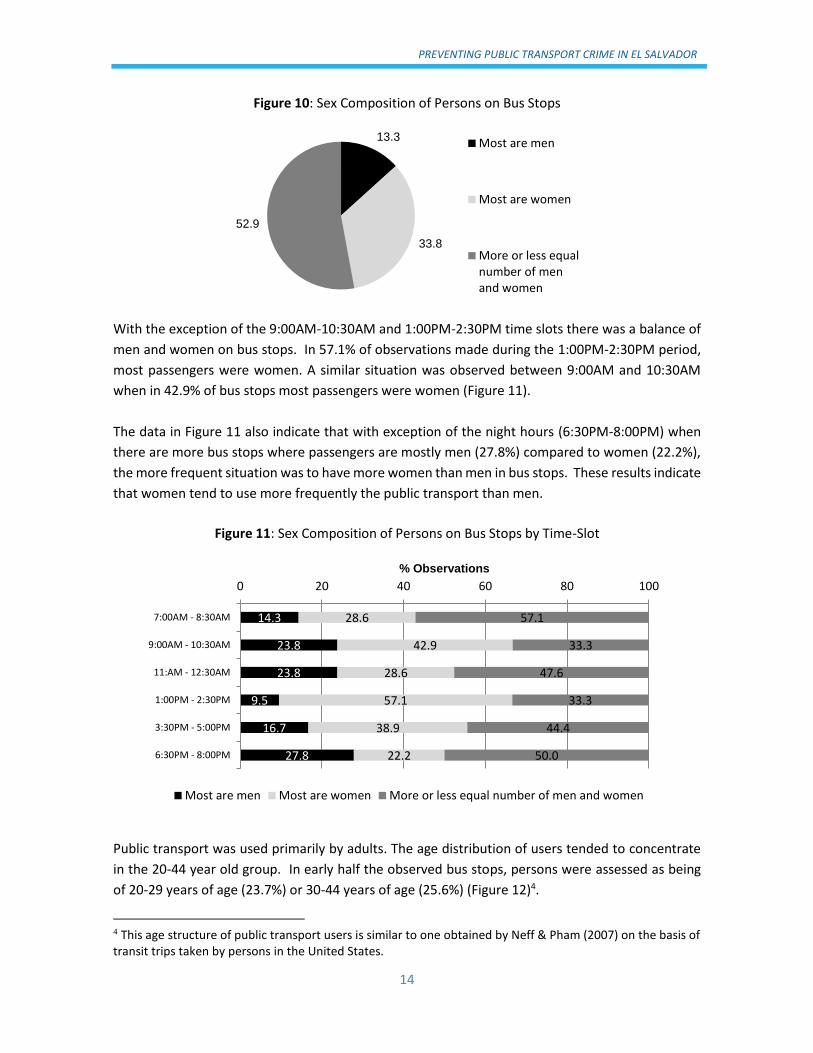
and women on bus stops. Most passengers were women in nearly one third of observations3. In
13.3% of observed bus stops, passengers were mostly men (Figure 10).
3 The majority of studies indicate that more women use public transport relative to men. For instance, Neff & Pham (2007) summarized the results from 125 modal surveys in the U.S. reported that 58.1% of users of roadway transportation modes were women.
32.1
29.6
25.9
12.3
0 5 10 15 20 25 30 35
Private security guards
National Civilian Police
No security
Municipal Agents
% Observations
33.3
47.6
38.1
23.8
44.4
55.6
0
10
20
30
40
50
60
7:00AM -8:30AM
9:00AM -10:30AM
11:AM -12:30AM
1:00PM -2:30PM
3:30PM -5:00PM
6:30PM -8:00PM
% O
bs
erv
ati
on
s
PREVENTING PUBLIC TRANSPORT CRIME IN EL SALVADOR
14
Figure 10: Sex Composition of Persons on Bus Stops
With the exception of the 9:00AM-10:30AM and 1:00PM-2:30PM time slots there was a balance of
men and women on bus stops. In 57.1% of observations made during the 1:00PM-2:30PM period,
most passengers were women. A similar situation was observed between 9:00AM and 10:30AM
when in 42.9% of bus stops most passengers were women (Figure 11).
The data in Figure 11 also indicate that with exception of the night hours (6:30PM-8:00PM) when
there are more bus stops where passengers are mostly men (27.8%) compared to women (22.2%),
the more frequent situation was to have more women than men in bus stops. These results indicate
that women tend to use more frequently the public transport than men.
Figure 11: Sex Composition of Persons on Bus Stops by Time-Slot
Public transport was used primarily by adults. The age distribution of users tended to concentrate
in the 20-44 year old group. In early half the observed bus stops, persons were assessed as being
of 20-29 years of age (23.7%) or 30-44 years of age (25.6%) (Figure 12)4.
4 This age structure of public transport users is similar to one obtained by Neff & Pham (2007) on the basis of transit trips taken by persons in the United States.
13.3
33.8
52.9
Most are men
Most are women
More or less equalnumber of menand women
14.3
23.8
23.8
9.5
16.7
27.8
28.6
42.9
28.6
57.1
38.9
22.2
57.1
33.3
47.6
33.3
44.4
50.0
0 20 40 60 80 100
7:00AM - 8:30AM
9:00AM - 10:30AM
11:AM - 12:30AM
1:00PM - 2:30PM
3:30PM - 5:00PM
6:30PM - 8:00PM
% Observations
Most are men Most are women More or less equal number of men and women

15
PREVENTING PUBLIC TRANSPORT CRIME IN EL SALVADOR
Figure 12: Assessed Age Composition of Persons on Bus Stops
Children, either in the company of an adult or not, were identified in 15.7% of observed bus stops,
and persons in ages between 15 and 19 years were observed in 16.2% of bus stops. This composition
remained unchanged when examined across time-slots.
f) Incidents occurring on bus stops
Observers recorded whether any kind of incident, criminal or otherwise, did occur to any of the
persons while waiting for a bus or microbus, or not. An incident occurred in 5.8% of observed bus
stops. The most common types of incidents were verbal abuse against a passenger (60% of cases)
and attempted theft from a passenger (30% of cases). An actual theft from a passenger was
observed in 10% of cases.
5.2 Boarding a bus or microbus
Except when departing from the terminal or point of origin of the route, the buses or microbuses
already have passengers. How crowded is a bus or microbus at the moment of arriving at a bus stop
may generate complications for those passengers when trying to step in a public transport unit.
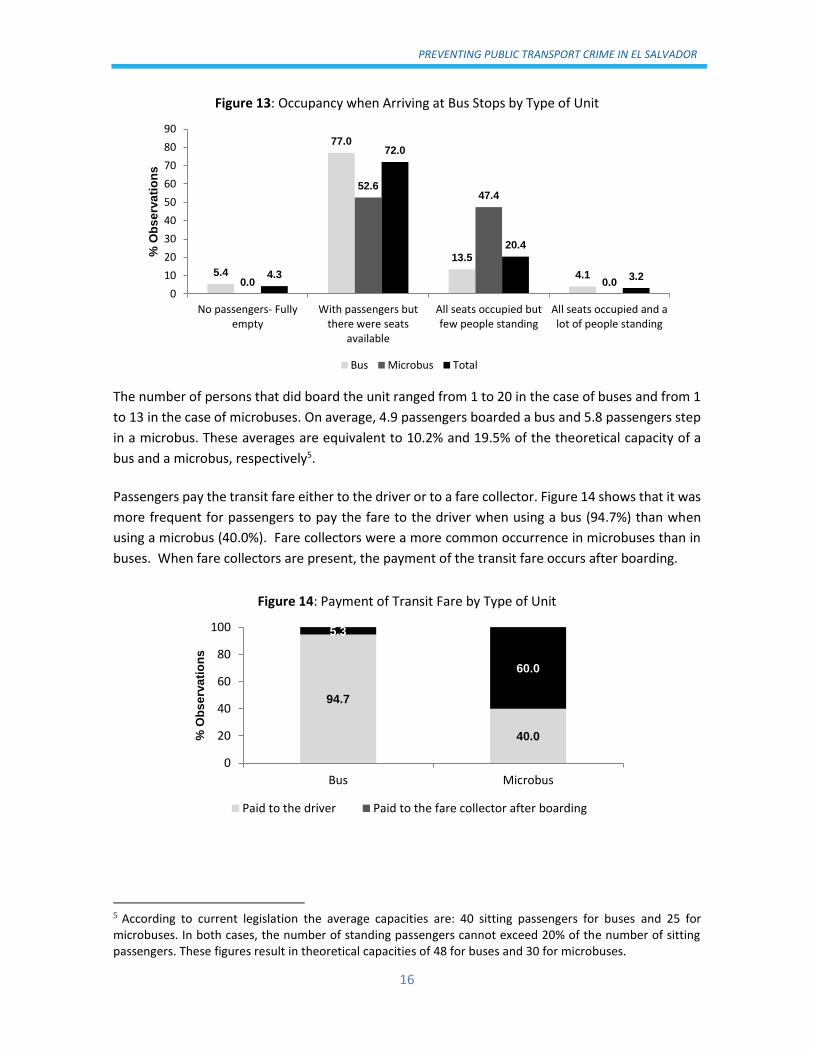
Figure 13 shows data on the occupancy of the unit by whether it was a bus or a microbus. This data
exclude those cases where the bus or microbus was departing from the point of origin of the route.
The most common situation was for both buses and microbuses already carrying passengers but
with available seats at the moment of arriving at bus stops (77.0% of observations on buses and
52.6% of observations on microbuses). The second most common situation corresponded to both
buses and microbuses having all seats occupied but few people standing (13.5% of observations on
buses and 47.4% of observations on microbuses). These results indicate that apparently the buses
or microbuses arriving at a bus stop had space available to accommodate waiting passengers.
1.0
14.7
16.2
23.7
25.6
13.3
5.6
0 5 10 15 20 25 30
Children traveling alone
Children accompanied by an adult
Youth (15-19 years)
Young adults (20-29 years)
Adults (30-44 years)
Older adults (45-60 years)
Seniors (Over 60 years)
% Observations
PREVENTING PUBLIC TRANSPORT CRIME IN EL SALVADOR
16
Figure 13: Occupancy when Arriving at Bus Stops by Type of Unit
The number of persons that did board the unit ranged from 1 to 20 in the case of buses and from 1
to 13 in the case of microbuses. On average, 4.9 passengers boarded a bus and 5.8 passengers step
in a microbus. These averages are equivalent to 10.2% and 19.5% of the theoretical capacity of a
bus and a microbus, respectively5.
Passengers pay the transit fare either to the driver or to a fare collector. Figure 14 shows that it was
more frequent for passengers to pay the fare to the driver when using a bus (94.7%) than when
using a microbus (40.0%). Fare collectors were a more common occurrence in microbuses than in
buses. When fare collectors are present, the payment of the transit fare occurs after boarding.
Figure 14: Payment of Transit Fare by Type of Unit
5 According to current legislation the average capacities are: 40 sitting passengers for buses and 25 for microbuses. In both cases, the number of standing passengers cannot exceed 20% of the number of sitting passengers. These figures result in theoretical capacities of 48 for buses and 30 for microbuses.
5.4
77.0
13.5
4.10.0
52.647.4
0.04.3
72.0
20.4
3.2
0
10
20
30
40
50
60
70
80
90
No passengers- Fullyempty
With passengers butthere were seats
available
All seats occupied butfew people standing
All seats occupied and alot of people standing
% O
bs
erv
ati
on
s
Bus Microbus Total
94.7
40.0
5.3
60.0
0
20
40
60
80
100
Bus Microbus
% O
bs
erv
ati
on
s
Paid to the driver Paid to the fare collector after boarding

17
PREVENTING PUBLIC TRANSPORT CRIME IN EL SALVADOR
Incidents of any type may happen at the moment a passenger pays for the ride. This was a rare
occurrence for the observed routes as only one incident out of the 120 observations was recorded.
The incident in question involved a woman dropping off the change obtained from the driver on the
bus step but the driver did not allow her to have enough time to pick it up. This caused an argument
between the driver and the passenger.
5.3 Travelling in a bus or microbus
a) Passenger location
In 53.3% of observation, most passengers tended to accommodate themselves in the middle part
of the bus or microbus; 31.7% did it near the exit door; and 15.0%, near the entrance (Figure 15).
This pattern did not change across time slots.
Figure 15: Place inside the Bus or Microbus where Most Passengers Sought Accommodation
b) Bus stopping
According to current legislation urban bus stops must be 500 meters apart from each other. By
definition, any stop made at a distance shorter than 500 meters would be illegal. On average, a bus
did stop 40.93 times to collect passengers along a route, whereas a microbus did it on 41.1
occasions. Figure 16 shows that 23.6% of the stops made by buses and 27.1% of the stops made by
microbuses were illegal.
Figure 16: Unauthorized bus stops as a Percentage of Total Average Bus Stops by Type of Unit
15.0
53.3
31.7
0
10
20
30
40
50
60
Near the entrance In the middle Near the exit door
% O
bs
erv
ati
on
s
23.6
27.1
0
5
10
15
20
25
30
Bus Microbus
% U
na
uth
ori
ze
d b
us
s
top
s
PREVENTING PUBLIC TRANSPORT CRIME IN EL SALVADOR
18
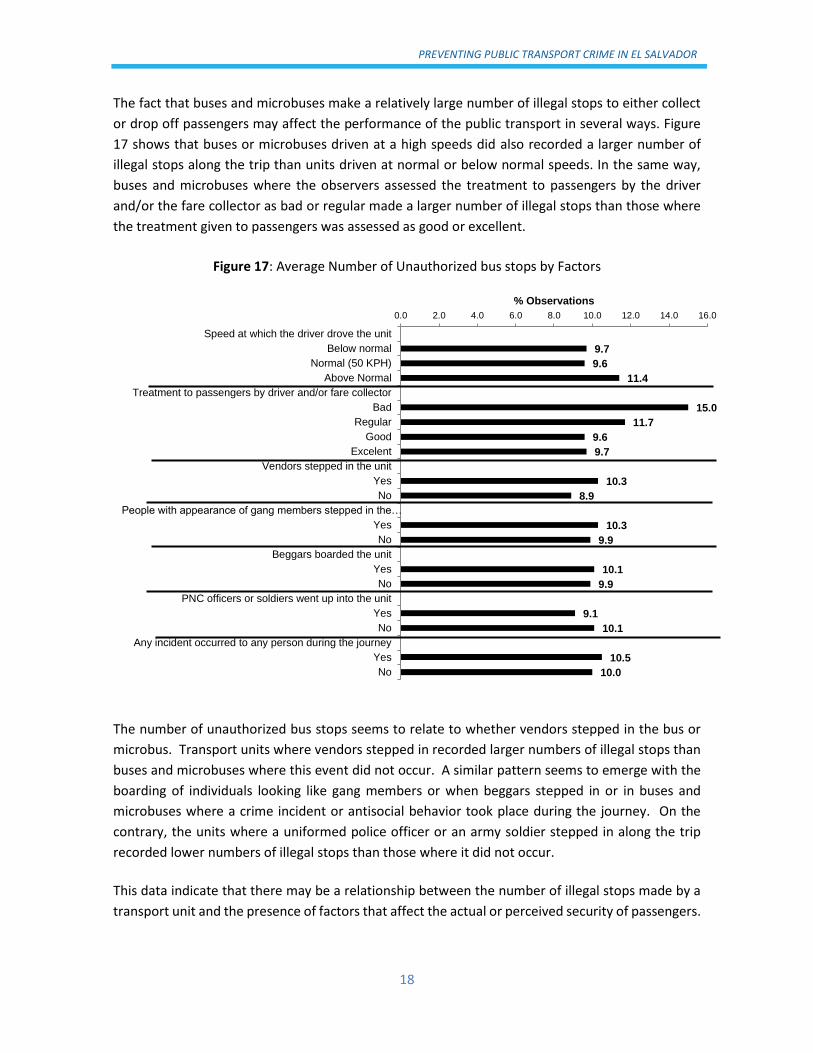
The fact that buses and microbuses make a relatively large number of illegal stops to either collect
or drop off passengers may affect the performance of the public transport in several ways. Figure
17 shows that buses or microbuses driven at a high speeds did also recorded a larger number of
illegal stops along the trip than units driven at normal or below normal speeds. In the same way,
buses and microbuses where the observers assessed the treatment to passengers by the driver
and/or the fare collector as bad or regular made a larger number of illegal stops than those where
the treatment given to passengers was assessed as good or excellent.
Figure 17: Average Number of Unauthorized bus stops by Factors
The number of unauthorized bus stops seems to relate to whether vendors stepped in the bus or
microbus. Transport units where vendors stepped in recorded larger numbers of illegal stops than
buses and microbuses where this event did not occur. A similar pattern seems to emerge with the
boarding of individuals looking like gang members or when beggars stepped in or in buses and
microbuses where a crime incident or antisocial behavior took place during the journey. On the
contrary, the units where a uniformed police officer or an army soldier stepped in along the trip
recorded lower numbers of illegal stops than those where it did not occur.
This data indicate that there may be a relationship between the number of illegal stops made by a
transport unit and the presence of factors that affect the actual or perceived security of passengers.
9.7
9.6
11.4
15.0
11.7
9.6
9.7
10.3
8.9
10.3
9.9
10.1
9.9
9.1
10.1
10.5
10.0
0.0 2.0 4.0 6.0 8.0 10.0 12.0 14.0 16.0
Speed at which the driver drove the unit
Below normal
Normal (50 KPH)
Above Normal
Treatment to passengers by driver and/or fare collector
Bad
Regular
Good
Excelent
Vendors stepped in the unit
Yes
No
People with appearance of gang members stepped in the…
Yes
No
Beggars boarded the unit
Yes
No
PNC officers or soldiers went up into the unit
Yes
No
Any incident occurred to any person during the journey
Yes
No
% Observations
19
PREVENTING PUBLIC TRANSPORT CRIME IN EL SALVADOR
c) Crime incidents
The passengers of 3.3% of the observed routes did experience a criminal or antisocial incident while
traveling on a transport unit. In half of these incidents something was stolen from a passenger. In
one quarter of incidents someone attempted to steal something from a passenger. In the remaining
quarter, a passenger was verbally abused.
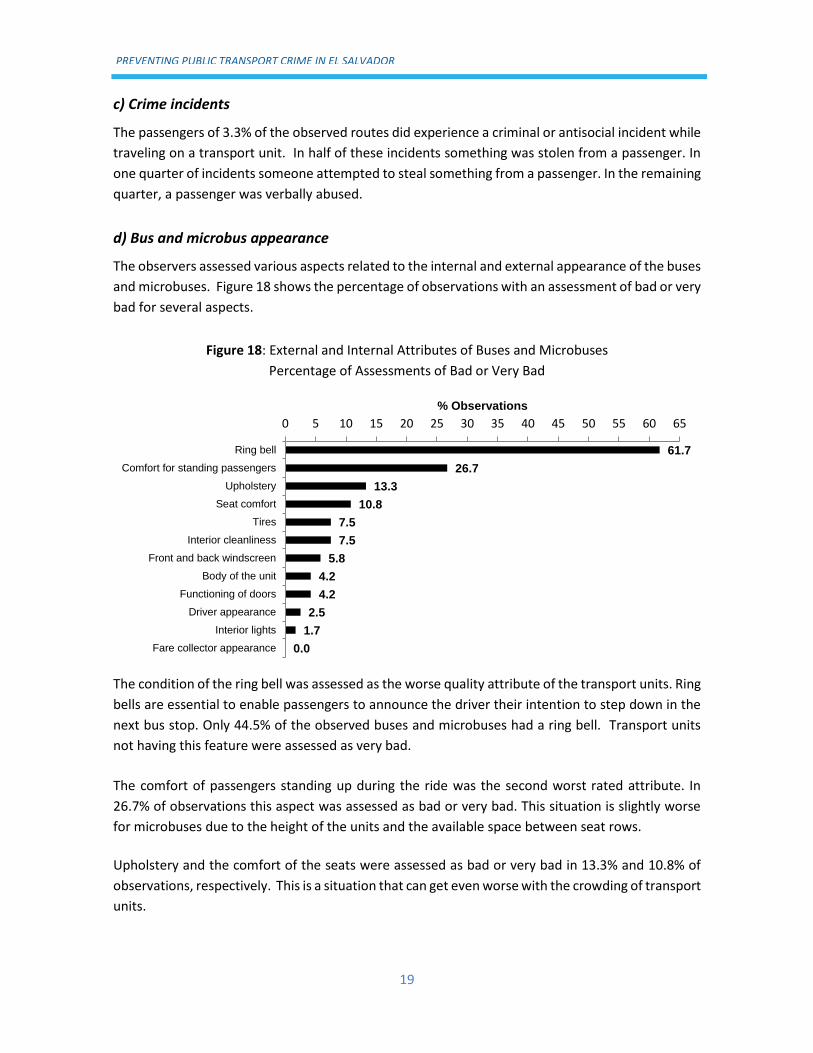
d) Bus and microbus appearance
The observers assessed various aspects related to the internal and external appearance of the buses
and microbuses. Figure 18 shows the percentage of observations with an assessment of bad or very
bad for several aspects.
Figure 18: External and Internal Attributes of Buses and Microbuses
Percentage of Assessments of Bad or Very Bad
The condition of the ring bell was assessed as the worse quality attribute of the transport units. Ring
bells are essential to enable passengers to announce the driver their intention to step down in the
next bus stop. Only 44.5% of the observed buses and microbuses had a ring bell. Transport units
not having this feature were assessed as very bad.
The comfort of passengers standing up during the ride was the second worst rated attribute. In
26.7% of observations this aspect was assessed as bad or very bad. This situation is slightly worse
for microbuses due to the height of the units and the available space between seat rows.
Upholstery and the comfort of the seats were assessed as bad or very bad in 13.3% and 10.8% of
observations, respectively. This is a situation that can get even worse with the crowding of transport
units.
61.7
26.7
13.3
10.8
7.5
7.5
5.8
4.2
4.2
2.5
1.7
0.0
0 5 10 15 20 25 30 35 40 45 50 55 60 65
Ring bell
Comfort for standing passengers
Upholstery
Seat comfort
Tires
Interior cleanliness
Front and back windscreen
Body of the unit
Functioning of doors
Driver appearance
Interior lights
Fare collector appearance
% Observations

PREVENTING PUBLIC TRANSPORT CRIME IN EL SALVADOR
20
The quality of the bus or microbus tires was assessed as bad or very bad in 7.5% of observations.
This is an aspect of foremost importance for the safety of passengers as tires in bad shape may be
the cause of traffic fatalities, especially with slippery roads.
Other aspects assessed as bad or very bad were the interior cleanliness (7.5%), the front and back
windscreens (5.8%), the bus body (4.5%), the functioning of doors (4.5%), driver appearance (2.7%)
and interior lights (1.7%).
e) Incivilities
Graffiti on bus o microbus interior walls was the most commonly observed form of incivility being
observed (65.8% of rides). Seats in bad condition (55.8%), polarized windscreen and window glasses
(40.8%), windows in bad condition (32.5%) and interior advertisement affecting visibility were other
forms of physical incivility that were observed. The presence of beggars inside the units (45.8%)
was the most frequently observed form of social incivility followed by loud music inside the unit
(43.3%). The presence of individuals with the appearance of gang members was observed in 15.0%
of trips (Figure 19).
Figure 19: Incivilities inside Buses and Microbuses
6. CONCLUSIONS This paper has addressed the two settings contained by the Salvadoran public transport system,
namely bus stops and modes of transport in San Salvador and neighboring municipalities. The
purpose was to examine the external and internal environments of the transport units.
In general, bus stops are located in residential areas, commercial areas and in places characterized
by intense pedestrian activity. Irrespective of their location, the bus stops and the places around
them are characterized by the presence of social incivilities (such as beggars, drunk and vagrant
people), graffiti on walls and buildings, and informal commerce.
65.8
55.8
45.8
43.3
40.8
32.5
23.3
15.0
0 5 10 15 20 25 30 35 40 45 50 55 60 65 70
Graffiti on bus-microbus walls
Seats in bad condition
Beggars inside the unit
Loud music
Polarized windscreens and window glasses
Windows in bad condition
Interior advertisement affectingvisibility
Individuals with appearance of gang members inside…
% Observations
21
PREVENTING PUBLIC TRANSPORT CRIME IN EL SALVADOR
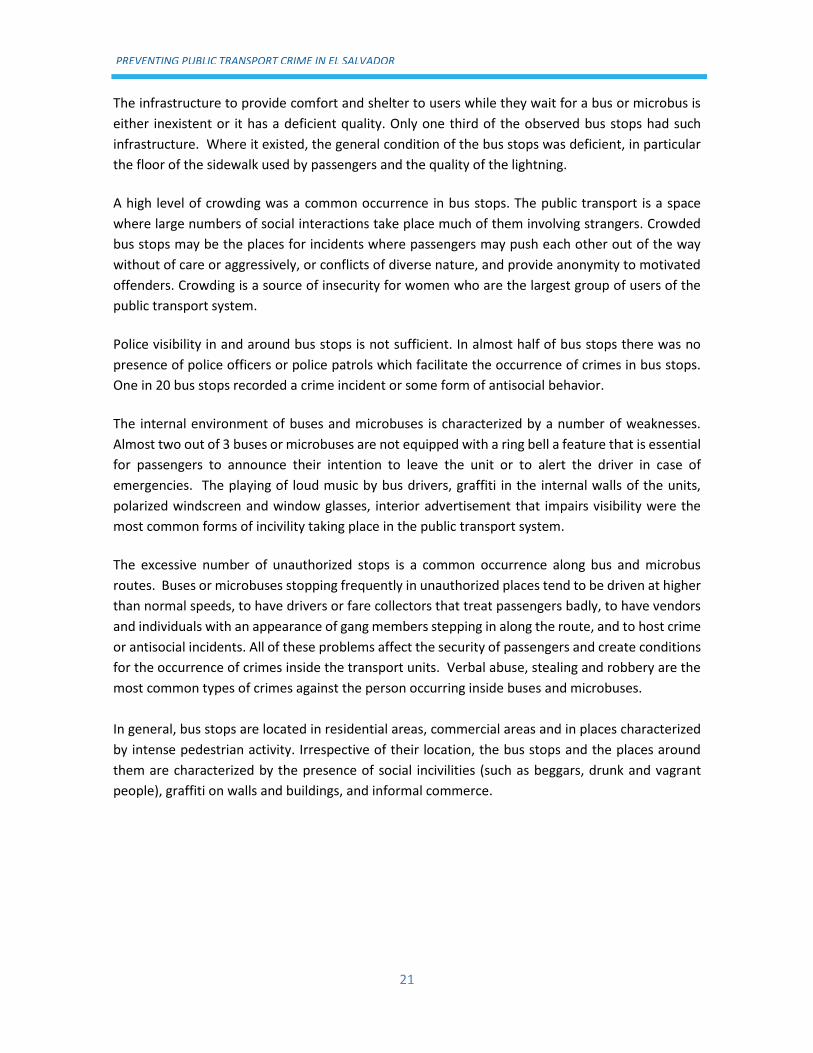
The infrastructure to provide comfort and shelter to users while they wait for a bus or microbus is
either inexistent or it has a deficient quality. Only one third of the observed bus stops had such
infrastructure. Where it existed, the general condition of the bus stops was deficient, in particular
the floor of the sidewalk used by passengers and the quality of the lightning.
A high level of crowding was a common occurrence in bus stops. The public transport is a space
where large numbers of social interactions take place much of them involving strangers. Crowded
bus stops may be the places for incidents where passengers may push each other out of the way
without of care or aggressively, or conflicts of diverse nature, and provide anonymity to motivated
offenders. Crowding is a source of insecurity for women who are the largest group of users of the
public transport system.
Police visibility in and around bus stops is not sufficient. In almost half of bus stops there was no
presence of police officers or police patrols which facilitate the occurrence of crimes in bus stops.
One in 20 bus stops recorded a crime incident or some form of antisocial behavior.
The internal environment of buses and microbuses is characterized by a number of weaknesses.
Almost two out of 3 buses or microbuses are not equipped with a ring bell a feature that is essential
for passengers to announce their intention to leave the unit or to alert the driver in case of
emergencies. The playing of loud music by bus drivers, graffiti in the internal walls of the units,
polarized windscreen and window glasses, interior advertisement that impairs visibility were the
most common forms of incivility taking place in the public transport system.
The excessive number of unauthorized stops is a common occurrence along bus and microbus
routes. Buses or microbuses stopping frequently in unauthorized places tend to be driven at higher
than normal speeds, to have drivers or fare collectors that treat passengers badly, to have vendors
and individuals with an appearance of gang members stepping in along the route, and to host crime
or antisocial incidents. All of these problems affect the security of passengers and create conditions
for the occurrence of crimes inside the transport units. Verbal abuse, stealing and robbery are the
most common types of crimes against the person occurring inside buses and microbuses.
In general, bus stops are located in residential areas, commercial areas and in places characterized
by intense pedestrian activity. Irrespective of their location, the bus stops and the places around
them are characterized by the presence of social incivilities (such as beggars, drunk and vagrant
people), graffiti on walls and buildings, and informal commerce.
PREVENTING PUBLIC TRANSPORT CRIME IN EL SALVADOR
22
7. REFERENCES Asamblea Legislativa de El Salvador. (2011). Ley de Transporte Terrestre, Tránsito y Seguridad Vial.
San Salvador.
Clarke, R. V., & Smith, M. J. (2000). Crime and Public Transport. In M. Tonry (ed.), Crime and Justice:
A Review of Research, Vol. 27, p. 169-233.
Escuela Superior de Economía y Negocios (ESEN). (2013). Encuesta de Victimización en El Salvador
2012. San Salvador: Centro de Políticas Públicas.
Neff, J. & L. Pham, 2007, A Profile of Public Transportation Passenger Demographics and Travel
Characteristics Reported in On-Board Surveys, Washington DC: American Public Transportation
Association. Accessed 10/24/2014 from
http://www.apta.com/resources/statistics/Documents/transit_passenger_characteristics_text_5_
29_2007.pdf
Newton, A.D., 2004, Crime on Public Transport: ‘Static’ and ‘Non-Static’ (Moving) Crime Events,
Western Criminology Review, Vol. 5, No. 3, p. 25-42.

23
PREVENTING PUBLIC TRANSPORT CRIME IN EL SALVADOR
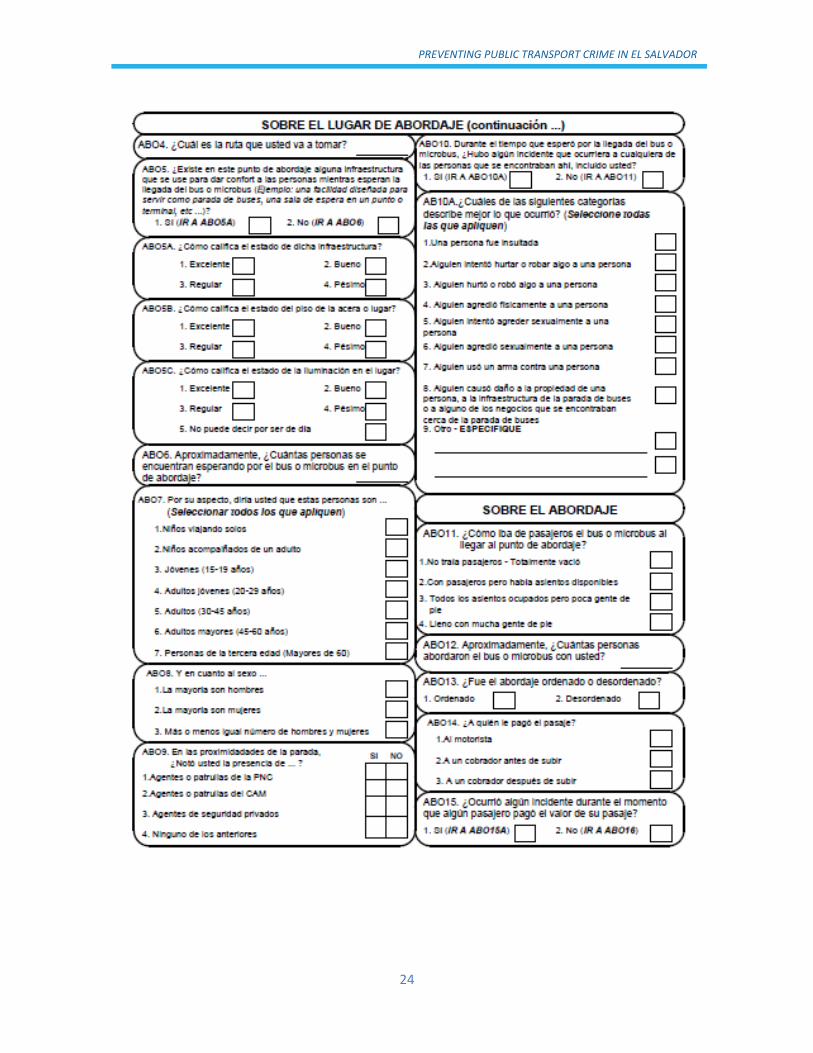
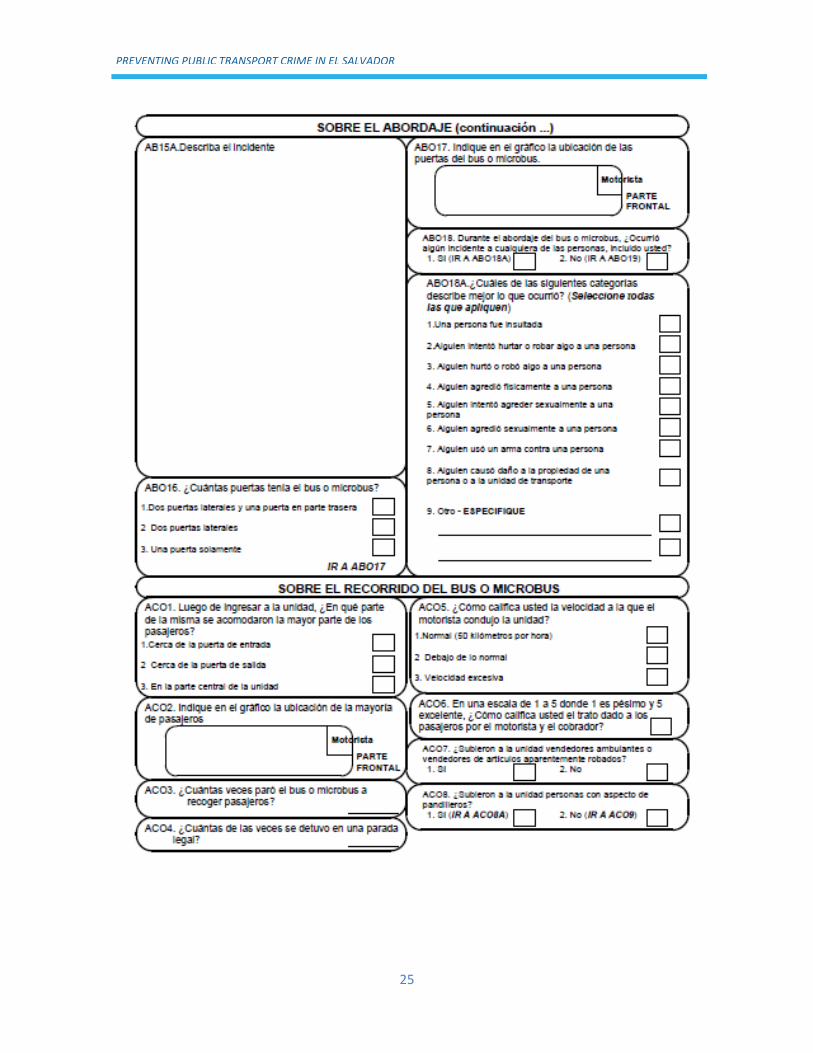
Appendix 1: Systematic observation guide
PREVENTING PUBLIC TRANSPORT CRIME IN EL SALVADOR
24
25
PREVENTING PUBLIC TRANSPORT CRIME IN EL SALVADOR

PREVENTING PUBLIC TRANSPORT CRIME IN EL SALVADOR
26


![A life course approach to preventing drugs & alcohol risks [March 2016 Int'l Crime & Policing Conference]](https://img.pdfslide.net/doc/110x75/58a73cad1a28ab84308b5f21/a-life-course-approach-to-preventing-drugs-alcohol-risks-march-2016-intl.jpg)