Embed Size (px)
Citation preview

1
SAMPLE SIZE CALCULATION
SPEAKER:- Dr.Swati Singh
2
THE OUTLINE
• What is sample size?• Basic information needed for sample size calculation.• Why to determine sample size?• How large a sample do we need?• What are the methods of determining it?• What are the factors that affect it?• Types of measurement in research.• How do we determine sample size?• Conclusion
3
WHAT IS A SAMPLE?• This is the sub-population, to be studied in order to draw a
inference from a reference population (a population to which the findings of the Study are to be generalized).
• In Census, the sample size is equal to the population size. However, in research, because of time constraints and budget, a representative sample is normally used.
• Larger the sample, more accurate will be the findings from a Study.
4
• Availability of resources sets upper limit of the sample size.
• Required accuracy sets lower limit of sample size.
• Thus, an optimum sample size is an essential component of any research.
5
BASIC INFORMATION NEEDED FOR SAMPLE SIZE CALCULATION
The approach to sample size calculation can be arrived at by thinking through the following set of questions:
• What type of study is this? Single sample (prevalence survey) Comparison of two groups (cross-sectional, case-control, cohort study)• What is the main (primary) outcome? Mean of a measurement (mean blood pressure) Proportion Ordered scale (pain scores)• What is the expected variability between the subjects?• How large a difference would be considered clinically important and
reasonable?
6
WHAT IS SAMPLE SIZE DETERMINATIONSample size determination is the mathematical estimation of the
number of subjects/units to be included in a study.
When a representative sample is taken from a population, the finding are generalized to the population.
Optimum sample size determination is required for the following reasons:
1. To allow appropriate analysis2. To provide desired level of accuracy3. To allow validity to the significance test.
7
HOW LARGE A SAMPLE DO WE NEED?
If the sample is too small:1. Even a well conducted Study may fail to answer it’s
research question.2. It may fail to detect important effects or
associations.3. It may associate this effect or association
imprecisely.
8
CONVERSELY
If the sample size is too large:1. The Study will be difficult and costly.2. Time constraint.3. Loss of accuracy.
Hence, optimum sample size must be determined before commencement of a Study.
9
Types of Measurement in Research
• Random error• Systematic error (bias)• Precision (reliability)• Accuracy (Validity)
• Power • Effect size• Design effect
10
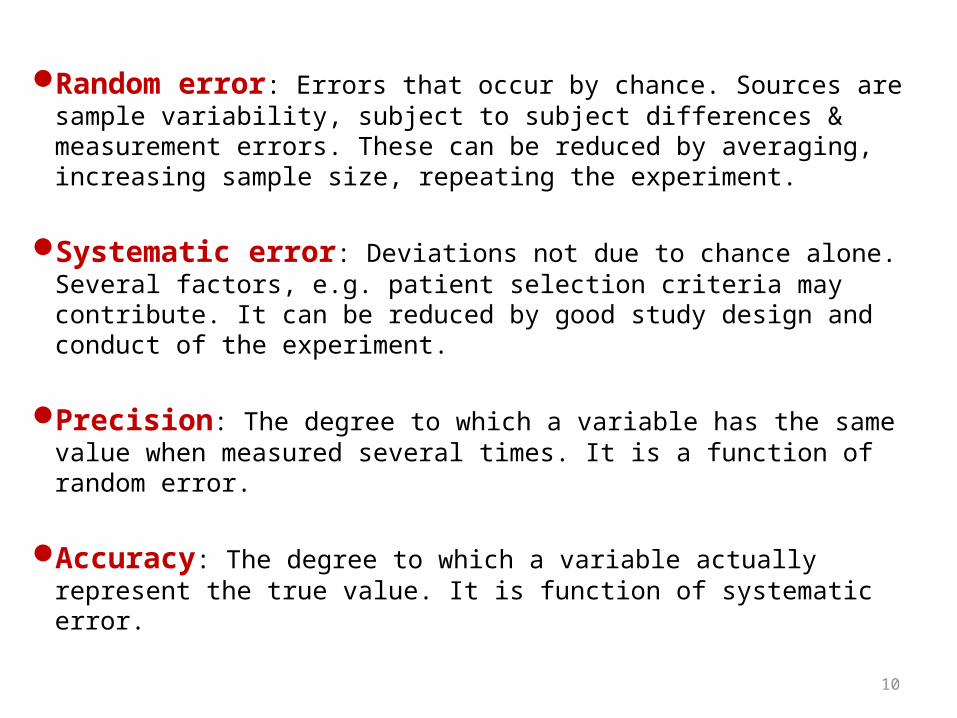
Random error: Errors that occur by chance. Sources are sample variability, subject to subject differences & measurement errors. These can be reduced by averaging, increasing sample size, repeating the experiment.
Systematic error: Deviations not due to chance alone. Several factors, e.g. patient selection criteria may contribute. It can be reduced by good study design and conduct of the experiment.
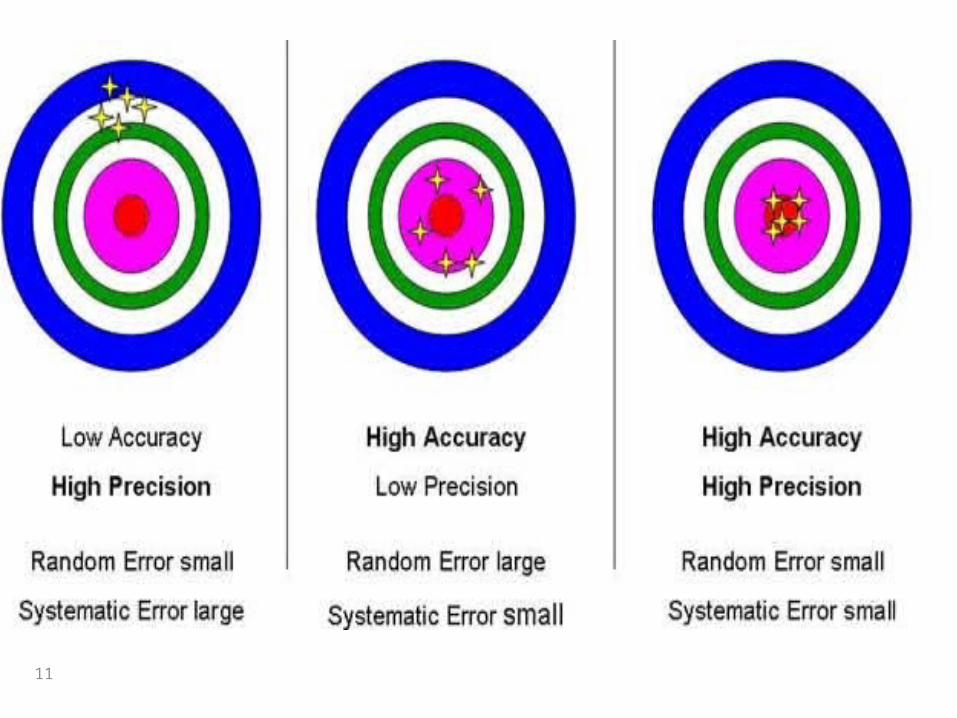
Precision: The degree to which a variable has the same value when measured several times. It is a function of random error.
Accuracy: The degree to which a variable actually represent the true value. It is function of systematic error.
11
12
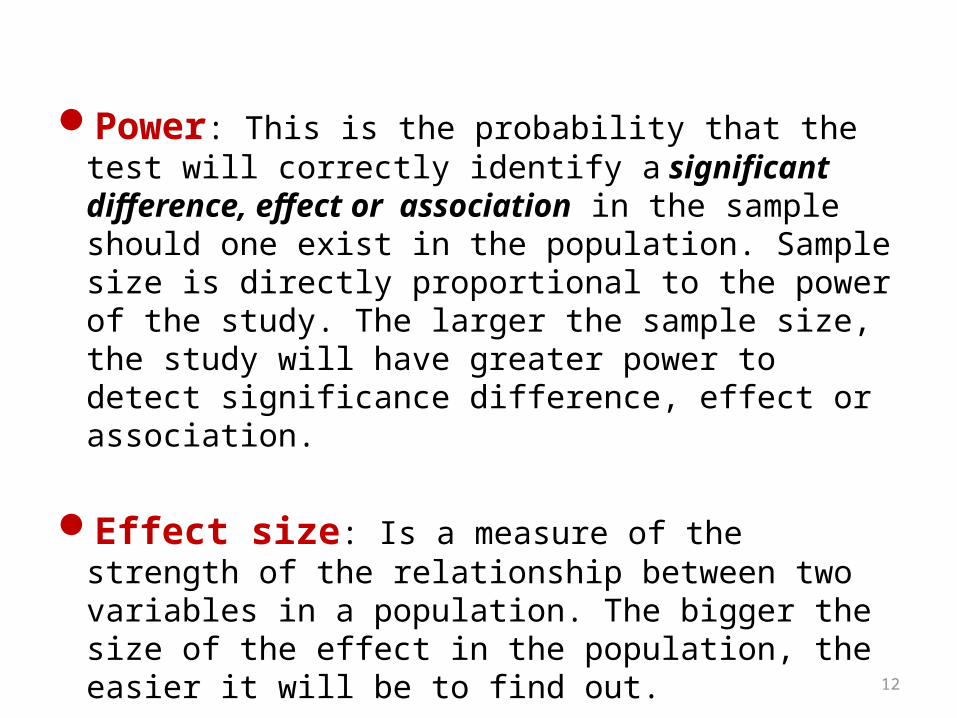
Power: This is the probability that the test will correctly identify a significant difference, effect or association in the sample should one exist in the population. Sample size is directly proportional to the power of the study. The larger the sample size, the study will have greater power to detect significance difference, effect or association.
Effect size: Is a measure of the strength of the relationship between two variables in a population. The bigger the size of the effect in the population, the easier it will be to find out.
13
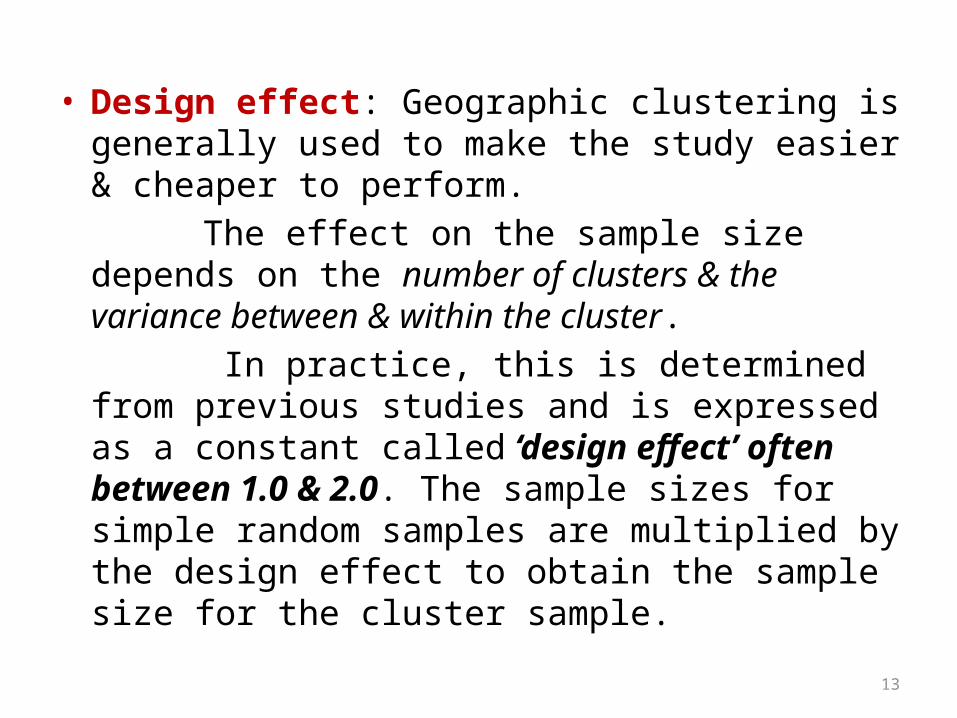
• Design effect: Geographic clustering is generally used to make the study easier & cheaper to perform.
The effect on the sample size depends on the number of clusters & the variance between & within the cluster.
In practice, this is determined from previous studies and is expressed as a constant called ‘design effect’ often between 1.0 & 2.0. The sample sizes for simple random samples are multiplied by the design effect to obtain the sample size for the cluster sample.
14
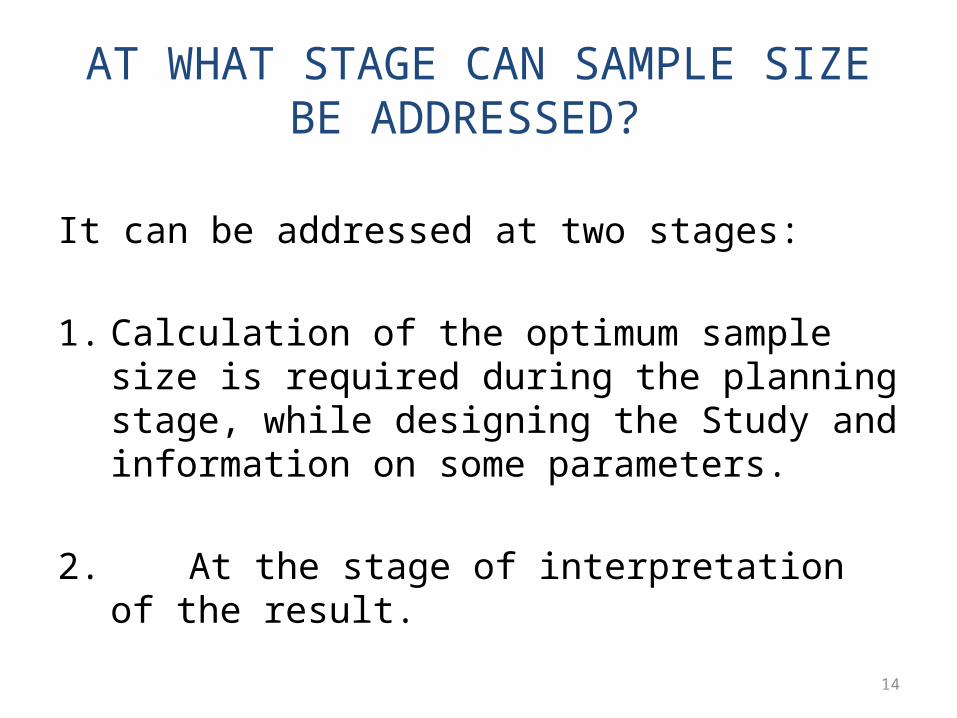
AT WHAT STAGE CAN SAMPLE SIZE BE ADDRESSED?
It can be addressed at two stages:
1. Calculation of the optimum sample size is required during the planning stage, while designing the Study and information on some parameters.
2. At the stage of interpretation of the result.
15
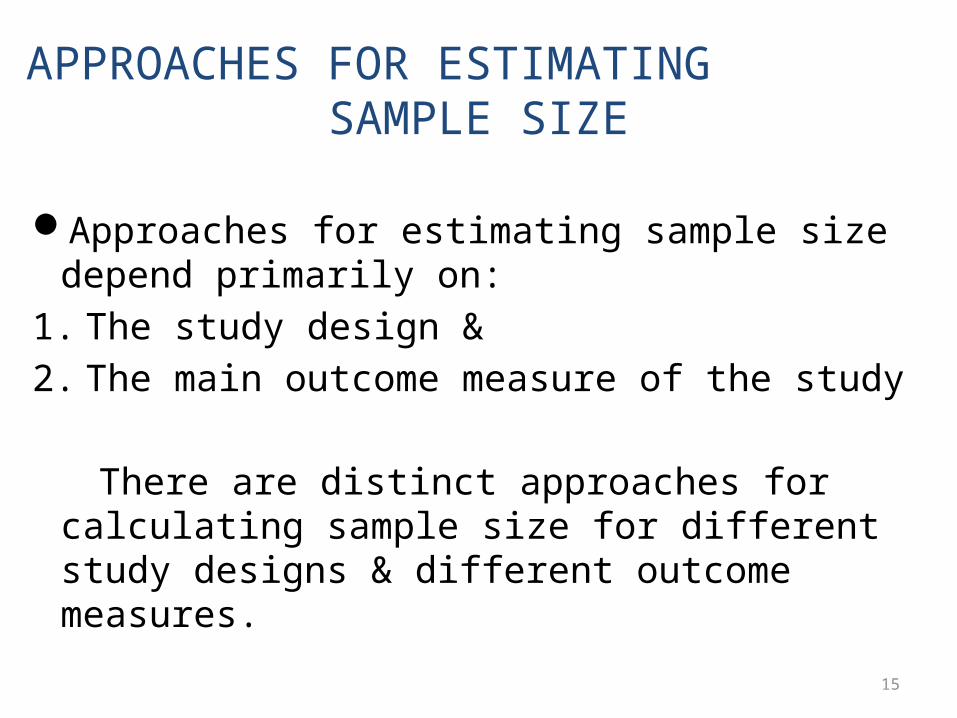
APPROACHES FOR ESTIMATING SAMPLE SIZE
Approaches for estimating sample size depend primarily on:
1. The study design &2. The main outcome measure of the study
There are distinct approaches for calculating sample size for different study designs & different outcome measures.
16
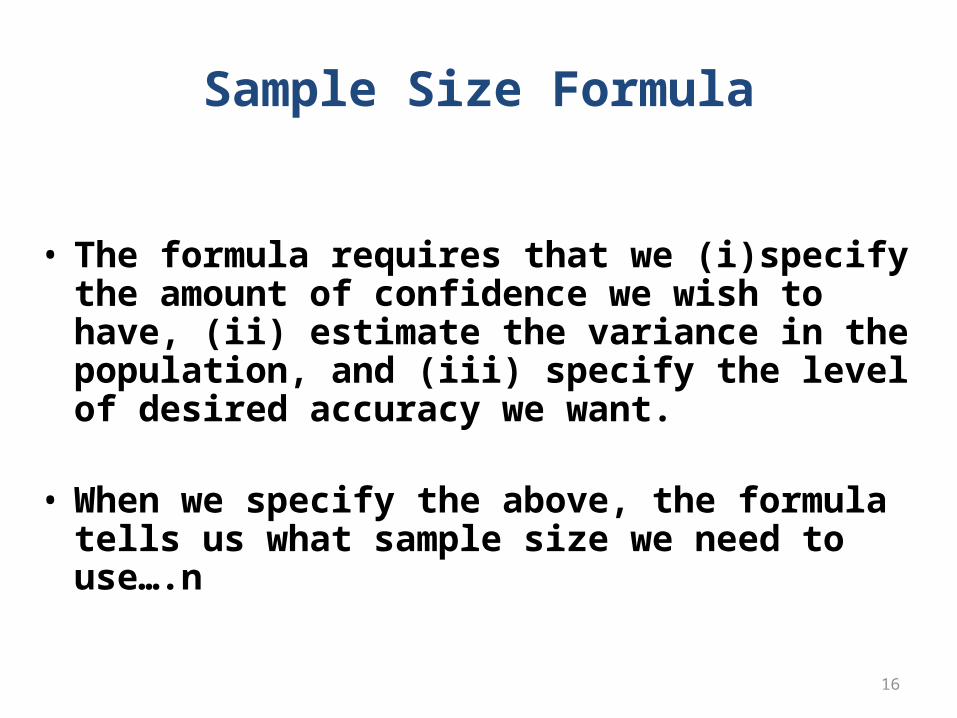
Sample Size Formula
• The formula requires that we (i)specify the amount of confidence we wish to have, (ii) estimate the variance in the population, and (iii) specify the level of desired accuracy we want.
• When we specify the above, the formula tells us what
sample size we need to use….n
17
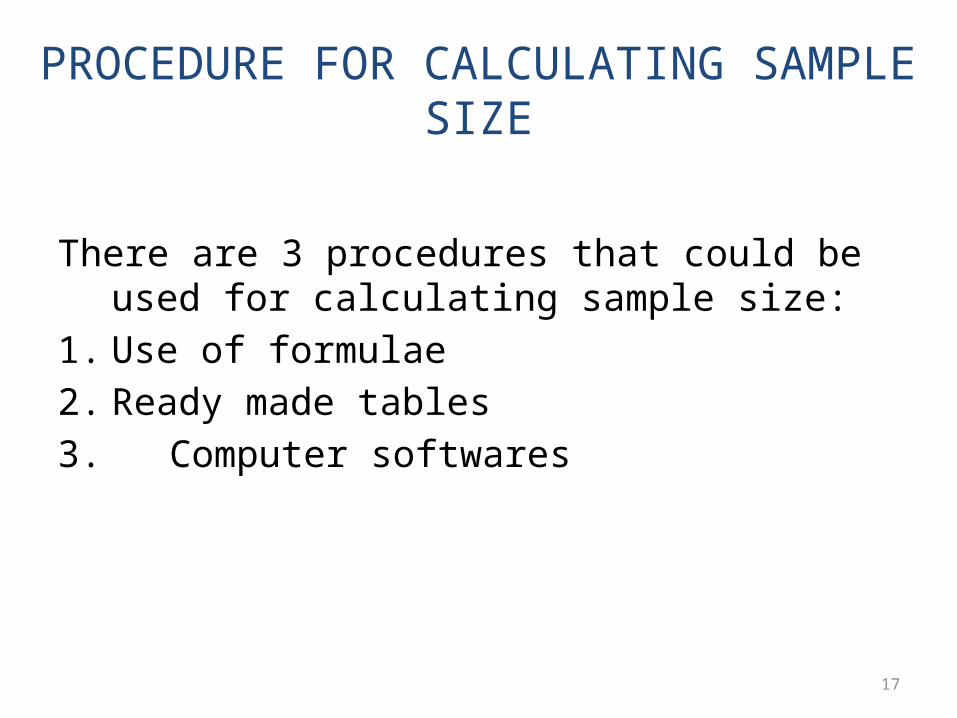
PROCEDURE FOR CALCULATING SAMPLE SIZE
There are 3 procedures that could be used for calculating sample size:
1. Use of formulae2. Ready made tables3. Computer softwares
18
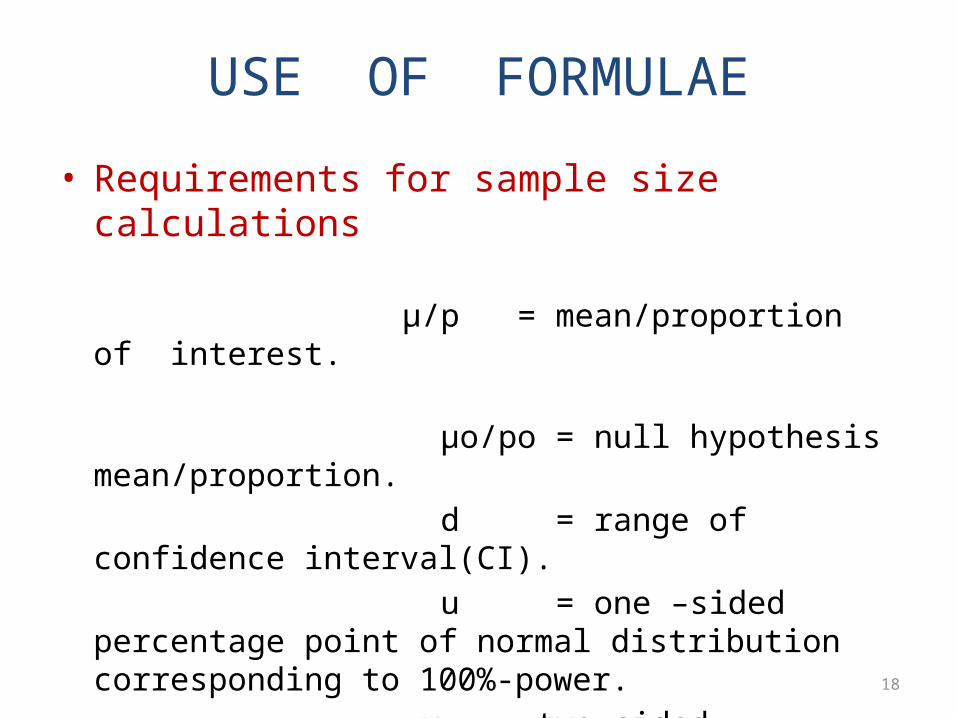
USE OF FORMULAE
• Requirements for sample size calculations
µ/p = mean/proportion of interest.
µo/po = null hypothesis mean/proportion. d = range of confidence interval(CI). u = one –sided percentage point of normal
distribution corresponding to 100%-power. v = two-sided percentage point of normal
distribution corresponding to required significance level.
19
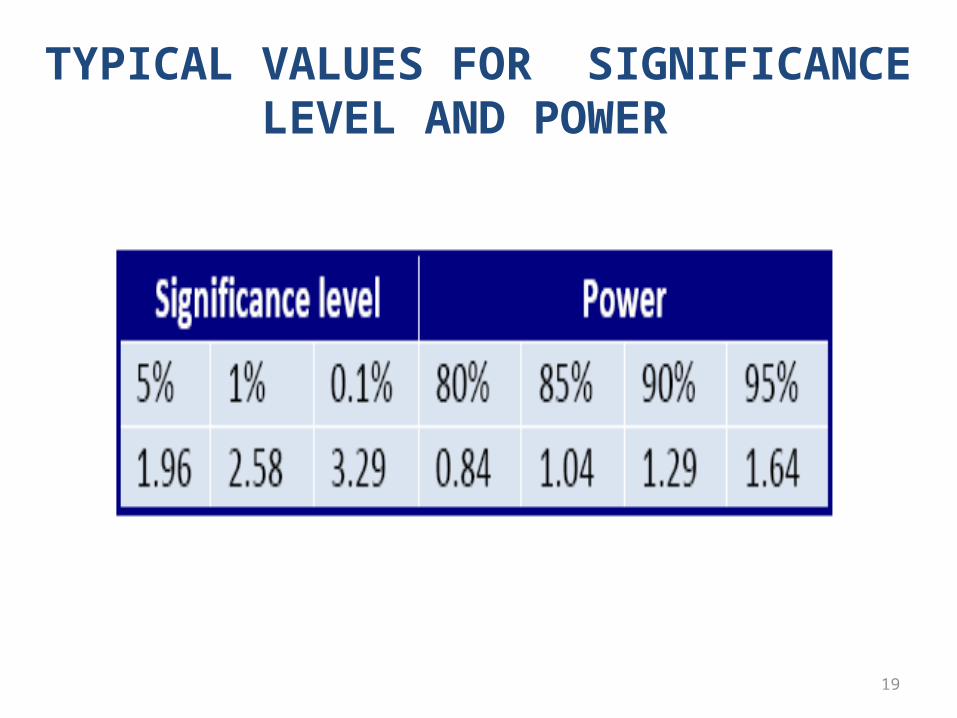
TYPICAL VALUES FOR SIGNIFICANCE LEVEL AND POWER
20
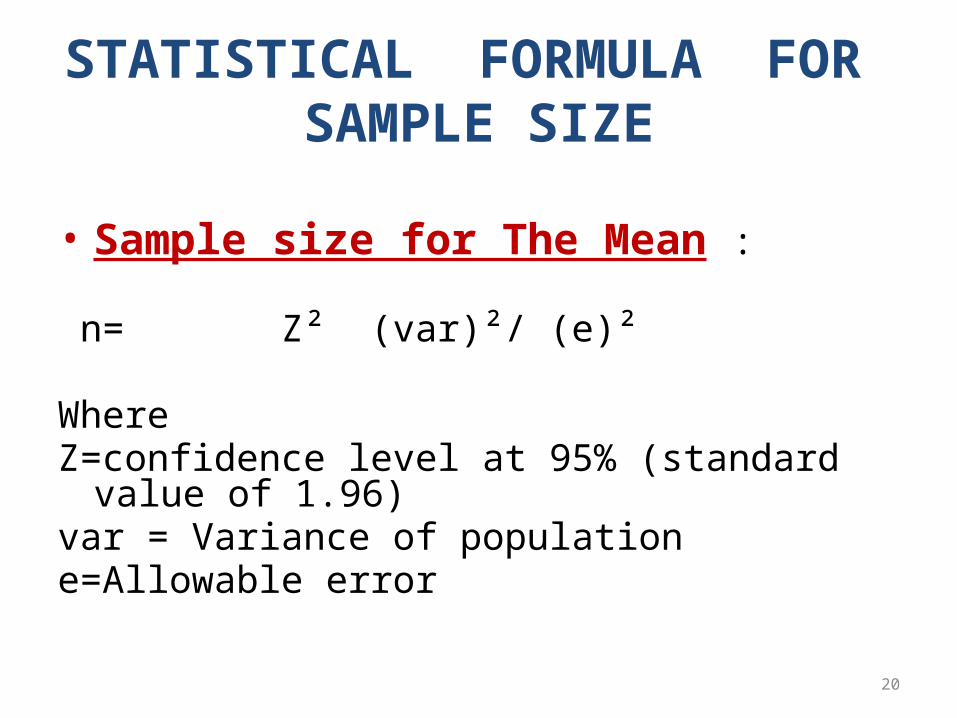
STATISTICAL FORMULA FOR SAMPLE SIZE
• Sample size for The Mean :
n= Z² (var)²/ (e)²
WhereZ=confidence level at 95% (standard value of 1.96)var = Variance of population e=Allowable error
21
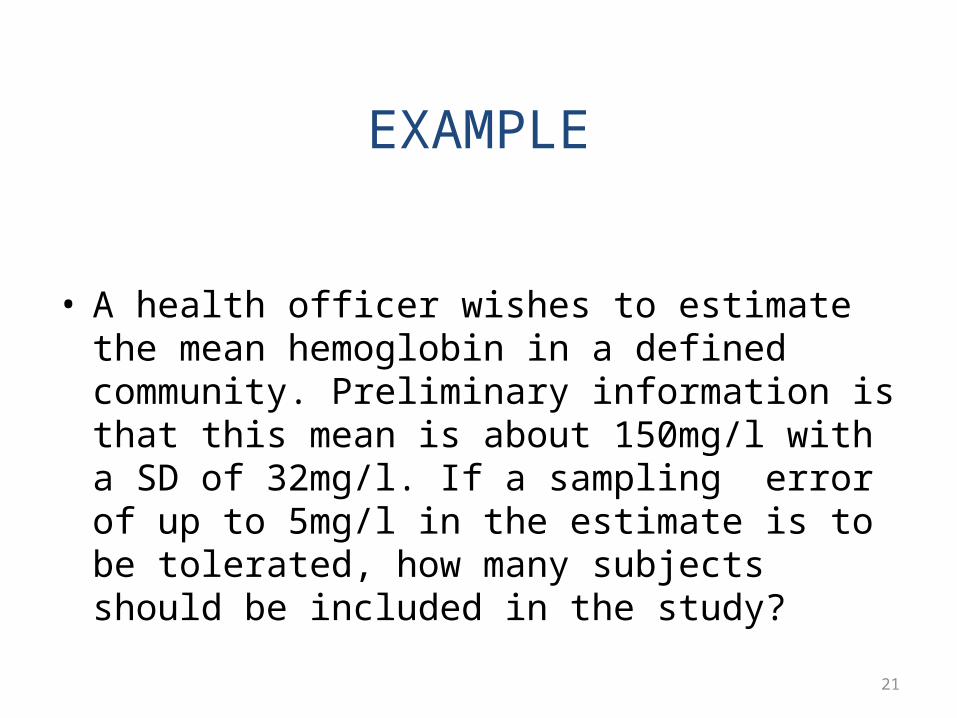
EXAMPLE
• A health officer wishes to estimate the mean hemoglobin in a defined community. Preliminary information is that this mean is about 150mg/l with a SD of 32mg/l. If a sampling error of up to 5mg/l in the estimate is to be tolerated, how many subjects should be included in the study?
22
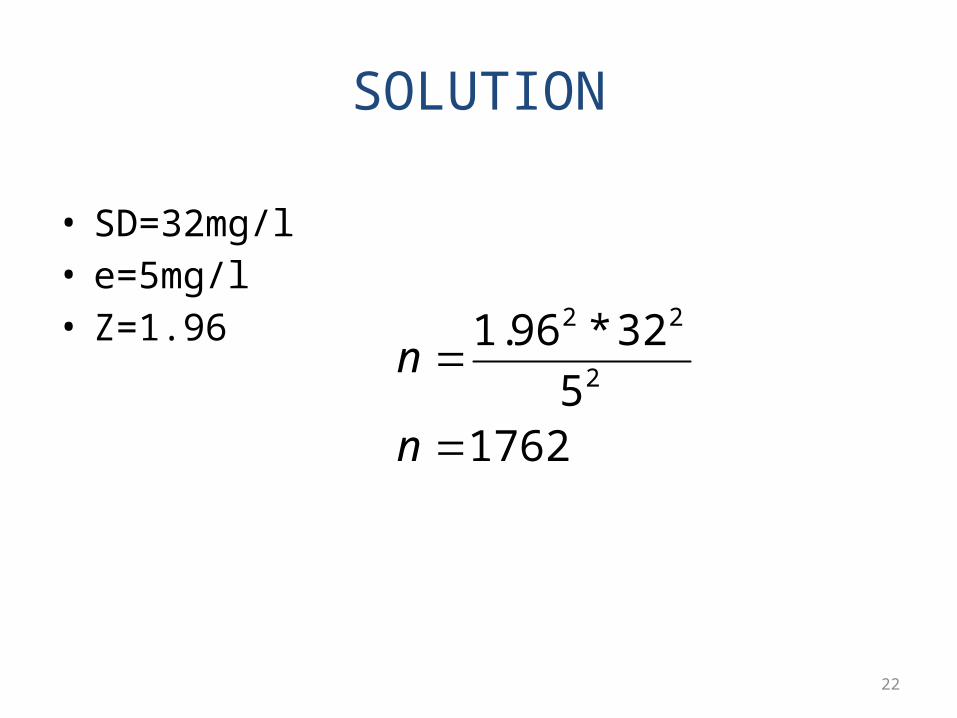
SOLUTION
• SD=32mg/l• e=5mg/l• Z=1.96
1762532*96.1
2
22
n
n
23
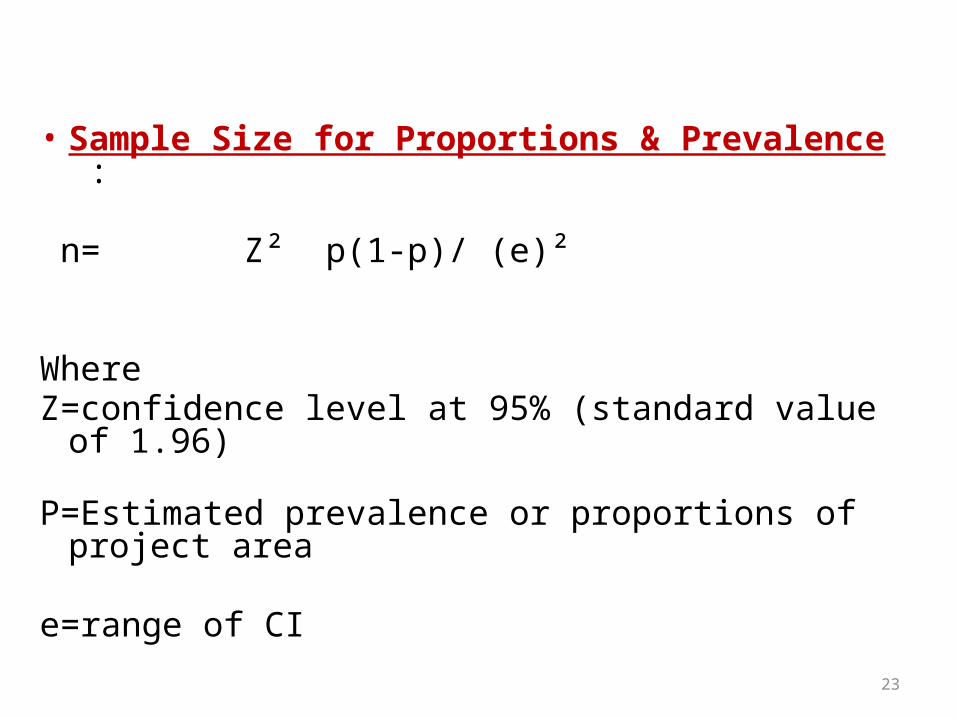
• Sample Size for Proportions & Prevalence :
n= Z² p(1-p)/ (e)²
WhereZ=confidence level at 95% (standard value of 1.96)
P=Estimated prevalence or proportions of project area
e=range of CI
24
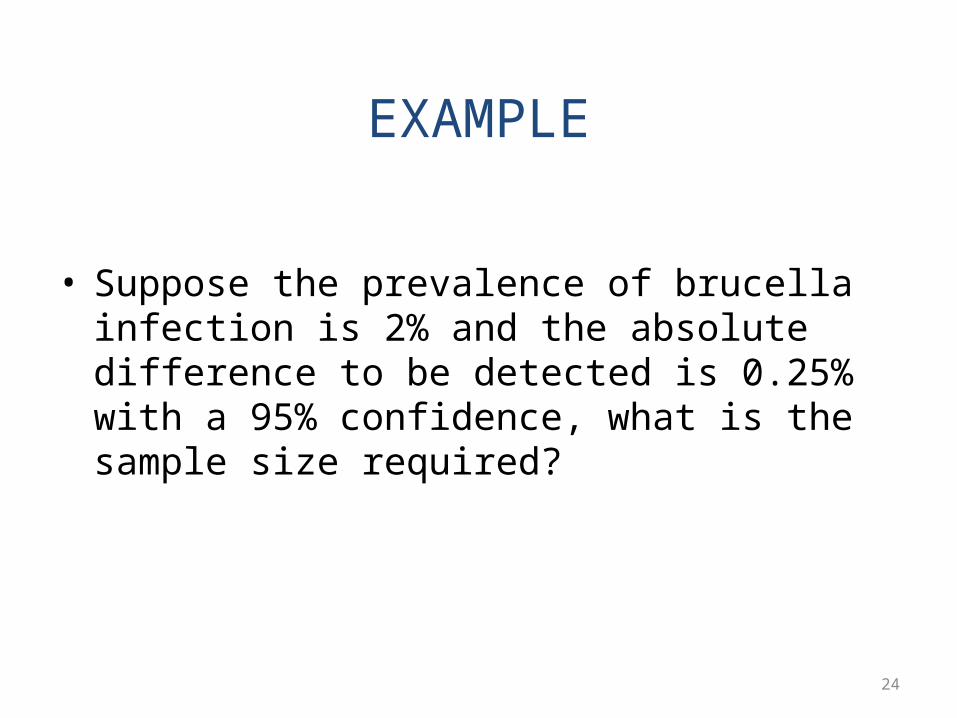
EXAMPLE
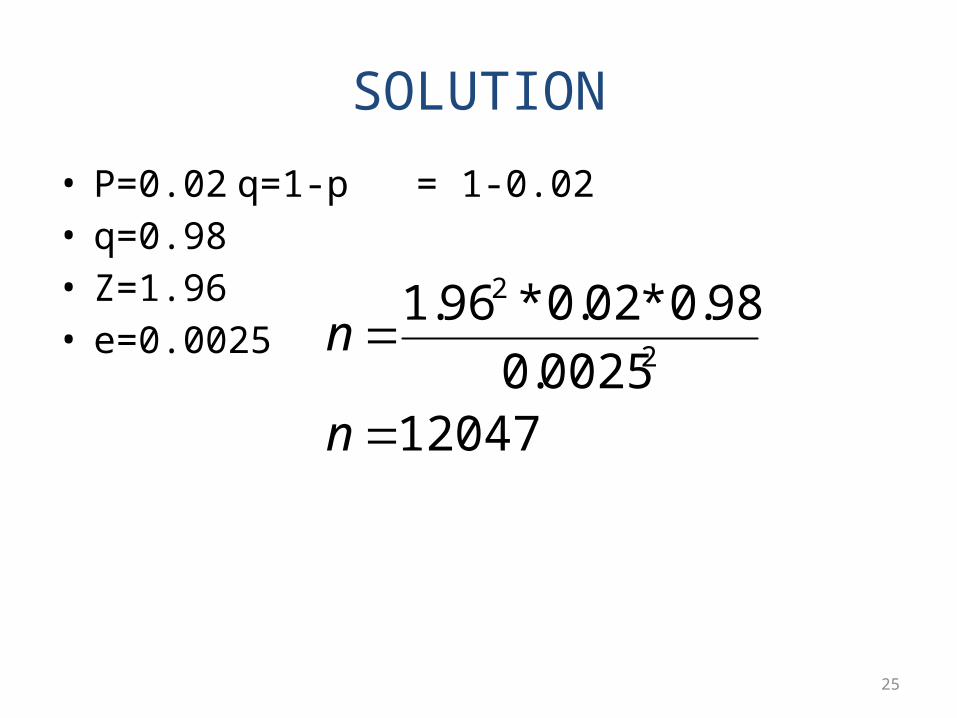
• Suppose the prevalence of brucella infection is 2% and the absolute difference to be detected is 0.25% with a 95% confidence, what is the sample size required?
25
SOLUTION
• P=0.02 q=1-p = 1-0.02• q=0.98• Z=1.96• e=0.0025
120470025.0
98.0*02.0*96.12
2
n
n
26
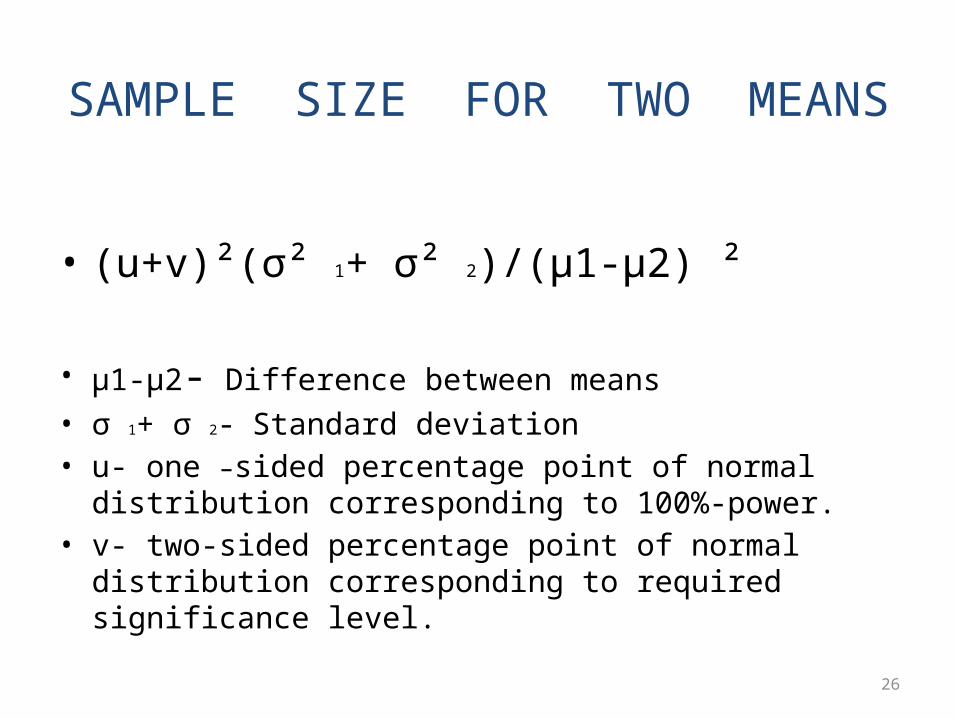
SAMPLE SIZE FOR TWO MEANS
• (u+v)²(σ² 1+ σ² 2)/(µ1-µ2) ²
• µ1-µ2- Difference between means• σ 1+ σ 2- Standard deviation• u- one –sided percentage point of normal distribution
corresponding to 100%-power.• v- two-sided percentage point of normal distribution
corresponding to required significance level.
27
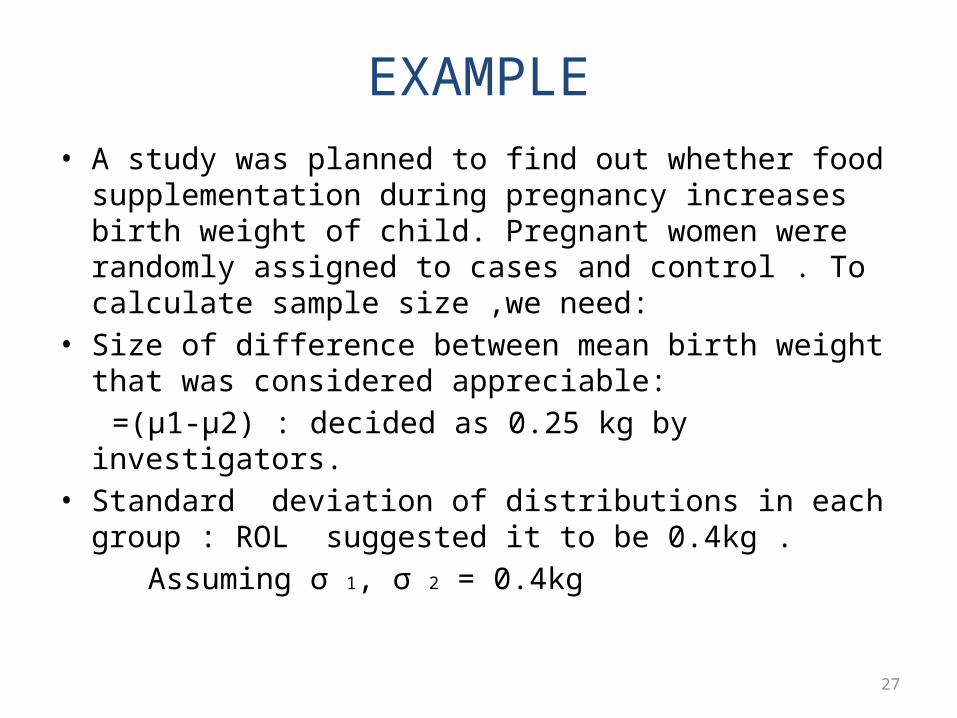
EXAMPLE• A study was planned to find out whether food
supplementation during pregnancy increases birth weight of child. Pregnant women were randomly assigned to cases and control . To calculate sample size ,we need:
• Size of difference between mean birth weight that was considered appreciable:
=(µ1-µ2) : decided as 0.25 kg by investigators.• Standard deviation of distributions in each group : ROL
suggested it to be 0.4kg . Assuming σ 1, σ 2 = 0.4kg
28
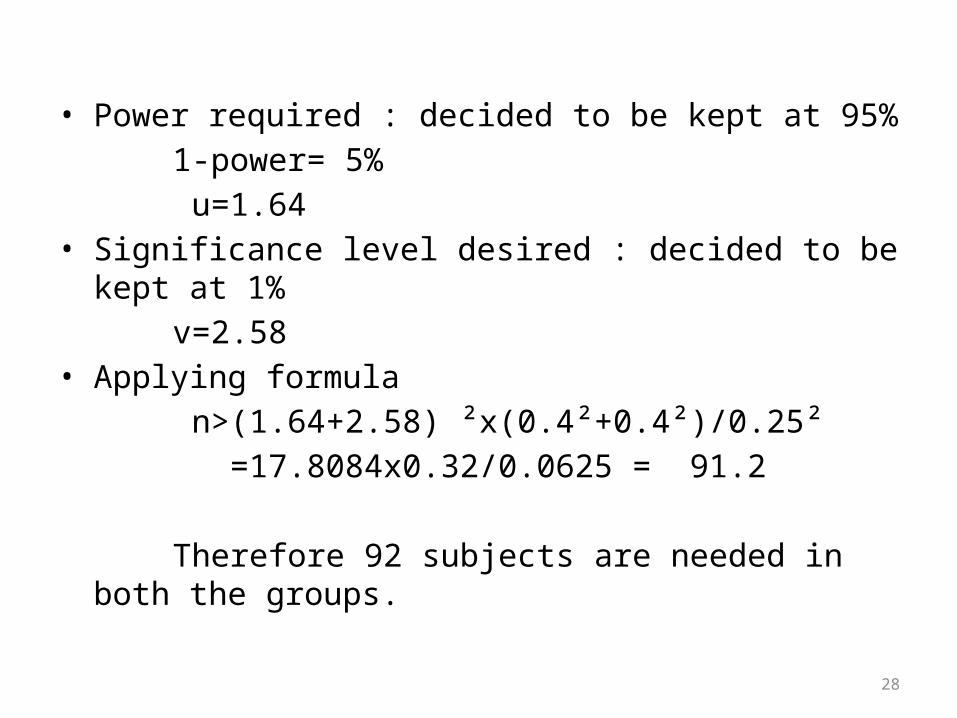
• Power required : decided to be kept at 95% 1-power= 5% u=1.64• Significance level desired : decided to be kept at 1% v=2.58• Applying formula n>(1.64+2.58) ²x(0.4²+0.4²)/0.25² =17.8084x0.32/0.0625 = 91.2
Therefore 92 subjects are needed in both the groups.
29
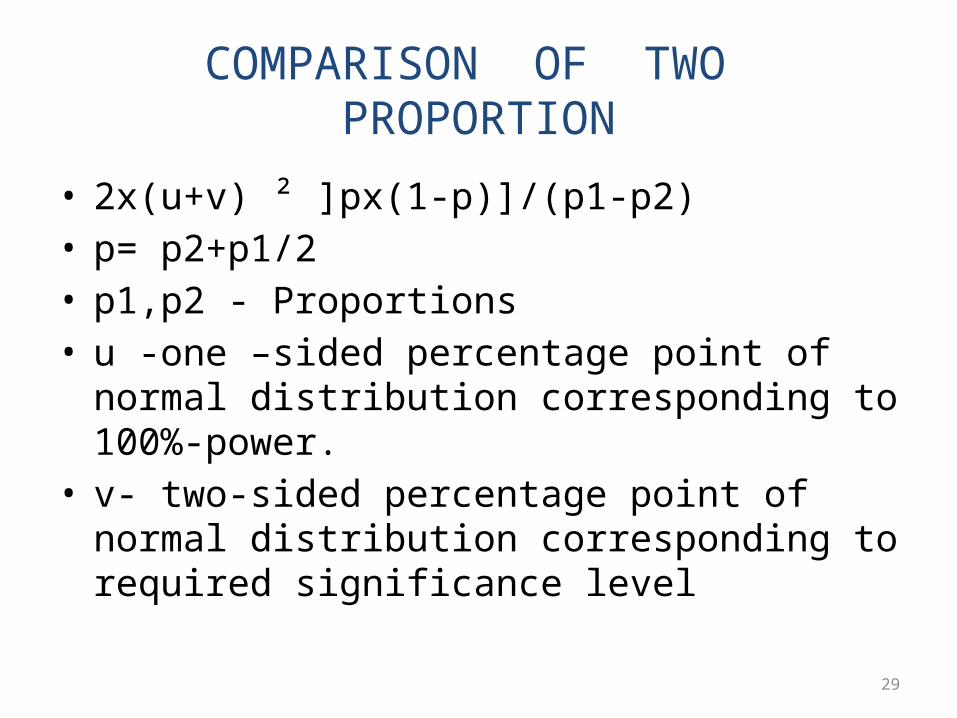
COMPARISON OF TWO PROPORTION
• 2x(u+v) ² ]px(1-p)]/(p1-p2)• p= p2+p1/2• p1,p2 - Proportions• u -one –sided percentage point of normal
distribution corresponding to 100%-power.• v- two-sided percentage point of normal distribution
corresponding to required significance level
30
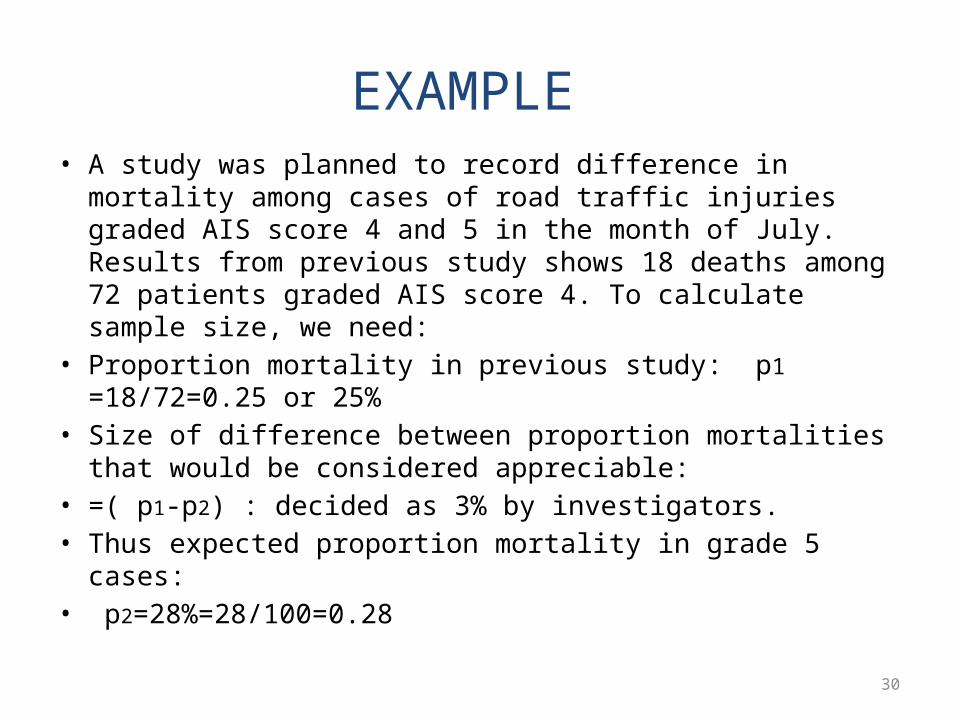
EXAMPLE • A study was planned to record difference in mortality among
cases of road traffic injuries graded AIS score 4 and 5 in the month of July. Results from previous study shows 18 deaths among 72 patients graded AIS score 4. To calculate sample size, we need:
• Proportion mortality in previous study: p1 =18/72=0.25 or 25%
• Size of difference between proportion mortalities that would be considered appreciable:
• =( p1-p2) : decided as 3% by investigators.• Thus expected proportion mortality in grade 5 cases:• p2=28%=28/100=0.28
31
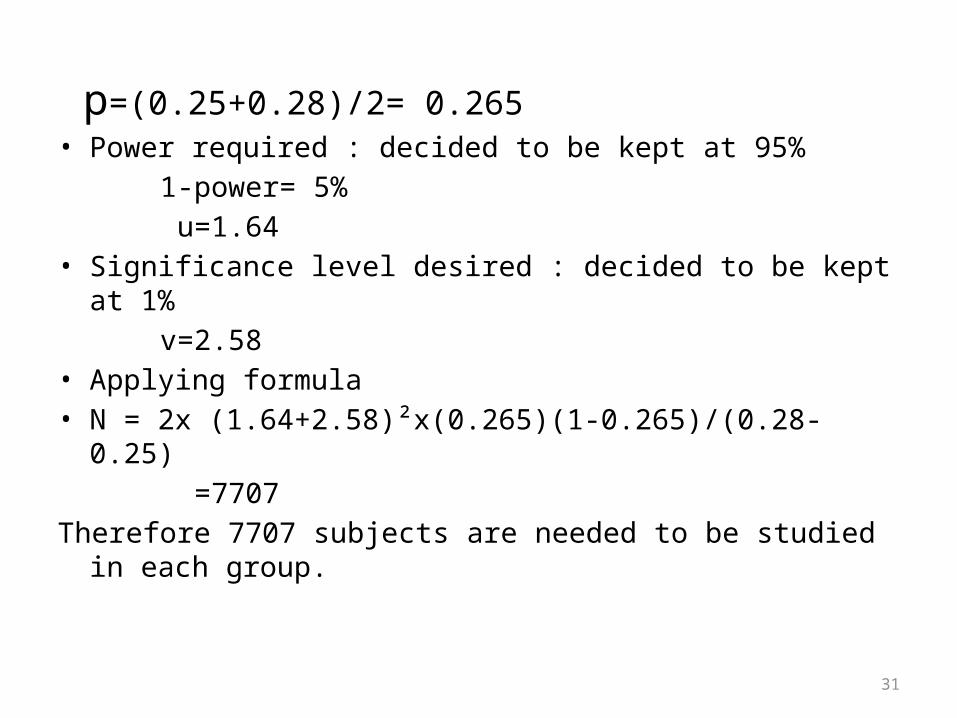
p=(0.25+0.28)/2= 0.265• Power required : decided to be kept at 95% 1-power= 5% u=1.64• Significance level desired : decided to be kept at 1% v=2.58• Applying formula• N = 2x (1.64+2.58)²x(0.265)(1-0.265)/(0.28-0.25) =7707 Therefore 7707 subjects are needed to be studied in each group.

32
FORMULAE USED WITH RATE
• Estimation of single rate µ v²/d² µ - Rate d – Range of CI v - two-sided percentage point of normal distribution corresponding to
required significance level.
• Comparison of two rates (u+v) ² (µ1+µo) / (µ1-µo) ² µ1,µo - Rates u - one –sided percentage point of normal distribution corresponding
to 100%-power. v - - two-sided percentage point of normal distribution corresponding
to required significance level
33
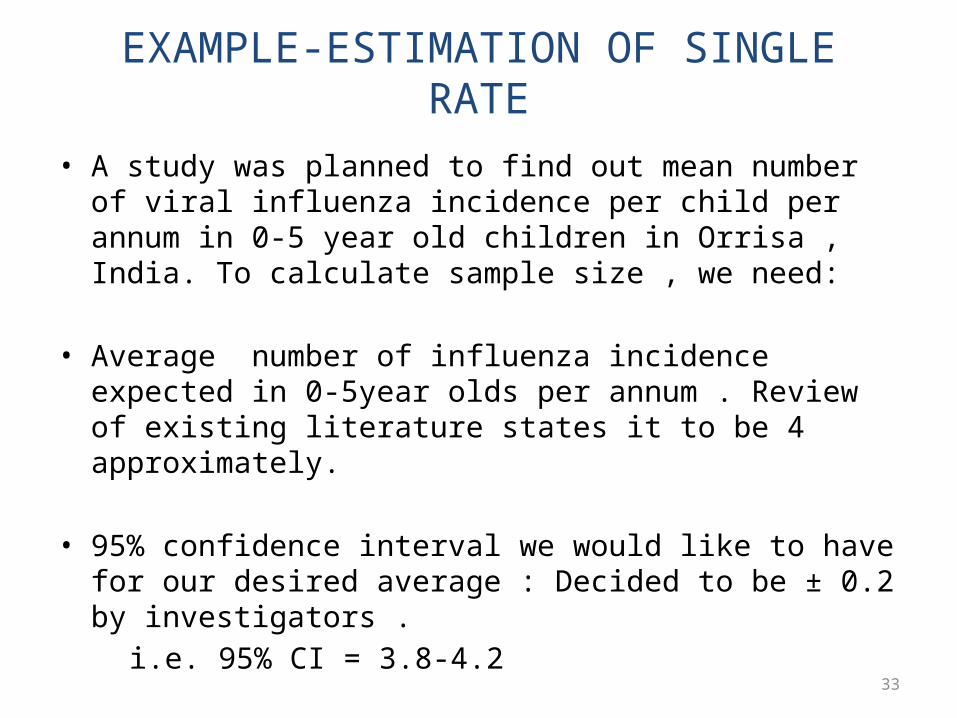
EXAMPLE-ESTIMATION OF SINGLE RATE
• A study was planned to find out mean number of viral influenza incidence per child per annum in 0-5 year old children in Orrisa , India. To calculate sample size , we need:
• Average number of influenza incidence expected in 0-5year olds per annum . Review of existing literature states it to be 4 approximately.
• 95% confidence interval we would like to have for our desired average : Decided to be ± 0.2 by investigators .
i.e. 95% CI = 3.8-4.2
34
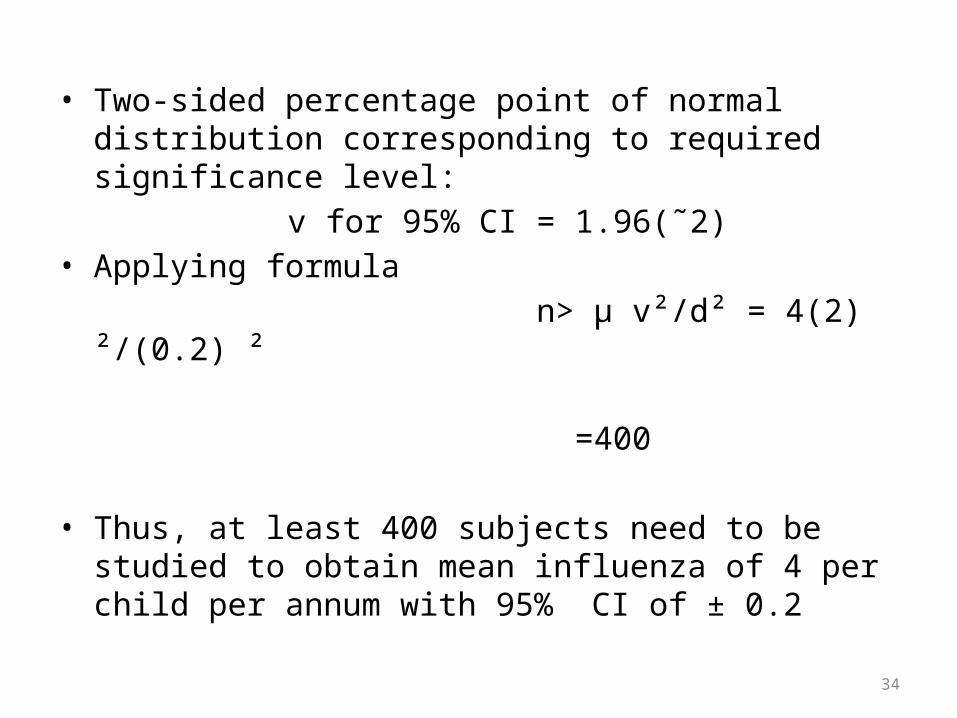
• Two-sided percentage point of normal distribution corresponding to required significance level:
v for 95% CI = 1.96(˜2)• Applying formula n> µ v²/d² = 4(2) ²/(0.2) ² =400
• Thus, at least 400 subjects need to be studied to obtain mean influenza of 4 per child per annum with 95% CI of ± 0.2
35
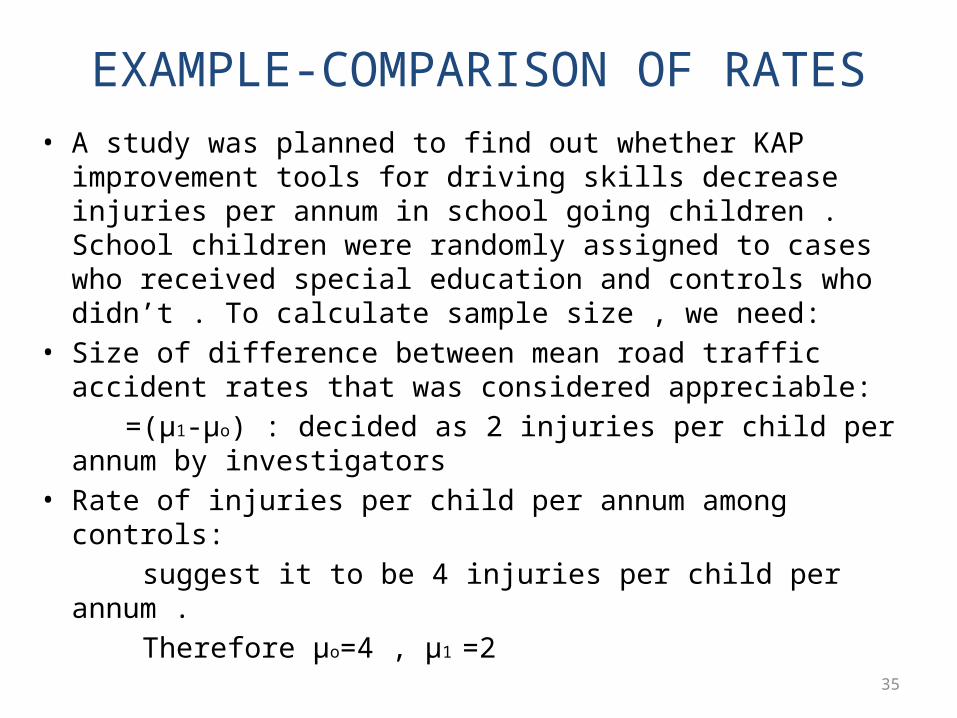
EXAMPLE-COMPARISON OF RATES• A study was planned to find out whether KAP improvement tools
for driving skills decrease injuries per annum in school going children . School children were randomly assigned to cases who received special education and controls who didn’t . To calculate sample size , we need:
• Size of difference between mean road traffic accident rates that was considered appreciable:
=(µ1-µo) : decided as 2 injuries per child per annum by investigators
• Rate of injuries per child per annum among controls: suggest it to be 4 injuries per child per annum . Therefore µo=4 , µ1 =2
36
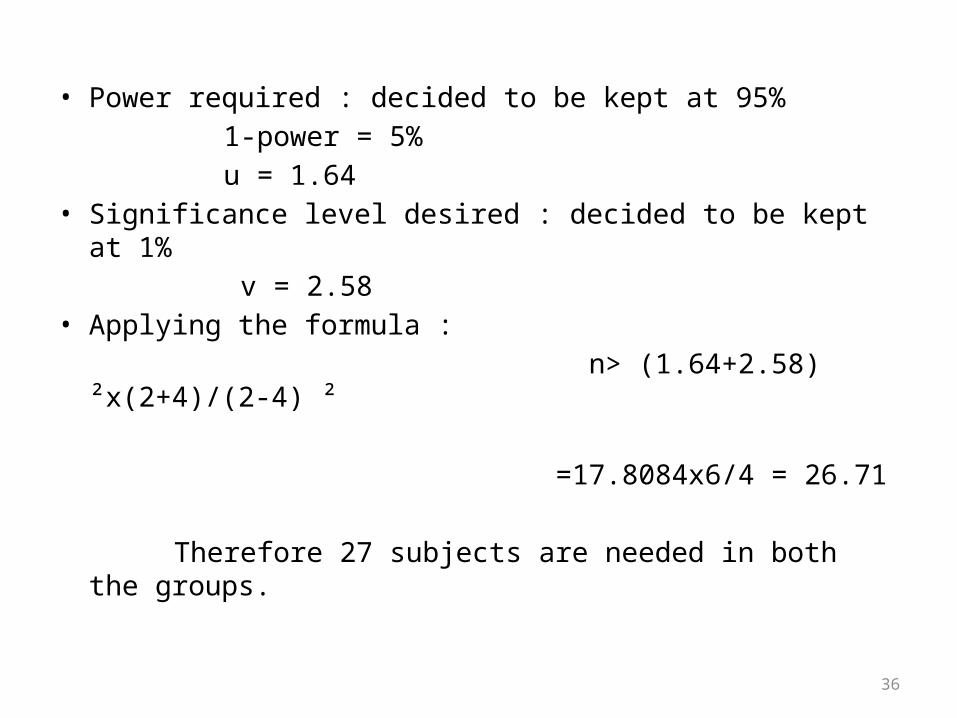
• Power required : decided to be kept at 95% 1-power = 5% u = 1.64• Significance level desired : decided to be kept at 1% v = 2.58• Applying the formula : n> (1.64+2.58) ²x(2+4)/(2-4) ²
=17.8084x6/4 = 26.71
Therefore 27 subjects are needed in both the groups.
37
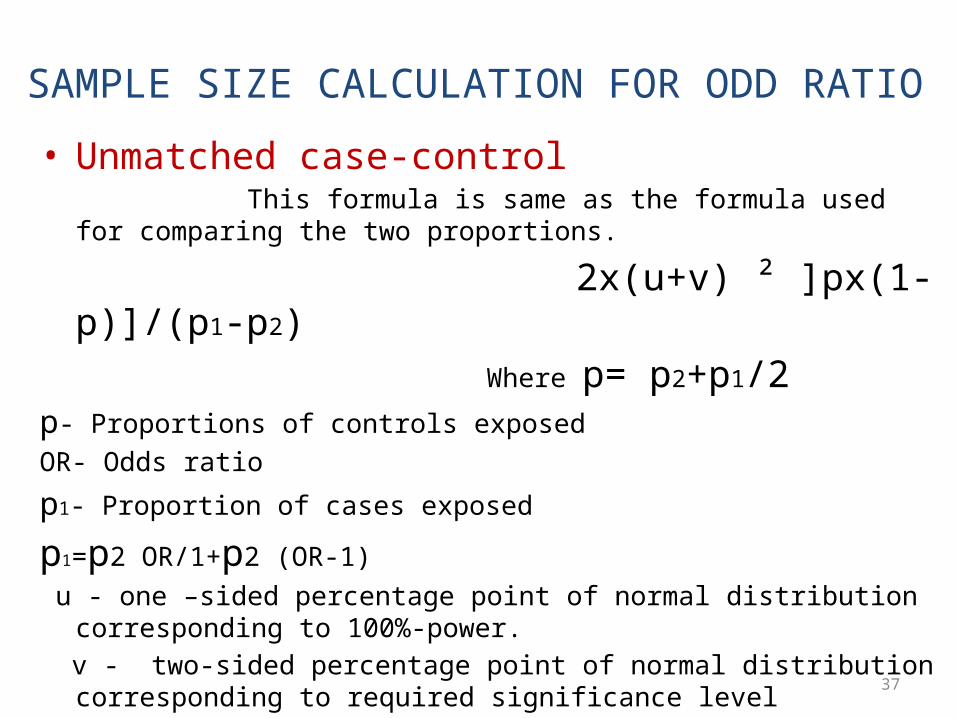
SAMPLE SIZE CALCULATION FOR ODD RATIO• Unmatched case-control This formula is same as the formula used for comparing the two
proportions.
2x(u+v) ² ]px(1-p)]/(p1-p2) Where p= p2+p1/2p- Proportions of controls exposedOR- Odds ratio
p1- Proportion of cases exposed
p1=p2 OR/1+p2 (OR-1) u - one –sided percentage point of normal distribution corresponding to 100%-
power. v - two-sided percentage point of normal distribution corresponding to required
significance level
38
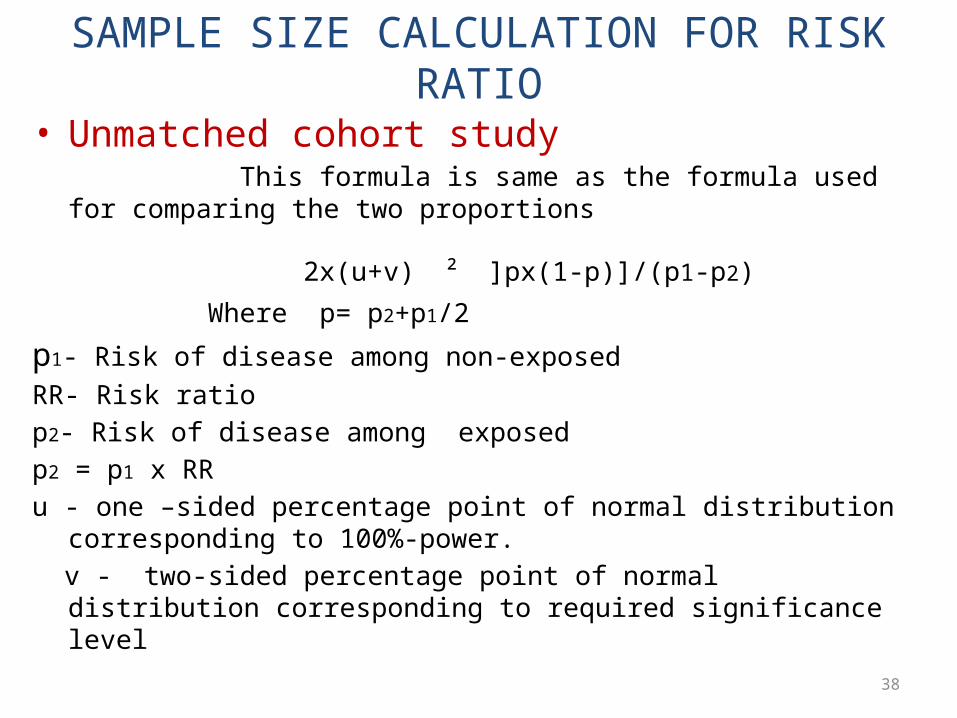
SAMPLE SIZE CALCULATION FOR RISK RATIO• Unmatched cohort study This formula is same as the formula used for comparing the two
proportions
2x(u+v) ² ]px(1-p)]/(p1-p2) Where p= p2+p1/2
p1- Risk of disease among non-exposedRR- Risk ratiop2- Risk of disease among exposed p2 = p1 x RRu - one –sided percentage point of normal distribution corresponding to 100%-
power. v - two-sided percentage point of normal distribution corresponding to required
significance level
39
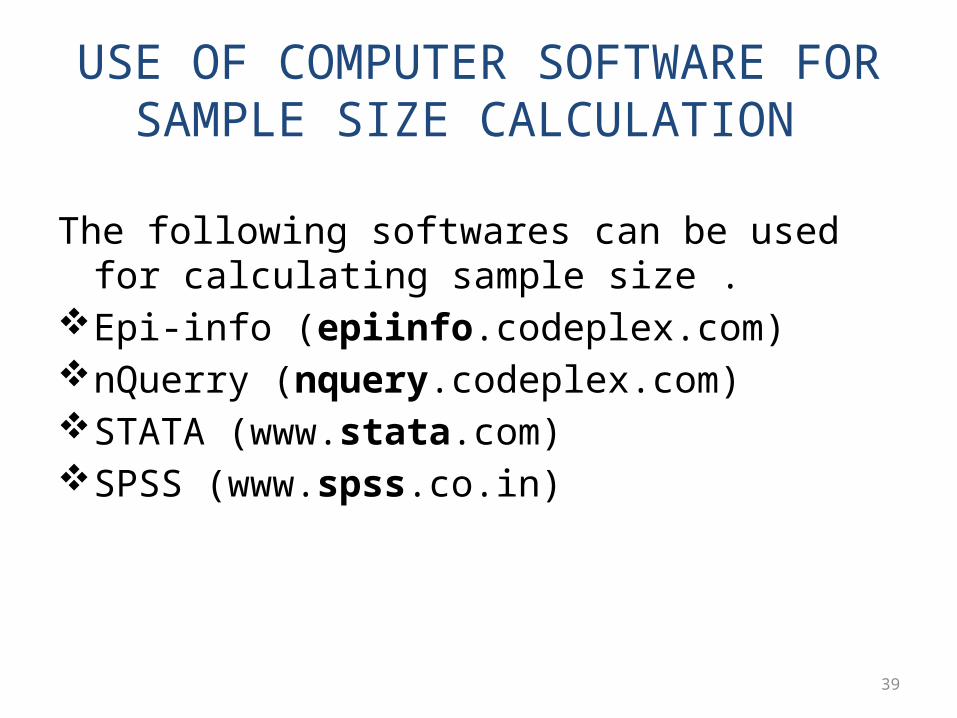
USE OF COMPUTER SOFTWARE FOR SAMPLE SIZE CALCULATION
The following softwares can be used for calculating sample size .
Epi-info (epiinfo.codeplex.com)nQuerry (nquery.codeplex.com)STATA (www.stata.com)SPSS (www.spss.co.in)
40
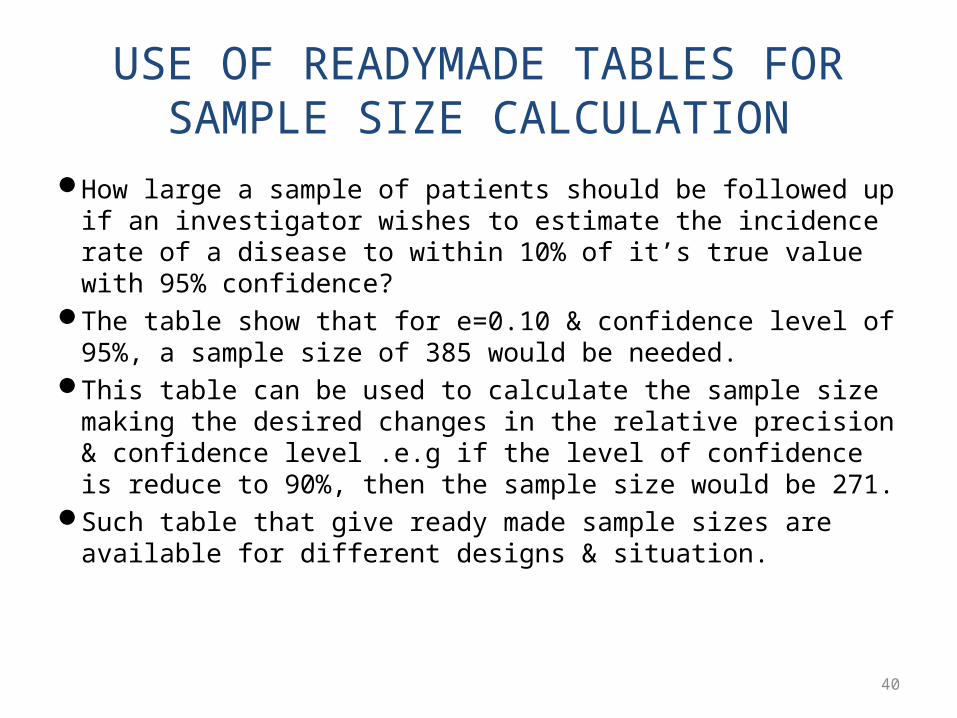
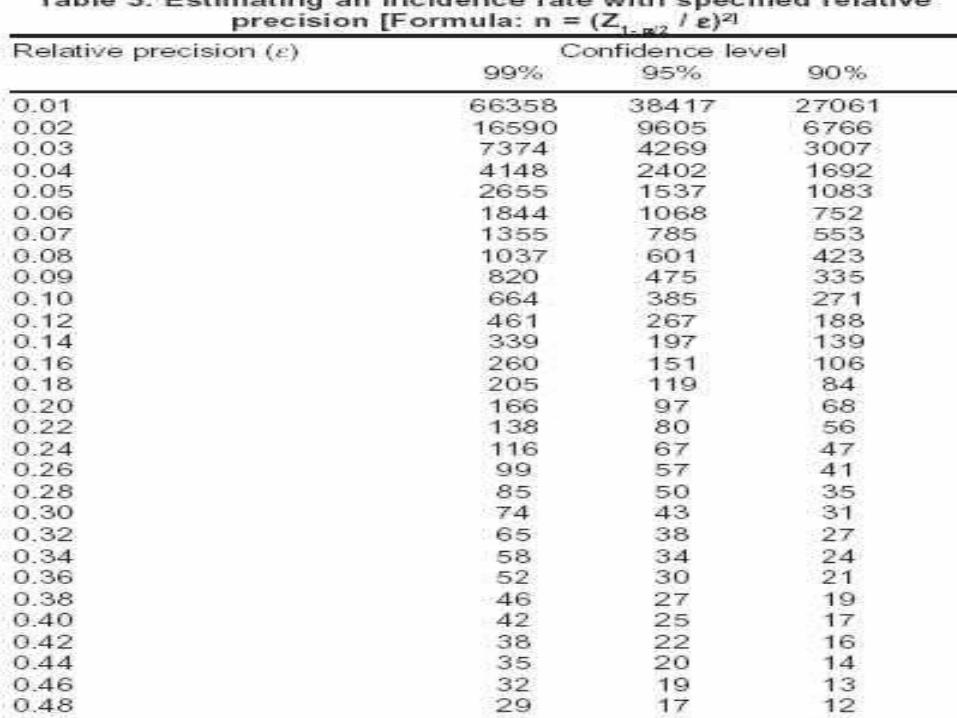
USE OF READYMADE TABLES FOR SAMPLE SIZE CALCULATION
How large a sample of patients should be followed up if an investigator wishes to estimate the incidence rate of a disease to within 10% of it’s true value with 95% confidence?
The table show that for e=0.10 & confidence level of 95%, a sample size of 385 would be needed.
This table can be used to calculate the sample size making the desired changes in the relative precision & confidence level .e.g if the level of confidence is reduce to 90%, then the sample size would be 271.
Such table that give ready made sample sizes are available for different designs & situation.
41
42
CONCLUSIONS
• Sample size determination is one of the most essential components of every research Study.
• The larger the sample size, the higher will be the degree of accuracy, but this is limited by the availability of resources.
• It can be determined using formulae, readymade tables and computer softwares.

43