Embed Size (px)
Citation preview
DBA Level 400

About me
An independent SQL Consultant
A user of SQL Server from version 2000 onwards with 12+ years experience.
I have a passion for understanding how the database engine worksat a deep level.
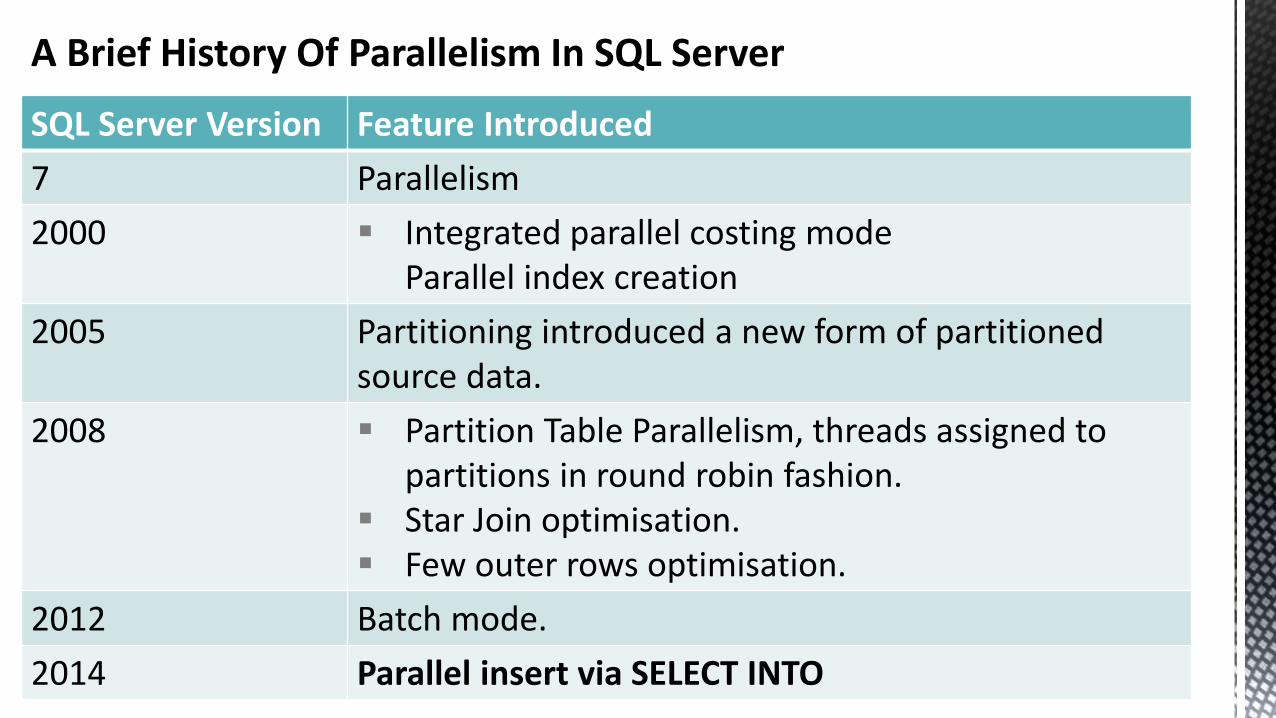
A Brief History Of Parallelism In SQL Server
SQL Server Version Feature Introduced
7 Parallelism
2000 Integrated parallel costing modeParallel index creation
2005 Partitioning introduced a new form of partitioned source data.
2008 Partition Table Parallelism, threads assigned to partitions in round robin fashion.
Star Join optimisation. Few outer rows optimisation.
2012 Batch mode.
2014 Parallel insert via SELECT INTO

The Aim, To Push The Test Hardware To Its Limits
ioDrive2 DUO 2.4 Tb
32 Gb triple channel 1600 MHz DDR3
SanDisk Extreme Pro 480Gb x 2
CPU2 x 6 core 2.4 Ghz
(Westmere)

Pushing The Parallel Insert To Its Limits, Two Parts
1 st part, optimise scan of source table

Obtaining An ETW Trace Stack Walking The Database Engine
xperf –on base –stackwalk profile
xperf –d stackwalk.etl
WPASQL Statement

Demonstration #1Analysing IO Performance
With Windows Performance Tool Kit

Basic Heap Scan IO Throughput and CPU Utilisation
Elapsed time 80 seconds

Where Is The Bottleneck ?

Optimising Serial Scan Performance: Hash Partition Source Table
Each heap object has a single parallel page supplier, it acts like a card dealer.
When multiple child threads need to access a single “Card dealer”, this has to be serialised.
Tuning 101: If there is contention for a resource, create more of it.

Scan Of Hash Partitioned Heap ( 24 Partitions )
Elapsed time 104 seconds PERFORMANCE HAS GONE BACKWARDS !!!!

Scan Of Hash Partitioned Heap, Where Is The CPU Time Going ?
Why is COUNT
interested in values ?

Scan Of Hash Partitioned Heap With NOT NULL Constraints
Elapsed time 56s, IO throughput up by 1 ~ 1.5Gb/s, CPU consumption down !

The Old World Of Optimising Spinning Disk IO Throughput
Encourage aggressive read ahead behaviour.
Minimise internal and external fragmentation.
Use compression to bridge gap between CPU and storage performance.
Achieve balanced hardware configurationsfrom spinning disk to CPU core.

What IO Sizes Are We Getting At Present ?
IO Drive => mostly 64K SanDisk SSD => 64 ~ 512K

Which Striping Scheme Delivers The Best IO Throughput ?
All partitions striped access 7 files on the ioDrive to every file on the SSD
Each partition heap object stored in its own file group

Does The New ‘Striping’ Scheme Make Much Difference ?
26 seconds down from 56 seconds !!!

Have The IO Sizes Changed ?
more 512K reads on the SanDisk SSD

“Comparative Analysis” of SSD Driver Stack Vs Fusion IO Virtual Storage Layer

Putting Everything Together, How Well Does The Parallel Insert Scale ?
2 4 6 8 10 12 14 16 18 20 22 24
Elapsed Time (ms) 975072 636360 410178 335997 276996 279277 272656 268998 224117 230745 262889 253508
CPU (ms) 1829999 2338689 2263438 2381466 2422876 2665219 2616095 2734046 2891687 3012737 2928376 3020966
0
500000
1000000
1500000
2000000
2500000
3000000
3500000
0
200000
400000
600000
800000
1000000
1200000
CP
U T
ime
(ms)
Elap
sed
tim
e (m
s)
Degree of Parallelism
Elapsed and CPU time / DOP
Elapsed Time (ms) CPU (ms)
Would forcing the write IO size help improve
performance ?

Using The E Startup Flag To Force 64 Extent Allocations At A Time
2 4 6 8 10 12 14 16 18 20 22 24
Elapsed Time (ms) 959284 624421 486307 340109 274852 281446 269782 269906 235444 225184 223902 248712
CPU (ms) 1758547 2298236 2544436 2300767 2413845 2644450 2589904 2955548 2905218 2969639 3177187 3048611
0
500000
1000000
1500000
2000000
2500000
3000000
3500000
0
200000
400000
600000
800000
1000000
1200000
CP
U T
ime
(ms)
Elap
sed
tim
e (m
s)
Degree of Parallelism
Elapsed and CPU time / DOP
Elapsed Time (ms) CPU (ms)
Wait Type Pct
SOS_SCHEDULER_YIELD 43
PAGEIOLATCH_SH 38
LATCH_EX 19

Should We Be Worried About The Spin lock Activity ?
240,000,000CPU cycles per
second
x 18 = 967,680,000,000 CPU cycles141,328,383 spins for X_PACKET_LIST
224 seconds x
Spins we are seeing are a drop in the ocean compared to expended CPU cycles
answer is NO!

Should We Be Worried About The Spin lock Activity ?
With a DOP of 18 and hyper threadingBest case scenario is for 9 cores to be used:
9 ( physical cores )x 2400,000,000 ( CPU cycles in 1 second )x 224 ( duration of the insert )
= 4,838,400,000,000 CPU cycles141,328,383 X_PACKET_LIST spins
Hyper-thread
Hyper-thread
Hyper-thread
Hyper-thread
Hyper-thread
Hyper-thread
Hyper-thread
Hyper-thread
Hyper-thread
Hyper-thread
Hyper-thread
Hyper-thread
Hyper-thread
Hyper-thread
Hyper-thread
Hyper-thread
Hyper-thread
Hyper-thread
Hyper-thread
Hyper-thread
Hyper-thread
Hyper-thread
Hyper-thread
Hyper-thread
NUMA node 0
NUMA node 1
CPU cycles 4 orders of magnitude greater than
X_PACKET_LIST spinsanswer is NO!

E Start-up Flag Experiment Has Sent Performance Backwards !!!
Baseline result with 48 files in destination file group: 224117 ms elapsed time at DOP 18
With the E flag the best result is: 223902 ms elapsed time at DOP 22
What happens if we add more files to the destination file group ? . . .

Test Results With 96 Destination File Group Files And The E Flag
2 4 6 8 10 12 14 16 18 20 22 24
Elapsed Time (ms) 1072405 493269 476260 397712 278963 278660 224413 267579 272631 259809 266381 258877
CPU (ms) 1834812 1887734 2577092 2669795 2384484 2866142 2527358 2810190 2943342 2783533 3126454 3006719
0
500000
1000000
1500000
2000000
2500000
3000000
3500000
0
200000
400000
600000
800000
1000000
1200000
CP
U T
ime
(ms)
Elap
sed
tim
e (m
s)
Degree of Parallelism
Elapsed and CPU time / DOP
Elapsed Time (ms) CPU (ms)
Wait Type Pct
SOS_SCHEDULER_YIELD 57
LATCH_EX 25
PAGEIOLATCH_SH 9
PAGEIOLATCH_UP 5
ASYNCH_NETWORK_IO 4

What Is The NESTING_TRANSACTION_FULL Latch ?
Controls access to the transaction description structures (XDES).
XDES is part of the run time ( sqlmin.dll ) and used to generate
transaction logging information before it is copied to the log buffer.
_FULL is for active transactions.
A parallel query must start a sub-transaction for each thread, these
transactions are sub-transactions of the parallel nested transaction.
This information comes from the SQL Skills blog.

The Problem With Wait Statistics
Easy to see what is happening in the suspended queue.
The runnable queue only gives us time accrued by SQL OS scheduler yields.
The view provided by conventional tools
Where we want greater insight

Layered Architecture Of The Database Engine From SQL 2012 Onwards
Language Processing – SQLLANG.dll
Database Engine Runtime
SQLMIN.dllStorage engine and execution engine
SQLTSES.dllSQL expression service
QDS.dllQuery data store (SQL 2014+)
SQL OS
SQLDK.dll SQLOS.dll

Demonstration #2Stack Walking
The Database Engine

Where Is Our CPU Time Going ?
Call Stack Weight
ntdll.dll!RtlUserThreadStart 3031180
.
.
SQL OS activity
.
.
sqlmin.dll!CQScanUpdateNew::GetRow 2833949
sqlmin.dll!CQScanTableScanNew::GetRow 1514872
sqlmin.dll!CXRowset::FetchNextRow 1469327
sqlmin.dll!RowsetNewSS::FetchNextRow 1453029
sqlmin.dll!DatasetSession::GetNextRowValuesNoLock 1400805
sqlmin.dll!HeapDataSetSession::GetNextRowValuesInternal 1360920
sqlmin.dll!DataAccessWrapper::StoreColumnValue 477217
sqlmin.dll!DataAccessWrapper::DecompressColumnValue 344113
sqlmin.dll!DataAccessWrapper::DecompressColumnValue<itself> 188263
sqltses.dll!UnicodeCompressor::Decompress 135764
sqlmin.dll!__security_check_cookie<itself> 19698
sqlmin.dll!DataAccessWrapper::StoreColumnValue<itself> 132838
sqltses.dll!CEsExec::GeneralEval 1166920
sqlmin.dll!CValRow::SetDataX 986270
sqlmin.dll!RowsetBulk::InsertRow 975735

What Does The Call Stack Tell Us ?
32% of the CPU time is consumed by the insert part of the statement.
There is a 4% CPU overhead when dealing with unicode.
With a 96 file destination file group and the E startup flag in use, inspecting column values still accounts for 46% of the total CPU time expended.

What Are We Waiting On ?*
*96 file is dest. File group and E flag in use
42 4 414
4 5
57 5
1043 3
4
5
3
7
4
9 9
57
6
2 3
5
5
15
18
25
4
33
5039
18
95 9488
75 77
65
57
89
58
3845
78
0
10
20
30
40
50
60
70
80
90
100
2 4 6 8 10 12 14 16 18 20 22 24
PER
CEN
TAG
E W
AIT
TIM
E
DOP
SOS_SCHEDULER_YIELD
LATCH_EX
PAGEIOLATCH_SH
PAGEIOLATCH_EX
PAGEIOLATCH_UP
WRITELOG
ASYNCH_NETWORK_IO

What Have We Learned: Scan Rates
A parallel heap scan is throttled by latching around access to the page range supplier: Solution: hash partition the table.
There is significant cost in “Cracking open” columns to inspect their values during a scan, 46% of CPU time approximately.
The practice of trying to get the best throughput by obtaining 512K reads applies to flash storage with traditional interfaces ( SATA / SAS ), but not so much ioDrives.

What Have We Learned: Parallel Insert
In the best case scenario, the parallel insert is scalable up to a DOP of 14.
IO related waits play a very minor part in overall wait time as the degree of parallelism is increased.
The destination file group has a “number of files sweet spot” which relates to latency spikes (flushes to disk) on its member files.
A combination of the destination file group file number sweet spot and the use of E start-up flag yields the lowest elapsed time at a DOP of 14.


http://uk.linkedin.com/in/wollatondba
ChrisAdkin8


![[CEFETMG][BD] Aula 3 - SQL Create-Drop-Insert-Update-Delete-Alter](https://img.pdfslide.net/doc/110x75/55b3c855bb61ebc0548b46c6/cefetmgbd-aula-3-sql-create-drop-insert-update-delete-alter.jpg)