Embed Size (px)
Citation preview
re-envisioningSONOCO
Product Portfolio AnalysisAnd
Financial Performance 2013

Product Offerings
Consumer Packaging
Display & Packaging
Protective Solutions
Paper & Industrial
Converted
Printed Flexible
Packaging
Paper
Plastic
Plastic Metal
Plastic Glass Metal
Plastic Metal
Thin-gauge High value-
added rotogravure
Flexographic Combination
Printed FilmConsu
mer Pack
aging
Display a
nd Packaging
Paper and In
dustrial C
onverte
d
Protecti
ve So
lution
Tigrant
1894
524
1859
572 469
Sales by Segment (2013)
Consumer PackagingDisplay and PackagingPaper and Industrial ConvertedProtective SolutionTigrant
millions of Dollars
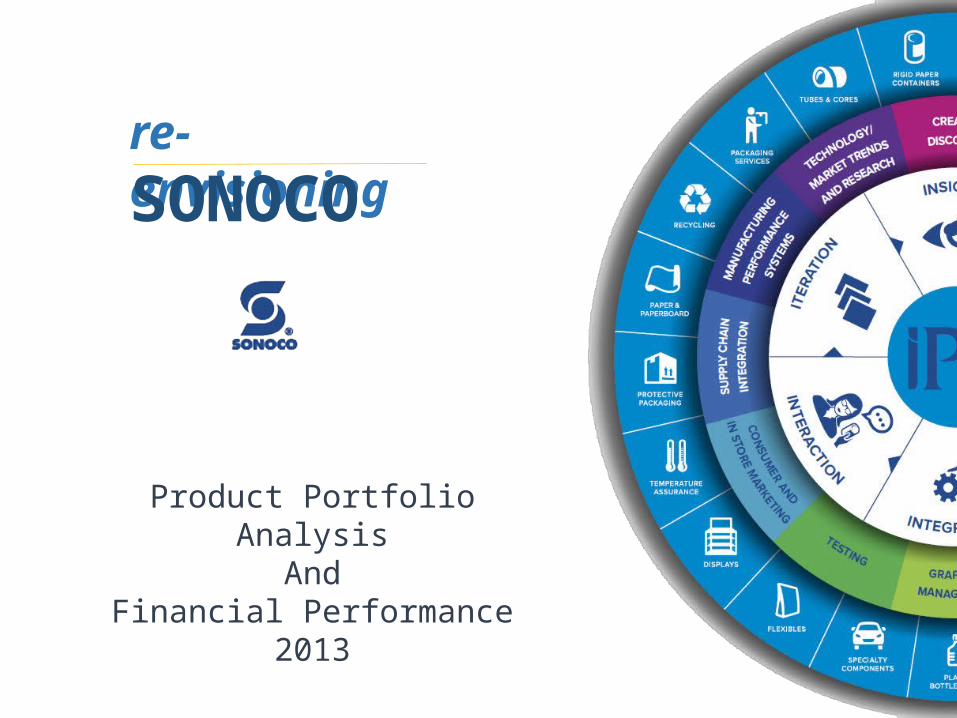
Portfolio Analysis
Consumer Packaging: Strong business unit in attractive industry
Display and Packaging: Weak business unit in average attractive industry
Paper and Industrial Converted: Strong Business unit in comparatively high business industry
Protective Solution: Weak Business in average attractive industry
Tigrant: Weak Business in unattractive industry
High
Medium
LowMediumHigh
Low
Indu
stry
Att
racti
vene
ss
Competitive Strength of Product Segment
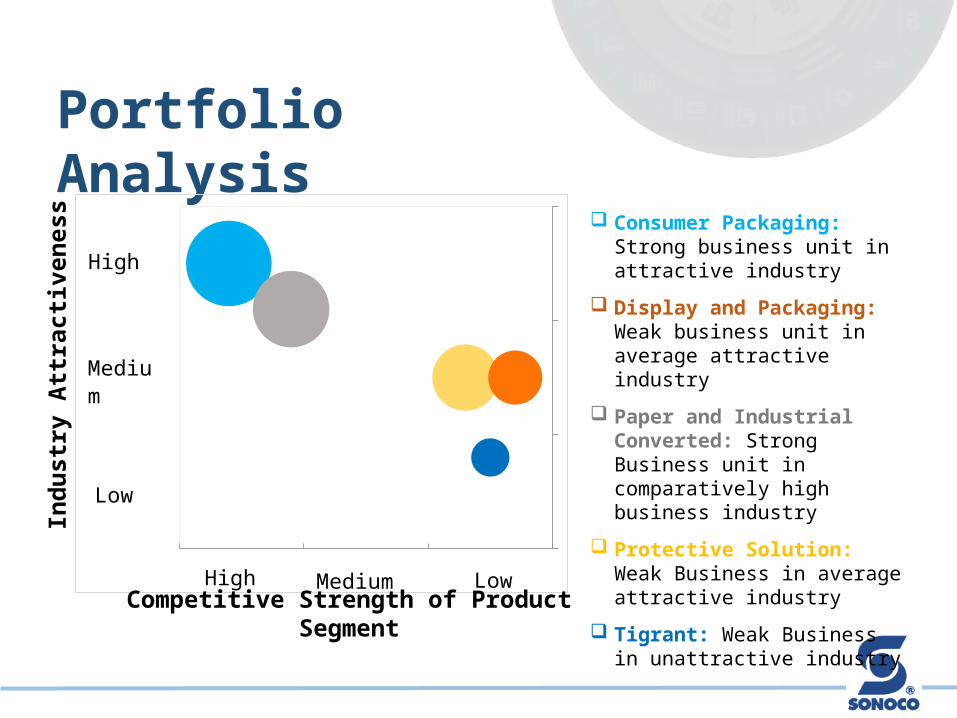
Financial Performance
2013 201286.06%
86.08%
86.10%
86.12%
86.14%
86.16%
86.18%
86.20%
86.22%
86.24%
86.21%
86.12%
Return on Sales
SG &A
Re st r u c t u r i ng / A sse t i m
p a i rm
e n t ch ar ge s
I nc o m
e be fo
r e i nt e r e s t a
n d i nc o m
e t ax e s
$48
7,17
1
$25
,038
$36
1,29
5
$46
3,71
5
$32
,858
$34
7,05
9
Operati ng Margin2013 2012
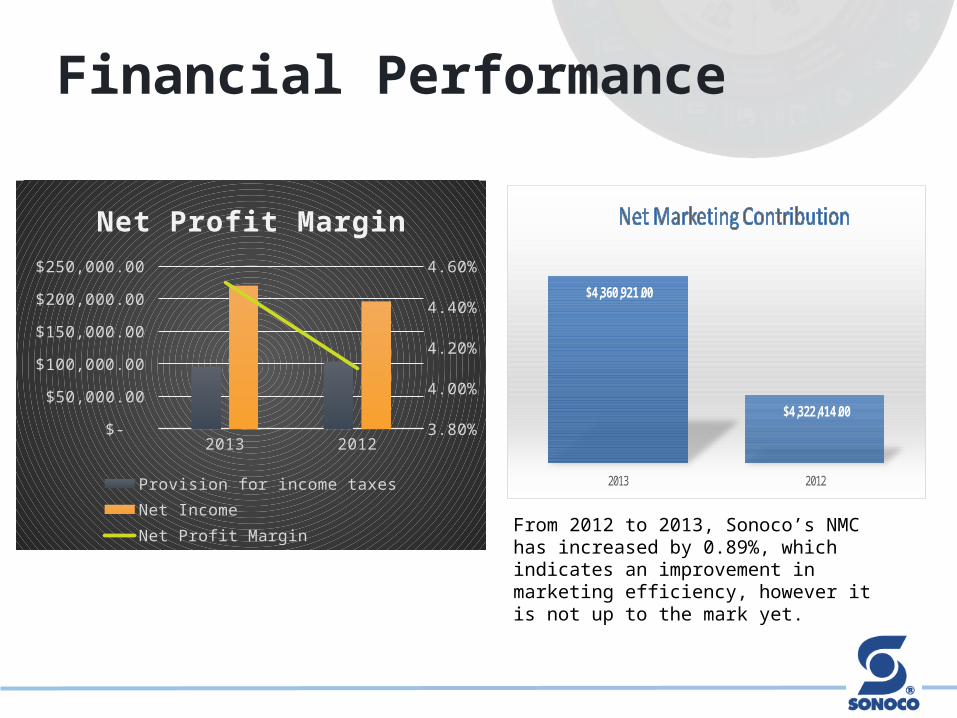
Financial Performance
From 2012 to 2013, Sonoco’s NMC has increased by 0.89%, which indicates an improvement in marketing efficiency, however it is not up to the mark yet.
2013 2012 $-
$50,000.00
$100,000.00
$150,000.00
$200,000.00
$250,000.00
3.80%
3.90%
4.00%
4.10%
4.20%
4.30%
4.40%
4.50%
4.60%
Net Profit Margin
Provision for income taxes Net IncomeNet Profit Margin
$4,360,921.00
$4,322,414.00
2013 2012
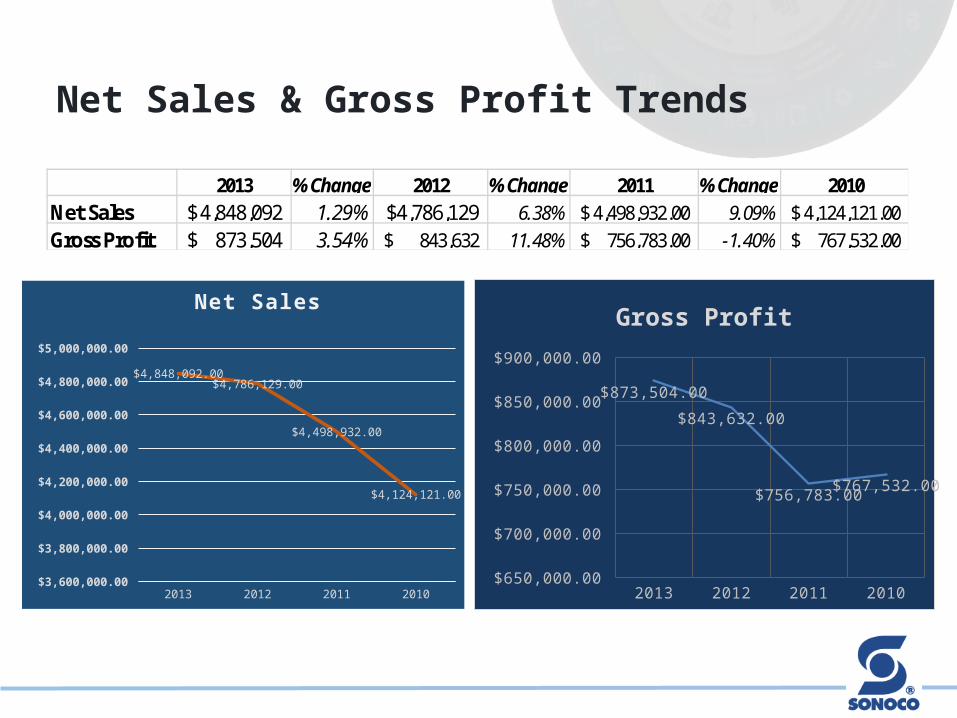
Net Sales & Gross Profit Trends
2013 2012 2011 2010 $3,600,000.00
$3,800,000.00
$4,000,000.00
$4,200,000.00
$4,400,000.00
$4,600,000.00
$4,800,000.00
$5,000,000.00
$4,848,092.00 $4,786,129.00
$4,498,932.00
$4,124,121.00
Net Sales
2013 % Change 2012 % Change 2011 % Change 2010Net Sales 4,848,092$ 1.29% 4,786,129$ 6.38% 4,498,932.00$ 9.09% 4,124,121.00$ Gross Profit 873,504$ 3.54% 843,632$ 11.48% 756,783.00$ -1.40% 767,532.00$
2013 2012 2011 2010 $650,000.00
$700,000.00
$750,000.00
$800,000.00
$850,000.00
$900,000.00
$873,504.00
$843,632.00
$756,783.00 $767,532.00
Gross Profit

Thank You


![[PPT]RESPONSIBILITY ACCOUNTING, FINANCIAL ... · Web viewRESPONSIBILITY ACCOUNTING, FINANCIAL PERFORMANCE MEASURES AND TRANSFER PRICE Product-sustaining activity costs. Biaya ini berhubungan](https://img.pdfslide.net/doc/110x75/5aad85157f8b9a693f8e80b1/pptresponsibility-accounting-financial-viewresponsibility-accounting-financial.jpg)