Embed Size (px)
Citation preview

A News Drivers Report from GBM Live! NewsroomLeveraging surveys as a Public Relations tool using research and survey reports to gain effective media traction—
SURVEYS TO KNOW,
RESEARCH & MEASUREMENT
TO SHOWSURVEYS

highlighting the huge potential offered by research and survey reports in generating newsworthy stories in the print media.
2013, THE INDIAN PRINT MEDIA PUBLISHED
1,750 STORIES based on survey reports commissioned
BY 258 COMPANIES IN INDIA.
2014,
the numbers increased to
BY 261 COMPANIES IN INDIA,
Disclaimer: This study has been compiled based on an analysis of two years of published survey reports (2013 and 2014) across mainline print publications in
India. The media universe scanned includes 14 English publications—The Economic Times, Business Standard, The Hindu Business Line, Mint, The Financial
Express, The Times of India, Hindustan Times, DNA, The Indian Express, The Hindu, BW Businessworld, Business Today, Business India, and Forbes, across the
Delhi, Mumbai, Bengaluru, Chennai, Hyderabad, Kolkata, and National editions. For more information, refer to the Research Methodology annexure.
421* COMPANIES HAVE LEVERAGED SURVEYS FOR
GENERATING NEWS
2,004 STORIES based on survey reports commissioned
1Surveys to Know, Surveys to Show | A News Drivers Report from GBM Live! Newsroom
*421 companies are the unique cos who have taken out surveys across 2 years.
The use of surveys or research reports as a public
relations tool can be traced back to the times of
Edward Bernays as far back as 1923 when he
effectively used a survey to showcase the
preference of the American public for a
particular type of soap in a well-documented
case study of successful public relations. Over 90
years on, the PR industry continues to use surveys
and research reports and we thought it would be
interesting to get a sense of how receptive the
media in India are to using the results of surveys
in their reportage.
Surveys are conducted by organisations to either
gather insights or to drive a point of view. The
former are what we refer to as "Surveys to Know”
and are normally a source of competitive
advantage. And hence the ndings of such
research are kept private. The latter, “Surveys to
Show” are often used very effectively by PR
practitioners to build thought leadership on a
subject for a company or brand.
Research and survey findings
continue to be a good source
of reference information for
media. From the early days
of Public Relations, when
Edward Bernays championed
the use of surveys as a PR
tool to effectively convey a
point of view, till today, much
has changed in the media
world, but what has not is
the simple fact that relevant
and resonant content will
always shine through.
Preface
2Surveys to Know, Surveys to Show | A News Drivers Report from GBM Live! Newsroom
We nd survey reports to be very important and newsworthy, especially if they are reective of
trends. Even otherwise, we often quote them in our industry stories. I also prefer survey reports
to press releases and announcements, and at times craft stories entirely based on survey
ndings. PTI publishes stories based on research surveys often, almost 2–3 times a week.
– Special Correspondent, Press Trust of India
“ “
In this rst-of-its-kind report from GBM Live!
Newsroom, in association with Impact Research
& Measurement, we explore the developments
and the opportunities research and survey
reports bring to the fore as an effective PR tool
for garnering media traction.

Key Findings and InferencesIn our study, when we considered the prominent
coverage garnered by named surveys in 2013 and
2014, on an average there were seven prominent
articles elicited by a named survey in 2013, and
three prominent articles elicited by a named survey
in 2014. Survey reports and their key ndings have a
long shelf-life, unlike one-time consumables such as
press releases. With multiple ndings, there are
many stories that can be written around a survey's
ndings in a distinct fashion, leading to long-term
media mileage through continued utilisation of the
survey's ndings.
Here are some of the key findings from our
study and how you can turn them to your
advantage.
1. Learn from the Consulting Big FourConsulting rms, given their nature of work, thrive
on research and surveys. Just the Big
Four—PricewaterhouseCoopers, KPMG, Ernst &
Young and Deloitte—released between them 31
named surveys in 2013 and 49 in 2014. Their
coverage is testimony to how well surveys do in
media.
2. To accredit or not to accreditShould you conduct the survey in-house or
partner with a research rm? While the stamp
of approval of an established research rm
does add a lot of credence, conducting in-
house surveys is on the rise—it is the content of
the ndings that matters the most.
3. Don't sweat the sample size—content is
king Sample size is not a predominant factor that
decides the fate of survey getting media
mileage. What matters more is the content,
relevance and the ndings of the survey. Even if
the survey has a small sample size, but its
ndings are relevant, the media houses will
The writing is on the
wall—opportunities to use
surveys to create buzz in
the media space is not
utilised to the fullest.
3Surveys to Know, Surveys to Show | A News Drivers Report from GBM Live! Newsroom
E F
Learn from the Consulting Big Four
To accredit or not to accredit
Don't sweat the sample size—content is king
Make them frequentTell a more visual story
Not so easy to get quotes carried
Top publications to target
Strike while the iron is hot�
MEDIA MILEAGE

consider carrying the survey along with their
stories. So, focus more on topic and content of
the survey rather than arranging a large sample
size. That said, to ensure authenticity of the
survey ndings the sample size should be
statistically signicant.
4. Tell a more visual storyInfographics are a good way to explain
complicated data in a simple way. Though, just
20% of the articles mentioning the survey also
carried an infographic in 2013 and just
marginally up at 21% in 2014; what makes the
observation more interesting is the percentage of
the article area that was covered by the
infographic. Despite the low numbers, it was
interesting to observe the percentage of an article
that was dedicated to the infographic
representation of facts, which has steadily
increased from 2013 to 2014. If the survey
reports have infographics for data
representations, then there is great scope that
media houses will pick up those infographics as
part of their stories.
5. Make them frequentMany survey reports generated media stories
throughout the year, especially the ones with
periodic frequencies. The monthly Bank of
America-Merrill Lynch Fund Manager Survey is a
prime example of how it continued to garner
maximum media coverage in 2013 as well as
2014.
6. Not so easy to get quotes carriedMedia tend to be uninterested in carrying quotes of
the spokesperson of the company that conducted
the survey; we observed just one-fourth of the
articles citing the survey carried the quote from the
company's spokesperson in 2013, though the
number went up in 2014.
7. Top publications to targetOnce the survey has been released, then which
publication should be pitched to carry the survey
ndings? We observed that amongst our media
universe, while the top business dailies publish the
maximum number of stories based on surveys,
mainlines such as The Times of India are not far
behind, especially for sectors other than Consulting
and Research. One should choose depending on
the target audience.
8. Strike while the iron is hot�Time the release of a survey's ndings with
opportunities relevant to the survey's ndings. For
example, opportunity- based surveys on the
elections in India before the general election in
2014, or say, a survey on gender diversity timed
around International Women's Day.
Be it an exercise to gather knowledge from the market, or a
showcase of thought leadership—Surveys to Know, Surveys to
Show—there is no denying the fact that research surveys serve
as an effective PR tool to garner media mileage.
4Surveys to Know, Surveys to Show | A News Drivers Report from GBM Live! Newsroom

2013
2014
MULTINATIONAL COMPANIES
INDIAN COMPANIES 105
153
1,750 ARTICLES 258 COMPANIES IN INDIA
2,004 ARTICLES261 COMPANIES IN INDIA
100
161
The SurveysAnalysis of surveys and their commissioning companies
In our study of the surveys covered by the print
media, we analysed the published articles that
were based on surveys commissioned by
companies in India. We drilled down on who
commissioned the surveys—multinational
companies operating in India versus Indian
companies; the sector analysis of the companies
that commissioned the surveys; survey
accreditation by research rms; sample size of
the research; periodic surveys as well as
opportunity-based topical trends that spiked a
surge in the coverage of surveys in India, among
others.
Multinational versus Indian companies
Of the 1,750 articles based on surveys
commissioned by 258 companies in India in
2013, 59% were commissioned by multinationals
operating in India. In 2014, of the 2,004 articles
based on surveys commissioned by 261
companies in India, 62% were commissioned by
multinationals. Multinational companies
operating in India clearly commissioned more
surveys than their Indian counterparts—a trend
that continued in 2013 as well as 2014. This
indicates the importance multinational
companies place in commissioning surveys as a
PR tool to help establish their brand presence in
local markets.
Of the total articles based
on surveys that were
covered by the print
media, multinational
companies operating in
India commissioned more
than 50% of the surveys.
5Surveys to Know, Surveys to Show | A News Drivers Report from GBM Live! Newsroom

0
10
20
30
40
50
60
70
Con
sultin
g IT
HR
Rese
arc
h
Med
ia &
En
tert
ain
men
t
Ban
kin
g
Real Est
ate PR
Travel
Insu
ran
ce
Fin
an
ce
FM
CG
Tele
com
Health
care
Ed
uca
tion
Tech
nolo
gy
En
erg
y
46
63
2013 2014
37
18
32
28 27
1615
9
12
9
5
12
53
57
4 4 4
9
3
02
5
0
3
02
02
02
Just the Big Four
Firms—PwC, KPMG,
EY, Deloitte—released
31 named surveys in
2013, 49 in 2014
Sector Analysis
By further drilling down the sectors of the survey-
commissioning companies, we found that consulting
rms dominated throughout 2013 and 2014 in
terms of churning out the maximum number of
survey reports—46 named surveys in 2013, and 63
named surveys in 2014. For example, the Big Four
rms—PwC, KPMG, EY, Deloitte—released a total of
31 named surveys in 2013, and the number further
increased to a total of 49 named surveys in 2014.
Consulting rms, true to the nature of their
work, thrive on research and analysis. But even
IT rms and other sectors such as HR are
joining the bandwagon by commissioning
research and surveys to establish themselves as
thought leaders in the market. For example, IT
rms such as Google and Cisco published six
and ve named survey reports respectively in
2013, and McAfee followed suit with three
named surveys in 2014.
6Surveys to Know, Surveys to Show | A News Drivers Report from GBM Live! Newsroom

Survey Accreditation
Most surveys are either conducted in-house, in
partnership with other agencies, or are
accredited by established research rms.
Accreditation by established market research
rms validates the methodology and ndings of
a survey. For example, research rms such as
Nielsen, Ipsos, TNS and IMRB accredited many
named surveys of other companies during 2013
and 2014.
Despite the potential of
bolstering research findings
through the stamp of
approval of accredited
research firms, conducting
independent in-house
surveys has been on a
higher trend.
7Surveys to Know, Surveys to Show | A News Drivers Report from GBM Live! Newsroom
How many named surveys were accredited by a research rm?
100% = 88
2014100% = 92
2013
80%
8%
12%
70%
11%
19% IN-HOUSE
ACCREDITED
WITH OTHER AGENCIES

Research data's sample size
Of the 1,750 articles covered by the print media
on surveys in 2013, only 31% mentioned the
sample size of the research data. In 2014, the
percentage gures were even lesser at 20% for a
total of 2,004 articles. This clearly indicates how
sample size is not a predominant factor for
getting media mileage. However, for the
authenticity of the research ndings, the sample
size should be statistically signicant.
Of all articles on surveys, how many mentioned sample size?
Even if the sample size is
small, if the findings are
relevant, media houses
will consider carrying the
survey stories—content,
truly, is king.
20%
80%
100% = 2,004
2014
69%
31%
100% = 1,750
2013
Not Mentioned Mentioned
8Surveys to Know, Surveys to Show | A News Drivers Report from GBM Live! Newsroom

Some keen observations
Opportunity-based topical surveys:
Owing to the Indian general election of 2014,
the run-up to the elections throughout 2013 and
the early part of 2014 saw a lot of political
surveys churned out by media houses as well as
the likes of Goldman Sachs and Google. Topical
opportunities must be seized.
Competition and one-upmanship drove
similar themed surveys:
As if spurred by the quest for one-upmanship,
2013 saw a lot of consulting rms releasing
survey reports based on a common topic, though
subtly differentiated. For example, EY's Bribery
and Corruption: Ground Reality in India, KPMG's
Fraud Survey, Kroll's Global Fraud Report and
PwC's Invading Privacy: Cyber Crimes on Rise,
focused on the common theme of fraud.
Periodic surveys received maximum media
coverage:
Periodic surveys managed to garner good media
exposure and coverage throughout the
year—irrespective of the frequency, be it monthly,
quarterly, annual or biennial. For example, the
Bank of America-Merrill Lynch Fund Manager
Survey, which is a monthly survey report,
garnered the maximum print media
coverage—generating 27 articles in 2013, and
31 articles in 2014.
9Surveys to Know, Surveys to Show | A News Drivers Report from GBM Live! Newsroom
0
5
10
15
20
Jan Feb Mar Apr May Jun Jul Aug Sep Oct Nov Dec
No
. o
f a
rtic
les
2013 2014
Bank of America-Merrill Lynch Fund Manager Survey was constantly in the news

52%
37%
11%19%
53%
28%
The Media CoverageAnalysis of survey stories and their print media coverage
100% = 1,750
2013
100% = 2,004
2014
Headline Mention Prominent Mention Passing Mention
From front-page coverage and prominent
headlines to passive mentions, use of
infographics and leadership quotes, coverage in
regional editions, among others—we tracked the
print media coverage of all the stories generated
by surveys to analyse what worked in reaping
maximum media mileage.
Front-page coverage and headline grabbers
Of the 1,750 articles on surveys in 2013, only
9% accounted for front-page stories. In 2014, the
percentage remained ditto at 9%, for a total of
2,004 survey stories. Surveys that made it to the
headlines were a low 19% in 2013, but rose up
considerably to 52% in 2014. Front-page
coverage however, remained grim—proving how
surveys should not be created keeping front-page
coverage in mind. Rather, front-page of
supplements specic to a sector ought to be
targeted. For example, HR surveys got featured
on the front-page of HR and career-specic
supplements.
Surveys should not be
created keeping front-page
coverage in mind. Rather,
the focus should be the
front-page of sector-
specific supplements.
How many articles on surveys made it to the front page of a publication?
9%
91%
100% = 1,7502013 100% = 2,0042014
What % of articles mentioned a survey's name in headlines?
10Surveys to Know, Surveys to Show | A News Drivers Report from GBM Live! Newsroom

Regional Editions
Of the seven editions we tracked, Delhi—the
capital city's edition—took the pole position in
providing maximum coverage on surveys in the
print media. The positions largely remained the
same for all the city editions in 2013 as well as
2014, in the descending order of editions from
Delhi, Mumbai, Bengaluru, Kolkata, Chennai,
the National edition, and Hyderabad.
Delhi—the capital city's
edition—took the lead
in providing maximum
coverage on survey stories.
Which region provided the maximum coverage on surveys?
Overall Articles 2,004
Overall Articles 1,750
2013
2014
141
187
227 228
279
318
370
168192
271 279306
383405
0
50
100
150
200
250
300
350
400
450
Hyderabad National Chennai Kolkata Bangalore Mumbai Delhi
11Surveys to Know, Surveys to Show | A News Drivers Report from GBM Live! Newsroom
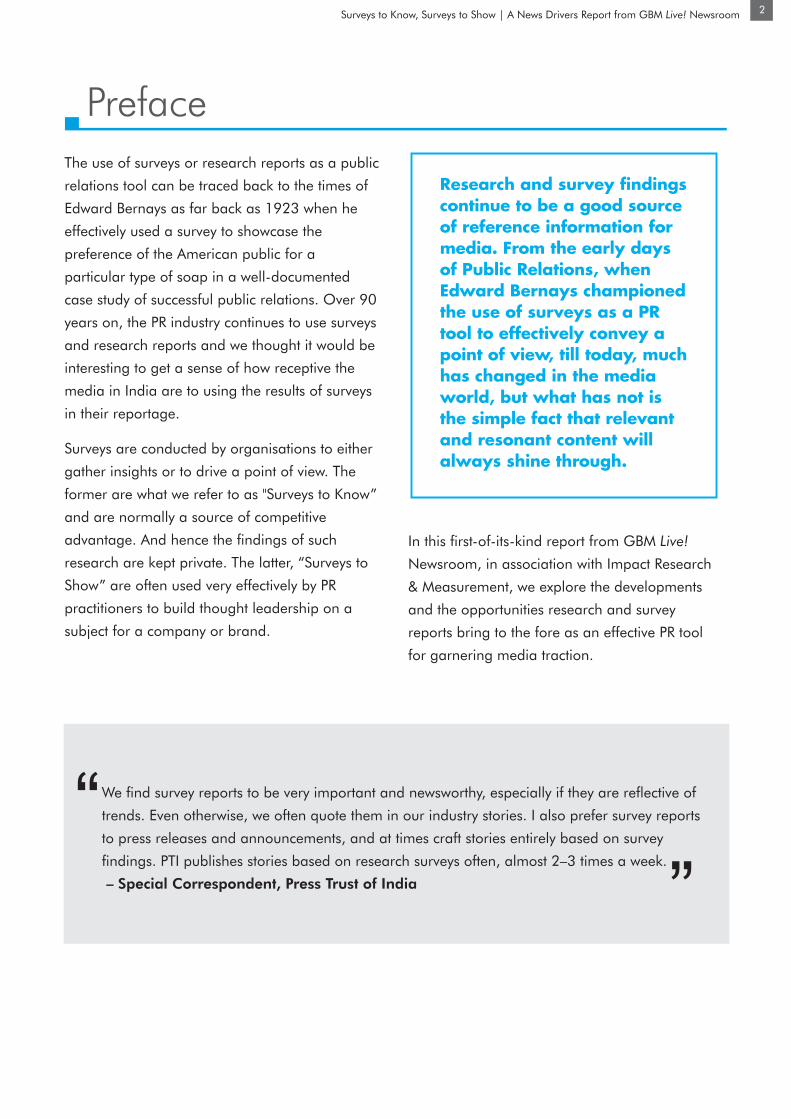
A picture speaks a thousand words
Infographics are a good way to explain
complicated data in a lucid way, though only
20% of the 1,750 survey articles in 2013
featured infographics, which was bettered by just
1% at 21% from a corpus of 2,004 survey
articles in 2014. Despite the low numbers, it was
interesting to observe the percentage of an
article that was dedicated to the infographic
representation of facts—in 2013, 25% of the
survey articles carrying an infographic allocated
100% area to the infographic; whereas in 2014,
32% of the survey articles devoted full area to the
infographic. It was also observed that media
houses do not create their own infographics for
the stories, but simply use the ones provided
originally with the story—highlighting the high
potential of a media house picking up the
infographic as part of their story.
The way media houses
allocate high print space to
an infographic highlights
the importance they pay to
graphic representation of
data.
2013
34% 14% 28% 25%
34% 28% 6% 32%
2014
What percentage of the article's area was covered by an infographic?
12Surveys to Know, Surveys to Show | A News Drivers Report from GBM Live! Newsroom
I cite survey reports and use them to
substantiate data points in my stories. We
publish stories based on survey ndings in
our publication, often 4–5 times in a month.
Especially, we use the infographics of the
survey ndings to complement our stories
as they simplify complex data for readers.
– Special Correspondent,
Business Standard “
“
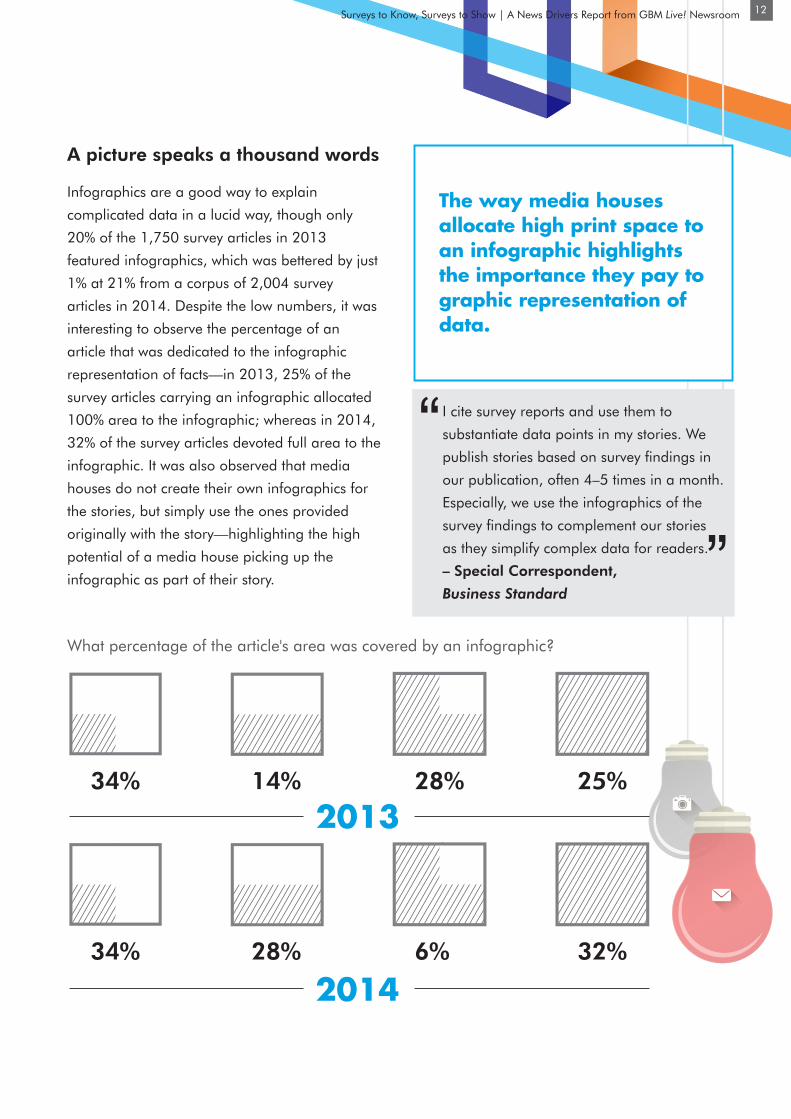
Quoting the spokesperson
We observed that articles citing a particular
survey did not necessarily carry a quote from the
spokesperson of the company that conducted or
commissioned the survey. Of the 1,750 survey
articles in 2013, only 26% carried quotes
whereas the gure for 2014 was better at 42%
from a total of 2,004 survey articles.
While quotes may seem
to add more credence, the
key findings and survey
results take centre-stage
over quotes from
spokespersons.
13
100% = 1,750 100% = 2,004
2014
42%
2013
26%
Surveys to Know, Surveys to Show | A News Drivers Report from GBM Live! Newsroom

Prominent Coverage
If the coverage of a survey cited the name of the
survey along with the name of the company that
commissioned the report, we have classied it as
prominent coverage. In 2013, of the 1,750
articles in total, 1,269 articles were classied as
prominent. In 2014, of the 2,004 articles in total,
1,791 articles received prominent coverage. The
percentage of headline mentions more than
doubled from 27% in 2013 to 58% in 2014.
On an average, one
particular survey elicited
seven prominent media
stories in 2013, and three
prominent media stories in
2014.
Headline Mention Prominent Mention
58%
42%
2014100% = 1,791
27%
73%
27%
73%
2013100% = 1,269
What % of prominent articles mentioned a survey’s name in headlines?
14Surveys to Know, Surveys to Show | A News Drivers Report from GBM Live! Newsroom

Some Keen Observations
Publications providing maximum coverage: We
observed that the business dailies such as The
Economic Times, Business Standard and The
Financial Express carried the maximum number
of articles on surveys, closely followed, and
sometimes trumped, by The Times of India. While
the business dailies primarily featured surveys on
Consulting and Research, The Times of India was
more HR- and IT-centric than other print
publications
2013 2014
THE FINANCIAL EXPRESS211 317 304 296
410 390 313 445
Survey articles published in
15Surveys to Know, Surveys to Show | A News Drivers Report from GBM Live! Newsroom

Media Universe
BENGALURU
IA
BM
UM
The Economic Times
Business Standard
Mint
The FinancialExpress
The Hindu Business Line
The Times of India
Hindustan Times
DNA
The Indian Express
The Hindu
BW Businessworld
Business Today
Business India
Forbes
CH
ENN
AI
LANOITAN
BUSINESS PAPERS
BUSINESS MAGAZINES
MAINLINES
MEDIA
16Surveys to Know, Surveys to Show | A News Drivers Report from GBM Live! Newsroom

While the media space is huge—digital media,
especially, with a wide range of metrics for
tracking digital content—we concentrated on the
print media as it has largely remained
unmapped, besides being of primary relevance
to the world of PR. Our report is based on the
print media coverage of research and survey
reports in select English publications of
India—tracked across six metropolitan cities of
Delhi, Bengaluru, Chennai, Mumbai, Hyderabad
and Kolkata. The media universe we tracked
and analysed comprised the top-14 English
publications, including mainlines, business
dailies and business magazines.
We analysed data for not one, but two
years—2013 and 2014. The rationale for the
protracted analysis has been to go beyond
outliers that may only account for a one-time ad
hoc affair in a year. A two-year period helps
conrm trends, especially periodic trends that
reprise annually. We scanned through the
dened media universe to collect articles that
mentioned research or survey reports, tracking
only those surveys that were conducted by
companies operating in India. Surveys
undertaken by an industry body or government
agency are not part of the analysis, except for
when the survey was conducted in collaboration
with a private company.
For both 2013 and 2014, we collected data on
the conducted surveys, and the media coverage
the surveys received, identifying aspects such as:
·The name of the survey
·The company that commissioned the survey
Whether the survey was accredited by a research firm or not
·Periodicity of the survey
·The sector the survey-commissioning company operates in
Total media mentions garnered by the surveys
—1,750 articles in 2013, and 2,004 articles in
2014—were inclusive of direct mentions in the
headlines or a passive mention as a reference
in the article, categorised as:
Headline mention
Prominent mention with the article talking primarily about the survey's findings
Passive mention of the survey as a reference in the article
Research Methodology
17Surveys to Know, Surveys to Show | A News Drivers Report from GBM Live! Newsroom
Keywords used to identify news articles are:
study conducted; survey by; study on; survey on;
research reports; key ndings; research ndings;
survey period; study period.

18
About Genesis Burson-Marsteller
Genesis Burson-Marsteller is a leading public
relations and public affairs consultancy that
delivers integrated communication services to
some of the best global and Indian companies.
Our focus is on creating real measurable impact
on our client's business through evidence based,
ideas driven and result oriented campaigns. We
have created a network across South Asia which
includes wholly owned ofces in seven of India's
key metros and a strong afliate footprint in
over 200 cities across India and in neighbouring
countries like Bangladesh, Bhutan, Nepal,
Pakistan and Sri Lanka.
Committed to Being More, we are one seamless
team that has a common purpose and attitude:
integrated across four practices (namely, Brand
and Consumer, Corporate and Financial,
Telecom and Technology as well as Health and
Wellness) and Centres of Expertise (Corporate
Responsibility, GBM Digital Studio, GBM Client
Studio, GBM Content & Design Bureau, GBM
Crisis & Issues Group, GBM Live! Newsroom,
Step Up, The Outstanding Speaker Bureau), to
assist clients achieve their business objectives.
About Impact Research &Measurement
Established in 2004, Impact Research and
Measurement is a leading Media Intelligence
rm in India. Impact conducts secondary media
research to help companies analyse their media
presence, and the impact of their media
relations programmes. Impact is the only Indian
company to have been granted full membership
of AMEC, the global trade body and
professional institute for PR agencies and
practitioners who provide media evaluation and
communication research. Impact is also a
member of FIBEP, that is the World Association
of Media Monitoring companies. Impact offers
media research, media monitoring &
measurement services that cover exposures in
Print Media in 50 Indian cities, Online sites and
Blogs, Television and conversations on Social
Media platforms.
Surveys to Know, Surveys to Show | A News Drivers Report from GBM Live! Newsroom

Copyright ©2015 Genesis Burson-Marsteller
All rights reserved.
For further details please contact:
Shilpa Karthik
Head - Marketing Initiatives
+919811793973 I www.genesisbm.inRESEARCH & MEASUREMENT