Embed Size (px)
Citation preview
The rise of VictoriaResearch base on .id Small Area Forecast information (SAFi)
September 2015
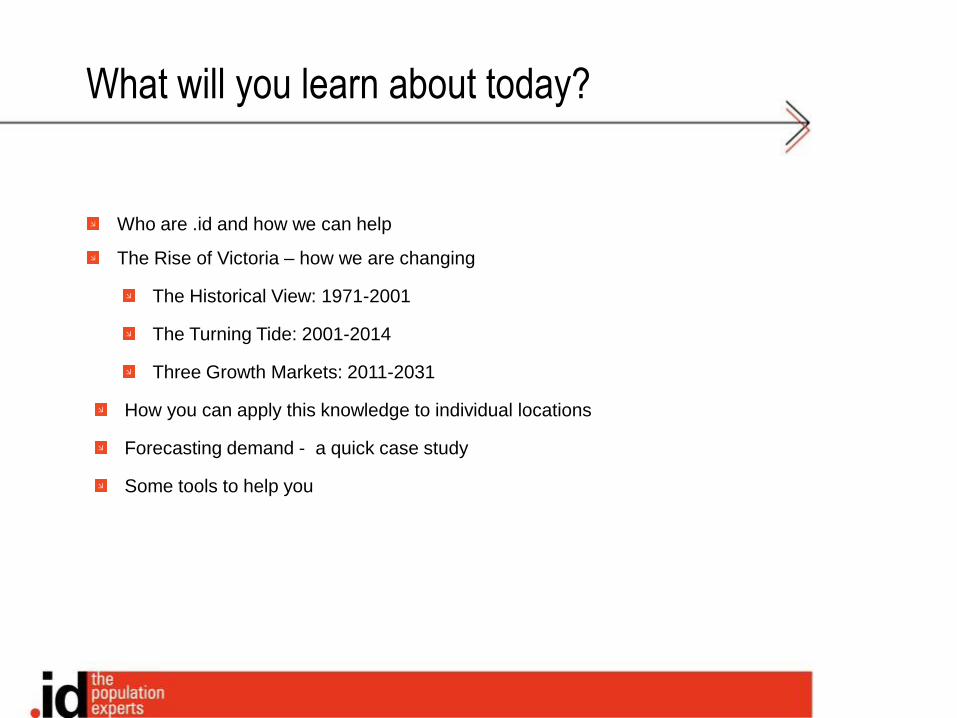
What will you learn about today?
Who are .id and how we can help
The Rise of Victoria – how we are changing
The Historical View: 1971-2001
The Turning Tide: 2001-2014
Three Growth Markets: 2011-2031
How you can apply this knowledge to individual locations
Forecasting demand - a quick case study
Some tools to help you
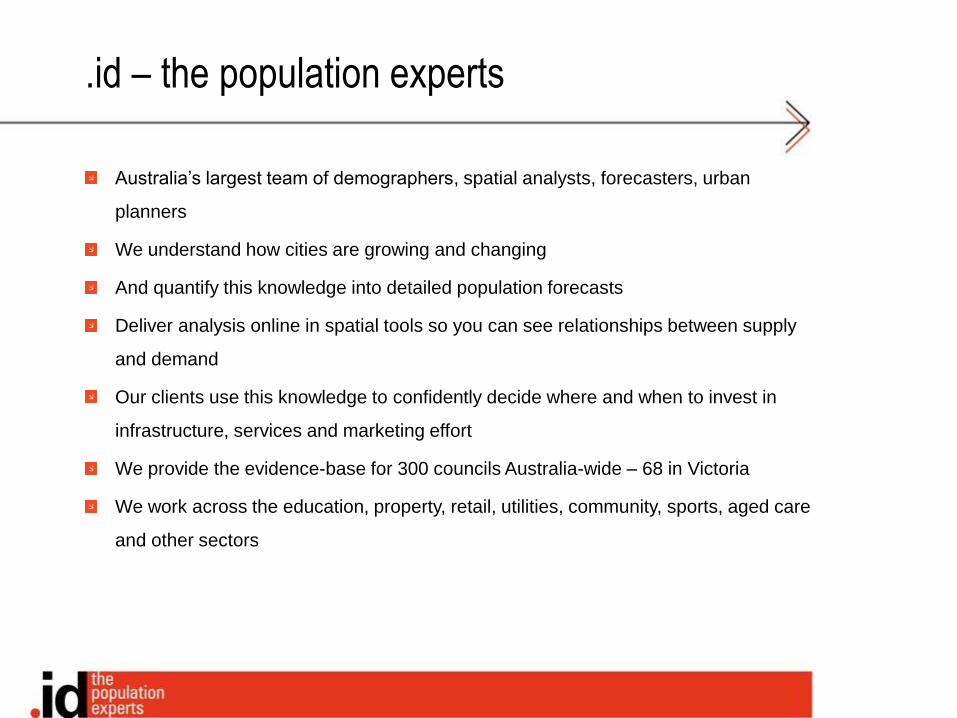
.id – the population experts
Australia’s largest team of demographers, spatial analysts, forecasters, urban
planners
We understand how cities are growing and changing
And quantify this knowledge into detailed population forecasts
Deliver analysis online in spatial tools so you can see relationships between supply
and demand
Our clients use this knowledge to confidently decide where and when to invest in
infrastructure, services and marketing effort
We provide the evidence-base for 300 councils Australia-wide – 68 in Victoria
We work across the education, property, retail, utilities, community, sports, aged care
and other sectors

The rise of Victoria
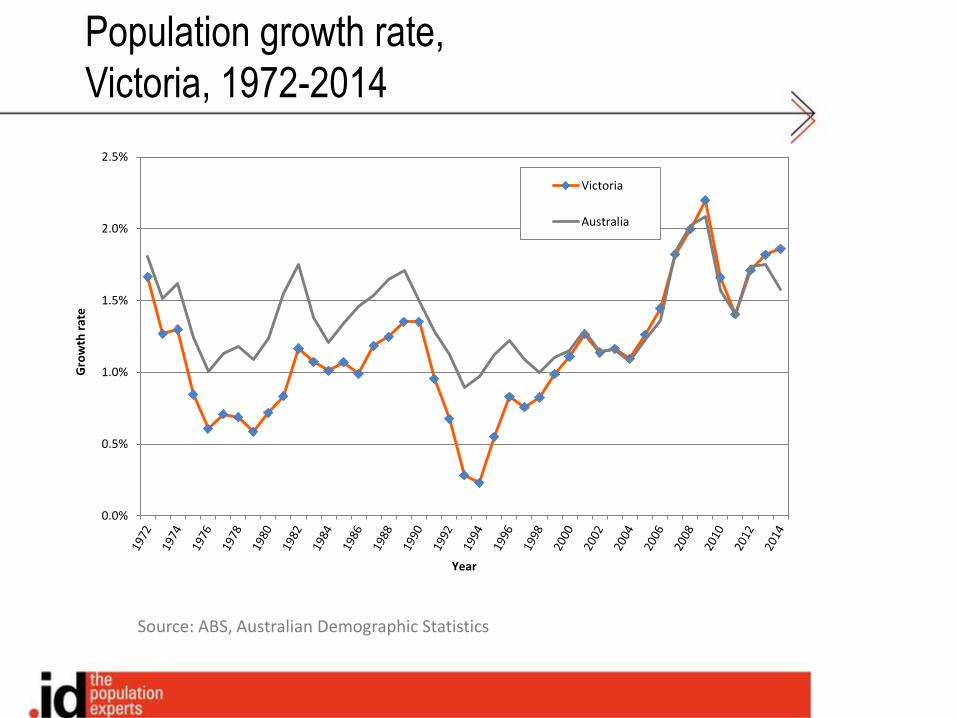
Population growth rate,
Victoria, 1972-2014
Source: ABS, Australian Demographic Statistics
0.0%
0.5%
1.0%
1.5%
2.0%
2.5%
Gro
wth
rat
e
Year
Victoria
Australia

What is driving this growth?
People coming from overseas?
Women having more babies?
People living longer?
People coming from interstate?
Different housing consumption patterns?
Increased residential building activity?
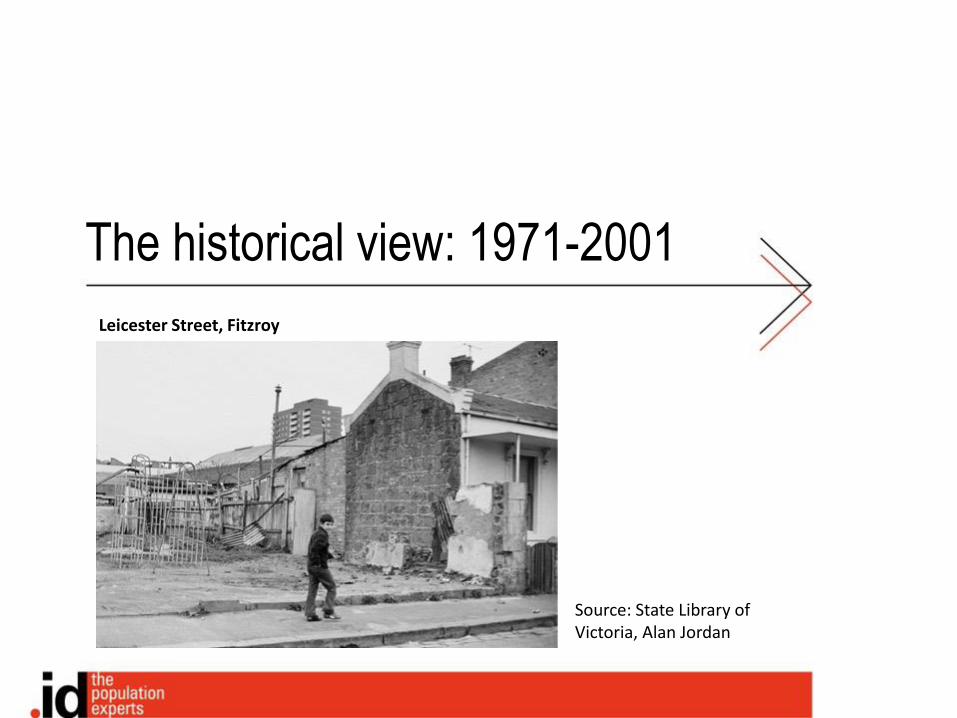
The historical view: 1971-2001
Source: State Library of Victoria, Alan Jordan
Leicester Street, Fitzroy
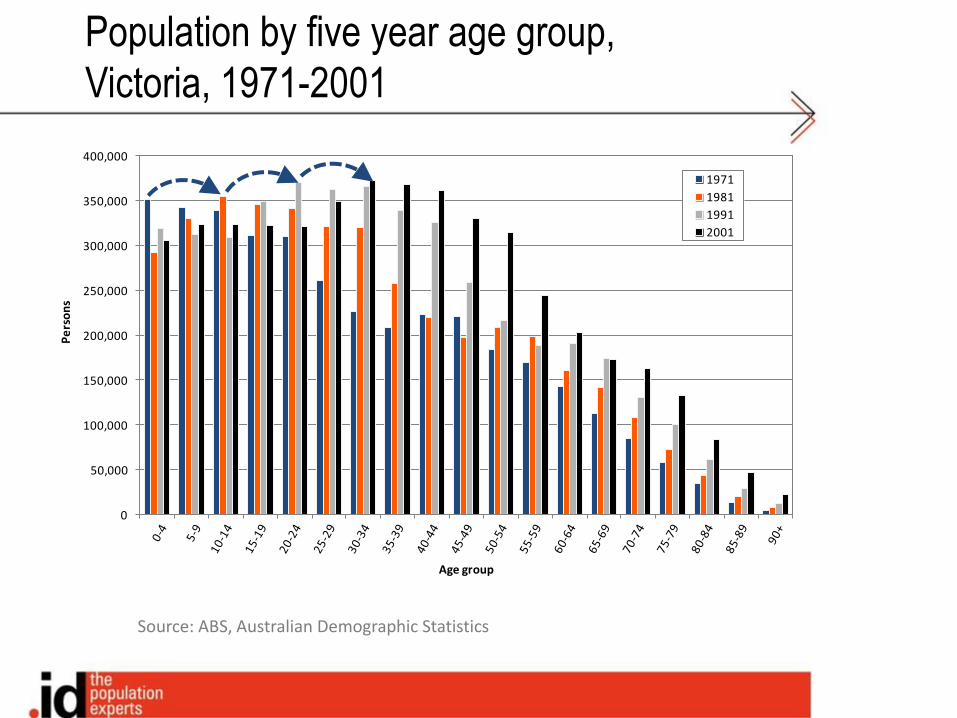
Population by five year age group,
Victoria, 1971-2001
0
50,000
100,000
150,000
200,000
250,000
300,000
350,000
400,000
Pe
rso
ns
Age group
1971
1981
1991
2001
Source: ABS, Australian Demographic Statistics
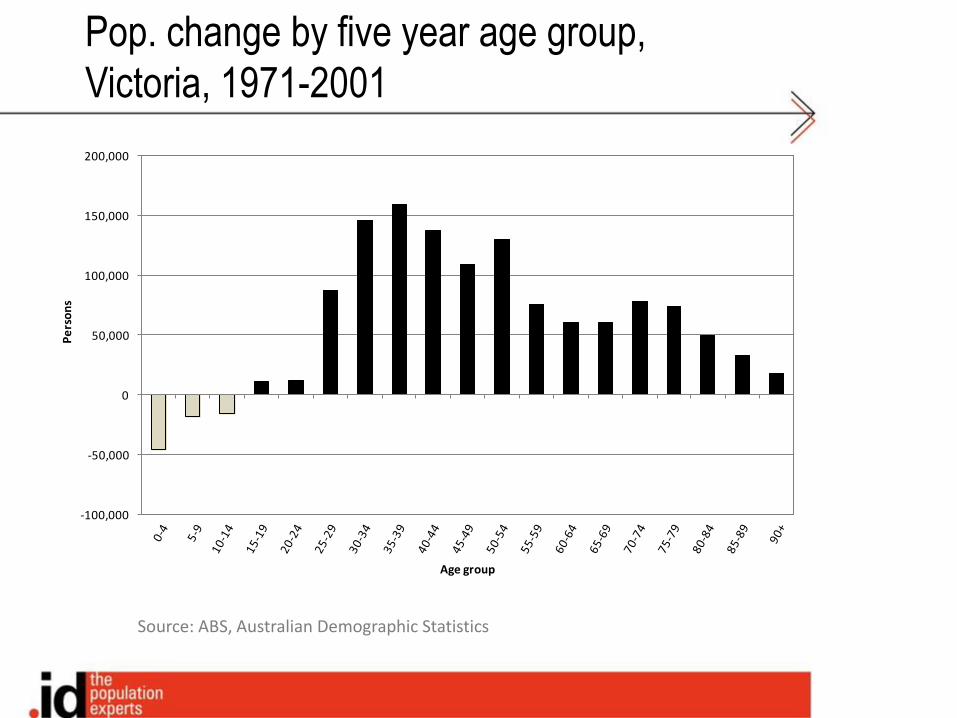
Pop. change by five year age group,
Victoria, 1971-2001
Source: ABS, Australian Demographic Statistics
-100,000
-50,000
0
50,000
100,000
150,000
200,000
Pe
rso
ns
Age group

The turning tide: 2001-2014
The changing face of Leicester Street, Fitzroy
Source: State Library of Victoria, Alan Jordan
Source: .id

0.0%
5.0%
10.0%
15.0%
20.0%
25.0%
30.0%
35.0%
40.0%
0
10,000
20,000
30,000
40,000
50,000
60,000
70,000
80,000
90,000
Shar
e o
f A
ust
ralia
Ne
t o
vers
eas
mig
rati
on
Year ending June 30
Net overseas migration Share of Australia
Source: ABS, Australian Demographic Statistics
Net overseas migration,
Victoria, 1976-2014

Source: .id – SAFi (historical population reconciliation)
0
10,000
20,000
30,000
40,000
50,000
60,000
70,000
80,000
Pe
rso
ns
Age group
Net overseas migration by age,
Victoria, 2006-2011
Source: ABS, Australian Demographic Statistics
0%
10%
20%
30%
40%
50%
60%
Shar
e o
f n
et
ove
rse
as m
igra
tio
n
Year ending June 30
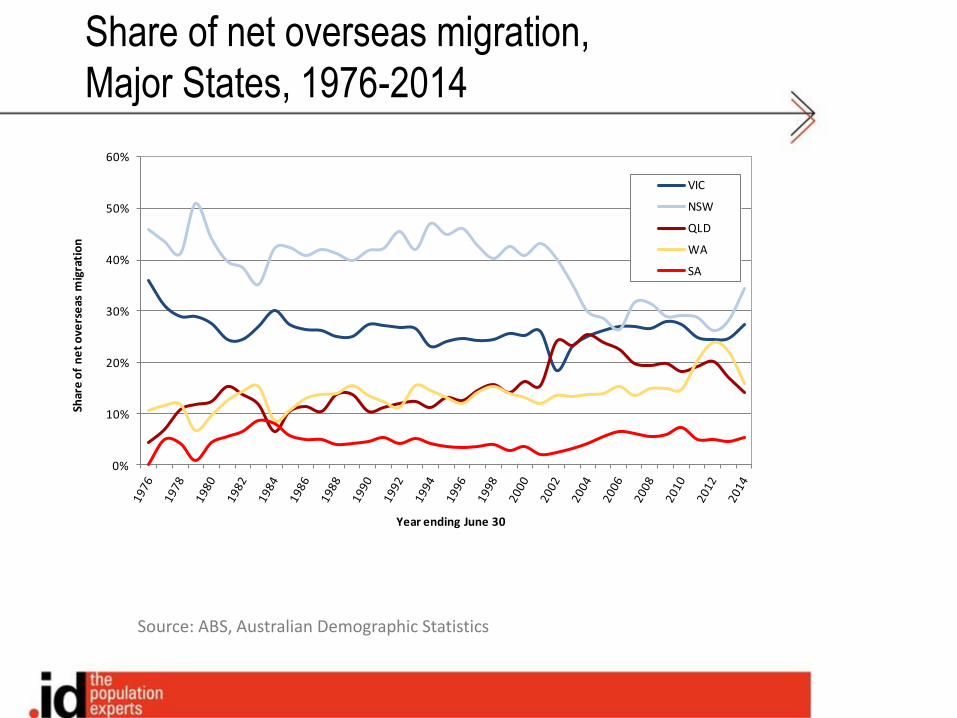
VIC
NSW
QLD
WA
SA
Share of net overseas migration,
Major States, 1976-2014
Source: ABS, Australian Demographic Statistics
-30,000
-25,000
-20,000
-15,000
-10,000
-5,000
0
5,000
10,000
15,000
1976 1981 1986 1991 1996 2001 2006 2011
Nu
mb
er
of
pe
rso
ns
Year
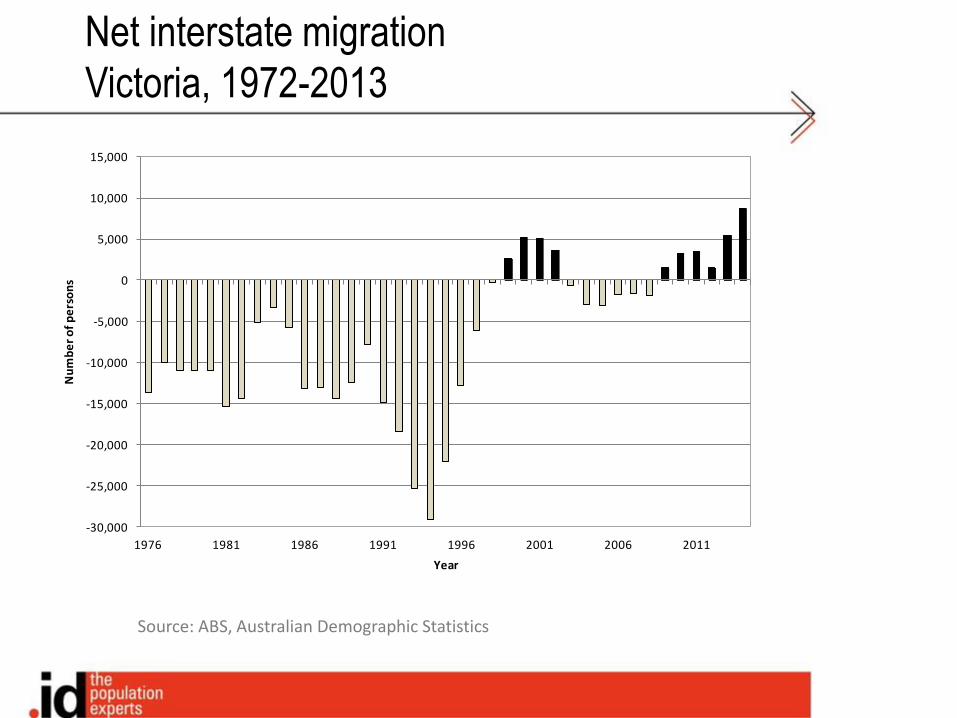
Net interstate migration
Victoria, 1972-2013
Impetus for growth - economic
Attractiveness of Australia to tertiary students and vocational training
Long period of sustained economic growth – GFC resilience
Comparatively poor performance of competitor countries such as US,
Canada and Western Europe, post 2008
Mining boom – investment hub
Growth in Chinese economy
Higher interest rates (relative to other OECD countries) encouraging foreign
investment
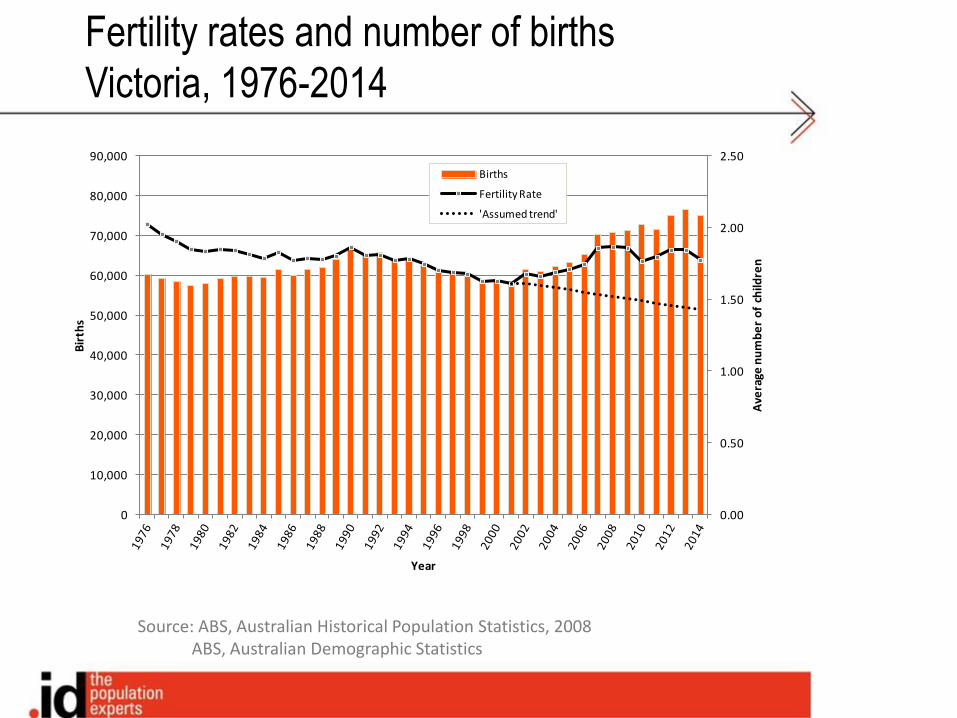
Source: ABS, Australian Historical Population Statistics, 2008ABS, Australian Demographic Statistics
Fertility rates and number of births
Victoria, 1976-2014
0.00
0.50
1.00
1.50
2.00
2.50
0
10,000
20,000
30,000
40,000
50,000
60,000
70,000
80,000
90,000
Ave
rage
nu
mb
er
of
child
ren
Bir
ths
Year
Births
Fertility Rate
'Assumed trend'
Impetus for growth - social
Higher fertility rates
More flexible work arrangements
Changing balance of power in labour relations (low unemployment and high
labour demand)
Improved access to child care and incentives for having children
Shared responsibility for children?
Source: ABS, Australian Demographic Statistics
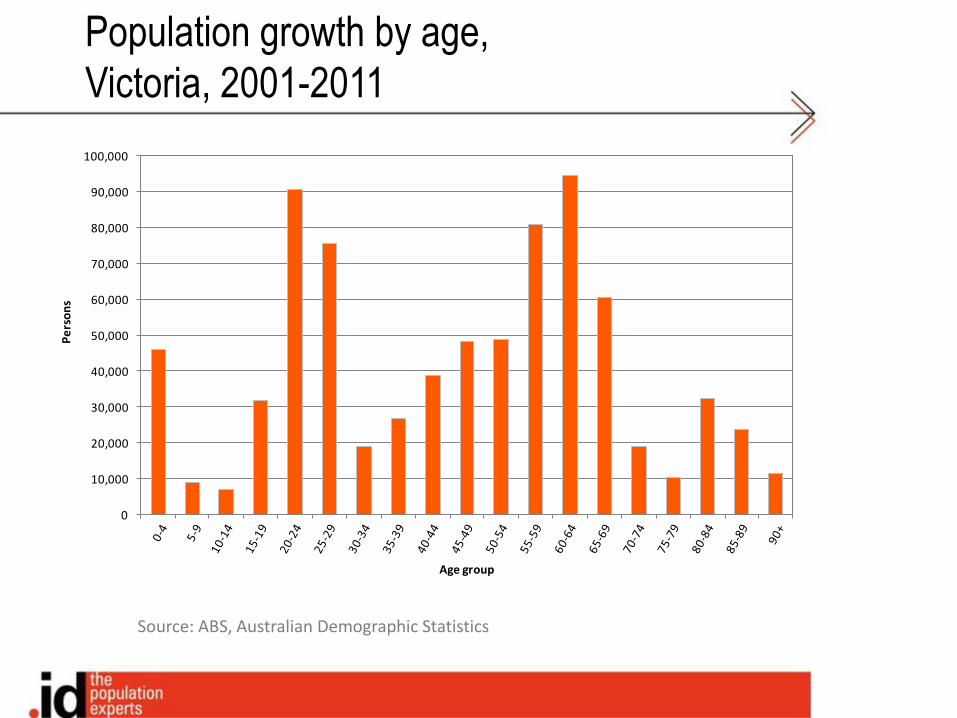
Population growth by age,
Victoria, 2001-2011
0
10,000
20,000
30,000
40,000
50,000
60,000
70,000
80,000
90,000
100,000
Pe
rso
ns
Age group

Three growth markets: 2011-2031Cnr Howarth and Beith St Brunswick
Source: .id
0
20,000
40,000
60,000
80,000
100,000
120,000
140,000
160,000
Pe
rso
ns
Age group
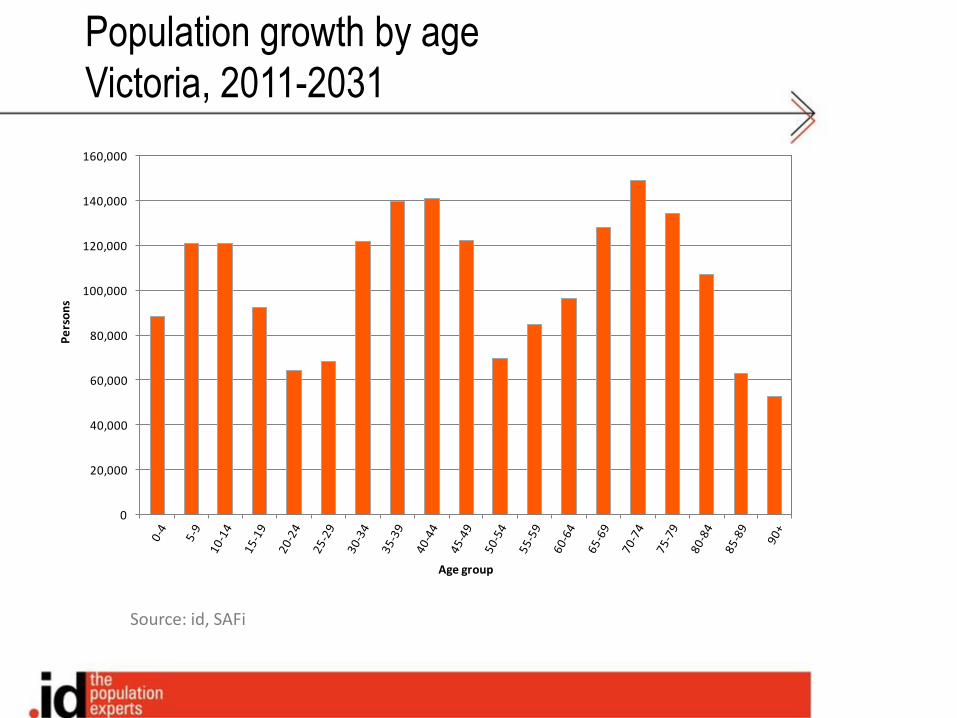
Population growth by age
Victoria, 2011-2031
Source: id, SAFi

0
100,000
200,000
300,000
400,000
500,000
600,000
Pe
rso
ns
Age group
2011
2021
2031
Population by age
Victoria, 2011, 2021 & 2031
Source: id, SAFi

0.0%
1.0%
2.0%
3.0%
4.0%
5.0%
6.0%
7.0%
8.0%
9.0%
Pe
rso
ns
Age group
Victoria
Australia
Canada
Japan
Age structure comparison
Selected states and countries, 2035
Source: id, SAFi; UN Population Division, World Population Prospects: The 2012 Revision: Medium Fertility Series
The changing urban landscape
0
20,000
40,000
60,000
80,000
100,000
120,000
140,000
Nu
mb
er
Year ending June 30
Population change
Building approvals
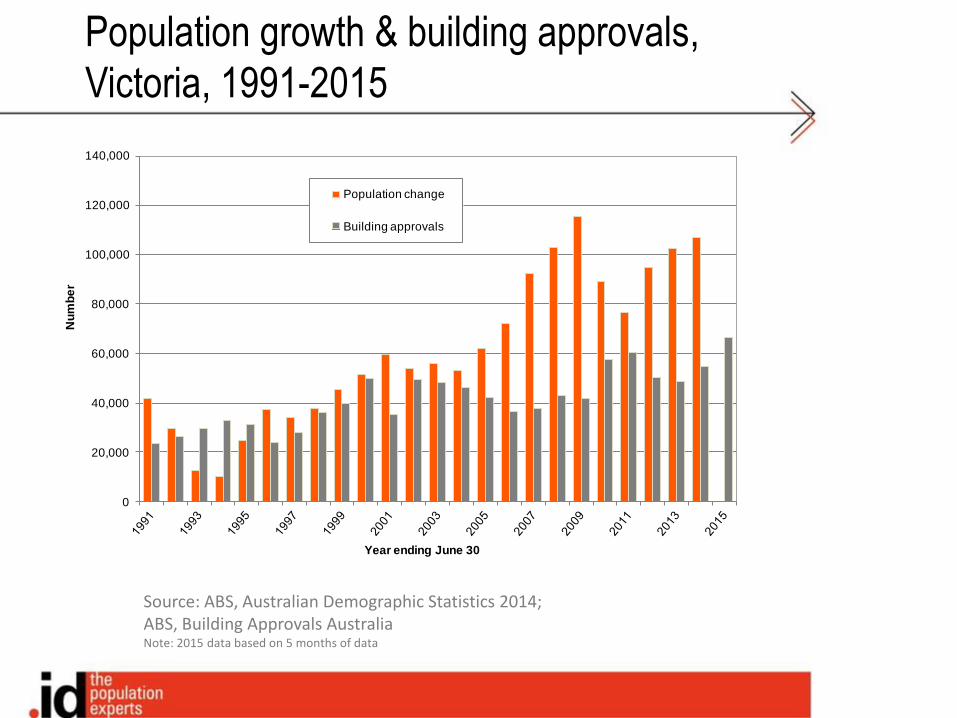
Source: ABS, Australian Demographic Statistics 2014; ABS, Building Approvals AustraliaNote: 2015 data based on 5 months of data
Population growth & building approvals,
Victoria, 1991-2015
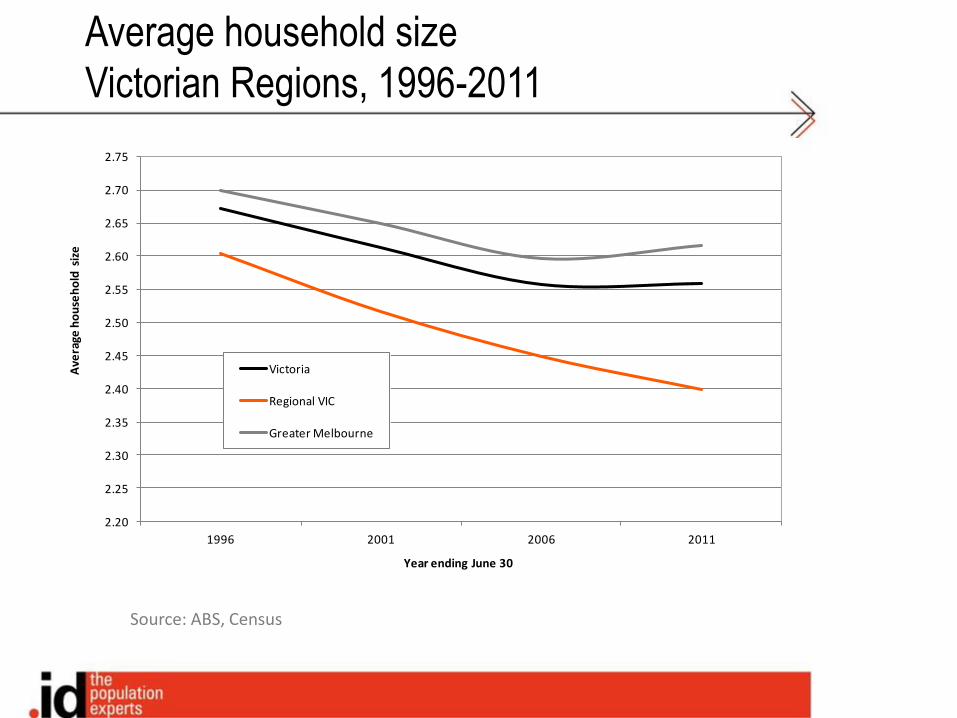
2.20
2.25
2.30
2.35
2.40
2.45
2.50
2.55
2.60
2.65
2.70
2.75
1996 2001 2006 2011
Ave
rage
ho
use
ho
ld s
ize
Year ending June 30
Victoria
Regional VIC
Greater Melbourne
Average household size
Victorian Regions, 1996-2011
Source: ABS, Census

Source: ABS, Census; id, SAFi
0
20,000
40,000
60,000
80,000
100,000
120,000
1991-96 1996-01 2001-06 2006-11 2011-16 2016-21 2021-26 2026-31 2031-36
Dw
ell
ing
gro
wth
Period
Established areas
Greenfield
Historical
Forecast
Dwelling growth, established versus
greenfield, Melbourne, 1991-2036

Evolution of the development industry
in Melbourne (1)
Introduction of developer contributions
Investment in and creation of ‘place’ in fringe developments
Smaller residential lots and developer emphasis on public open space
Build on as much of the lot as possible
Displacement of smaller and medium sized builder / developers to inner
and middle suburbs

Source: Nearmap
Development in Truganina, Wyndham, 2009
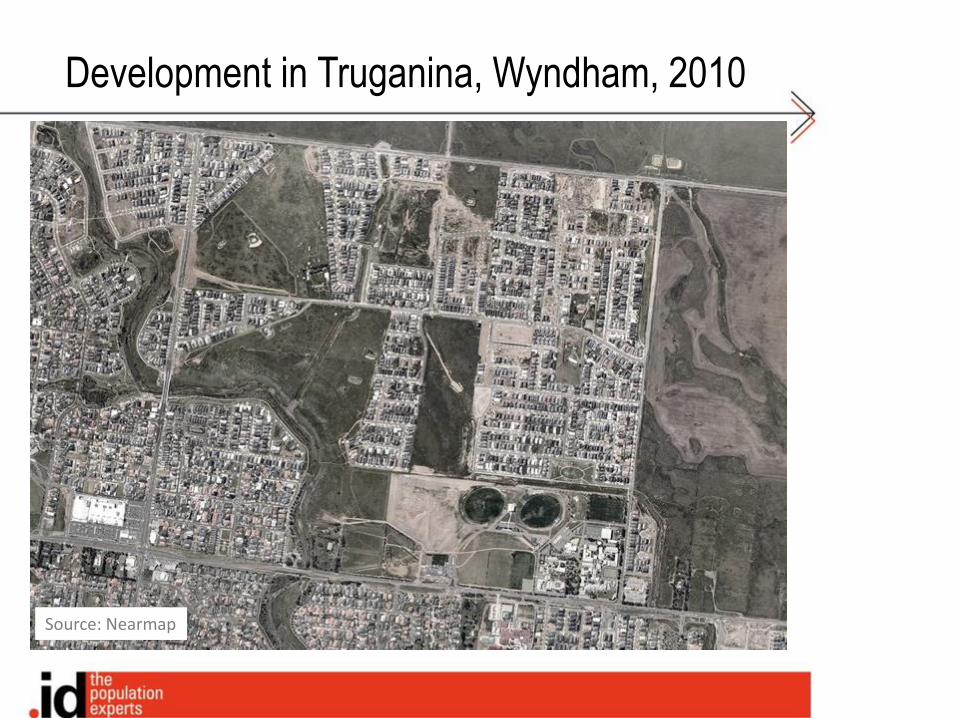
Source: Nearmap
Development in Truganina, Wyndham, 2010
Source: Nearmap

Development in Truganina, Wyndham, 2011
Source: Nearmap
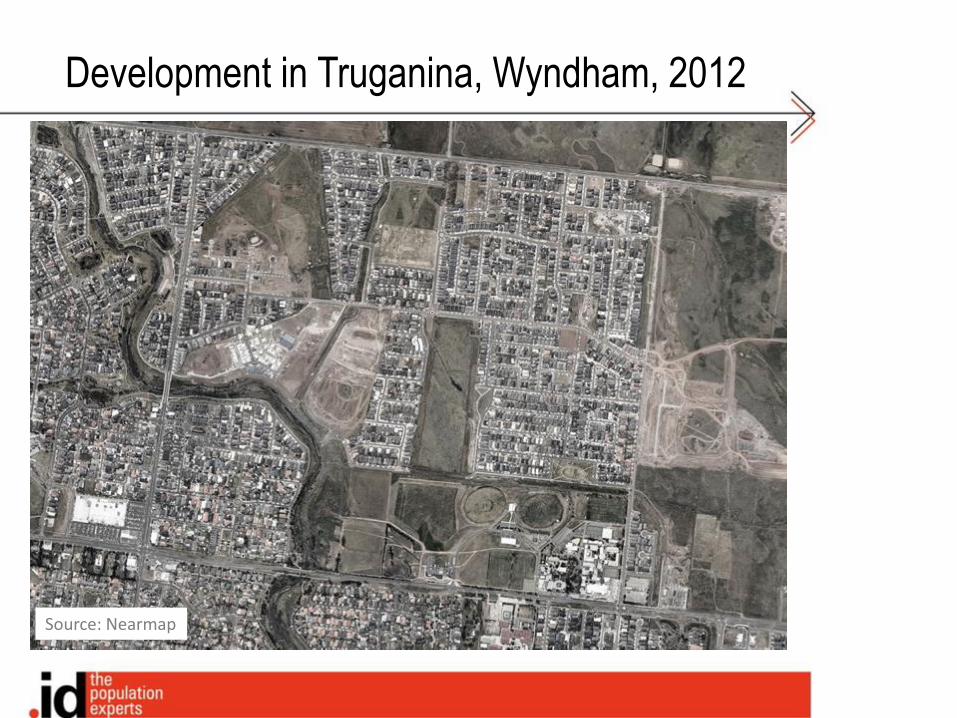
Development in Truganina, Wyndham, 2012
Source: Nearmap
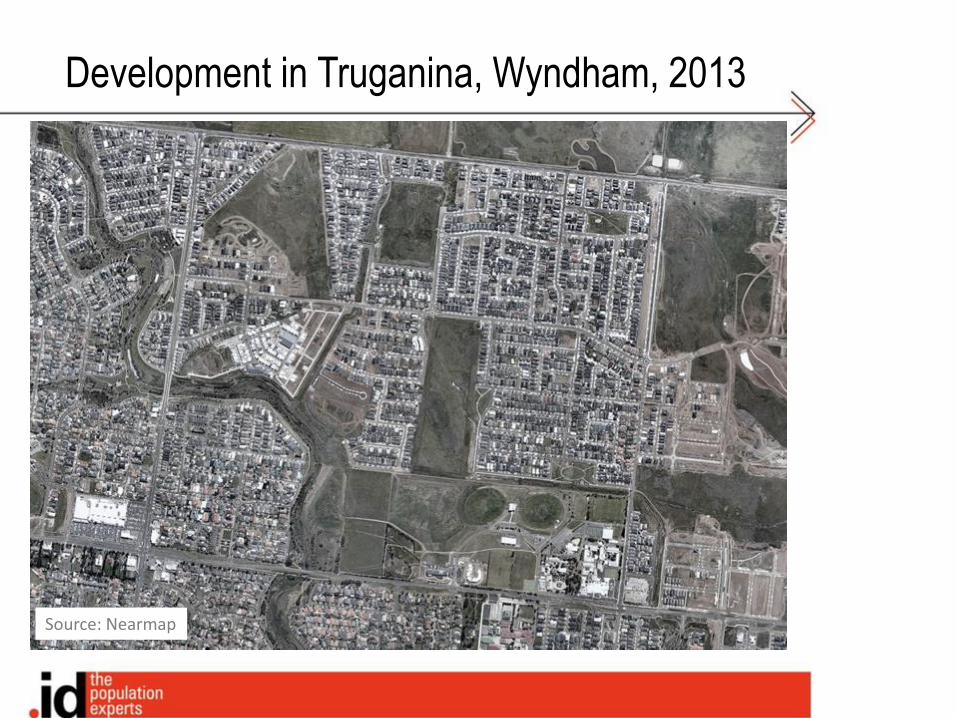
Development in Truganina, Wyndham, 2013
Source: Nearmap

Development in Truganina, Wyndham, 2014
Source: Nearmap
Evolution of the development industry
in Melbourne (2)
The great 1990s sell-off (school sites, utilities land)
De-industrialisation
Emphasis on place over housing (I want to live in this area!!)
Lack of investment in public transport, especially at the fringe
New development in established areas is providing housing variety -
opportunities for young to ‘enter’ market and old to ‘exit’
Created political issues for government (Save our suburbs & NIMBY) that
require good planning and design solutions
More development on smaller lots (minimum thresholds falling)
New format planning schemes
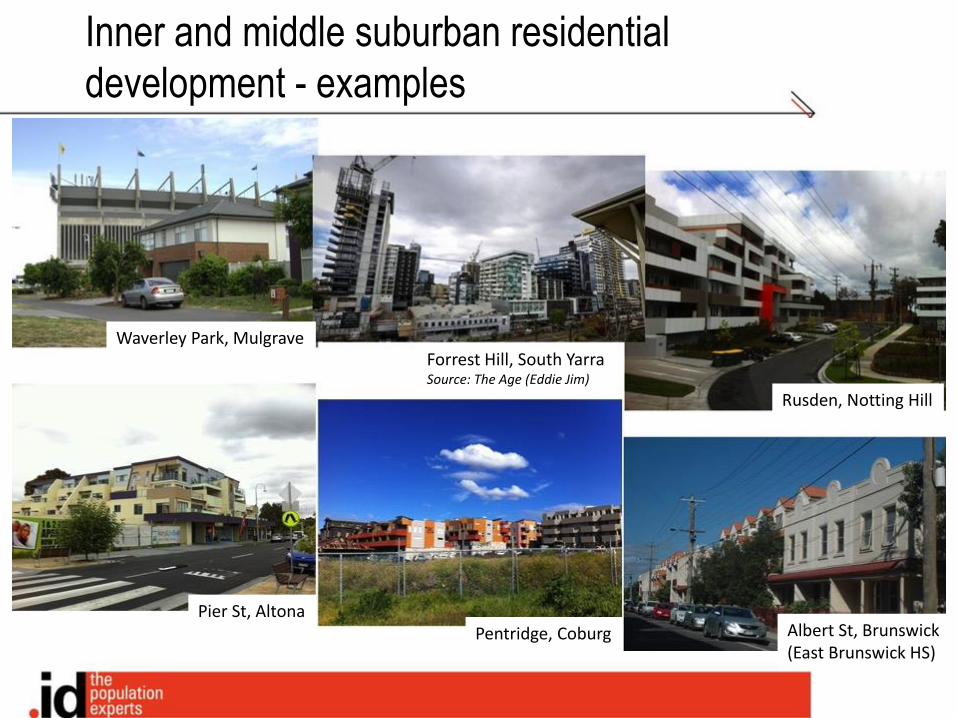
Inner and middle suburban residential
development - examples
Waverley Park, Mulgrave
Rusden, Notting Hill
Forrest Hill, South YarraSource: The Age (Eddie Jim)
Pier St, AltonaPentridge, Coburg Albert St, Brunswick
(East Brunswick HS)

Inner and middle suburban residential
development – identified sites, 2011+
Conclusions
There has been a transformation of Victoria’s population prospects over the last
decade, driven by high rates of overseas migration and higher fertility
Population growth is now likely to be higher and more ‘youthful’ than previously
expected, but the challenge of ageing remains
Change is driven by economic factors as well as social components (higher birth
rates / more stable household size
Growth has increased rapidly in established parts of Melbourne in the past 5
years and there are vast numbers of sites in the pipeline.
Volatility means timely updates to forecasts are critical

What did we use for this analysis?
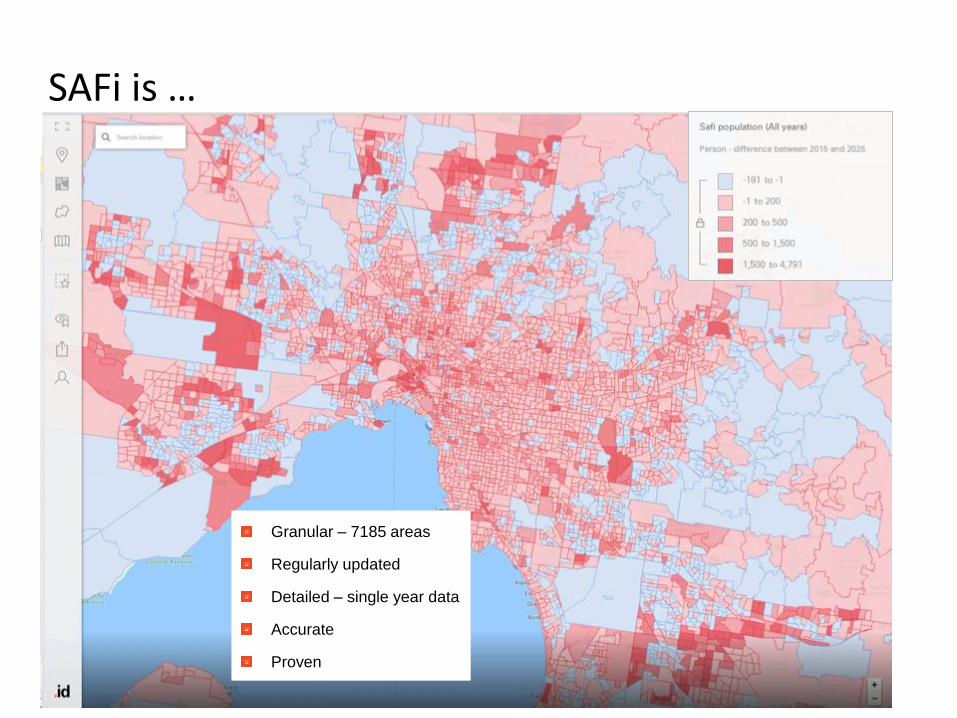
SAFi is …
Granular – 7185 areas
Regularly updated
Detailed – single year data
Accurate
Proven
Who is using SAFi?
More resources
Download the complete eBook
Watch the webinar recording
Subscribe to the blog.id.com.auFeed your curiosity