Embed Size (px)
Citation preview

Towards the True Elasticity of Spark
Michael Le and Min Li IBM, T.J. Watson Research Center

Auto-Scaling • Detects changes of resource usage in current workloads →
Dynamically allocate/de-allocate resources • Meets SLA requirements at reduced cost • Existing auto-scaling approaches react slowly and often miss
optimization opportunities • YARN and Mesos have initial auto-scaling support, yet how
workloads can benefit from the capability?
Infrastructure as a Service"Resource Manager (YARN/Mesos)"

Main Focus • Analyze how scaling affects Spark workloads
– Is simply adding new resources sufficient for performance improvement?
• Analyze pros/cons of current Spark auto-scaling mechanism – Are there rooms for performance improvement?

Agenda • Introduction • Evaluation setup • Impact of scaling • Auto-scaling in Spark • Lessons and future work

Experimental Setup • Baseline setup (6 nodes):
• Node: 4 CPUs, 8GB, 100 GB HDDs • YARN executor: 3GB, 1CPU • Mesos executor: 6GB and 4CPUs
• 4 benchmarks (SparkBench*): – Kmeans (input 37GB) – Page Rank (input 1.1GB) – Spark SQL: SQL queries (input 39GB) – Logistic Regression (input 47GB)
• Scaling up: add 4 new nodes “instantaneously” • Wait ~45 seconds after benchmark run
• Scale down – wait 3min after benchmark run * h6ps://bitbucket.org/lm0926/sparkbench
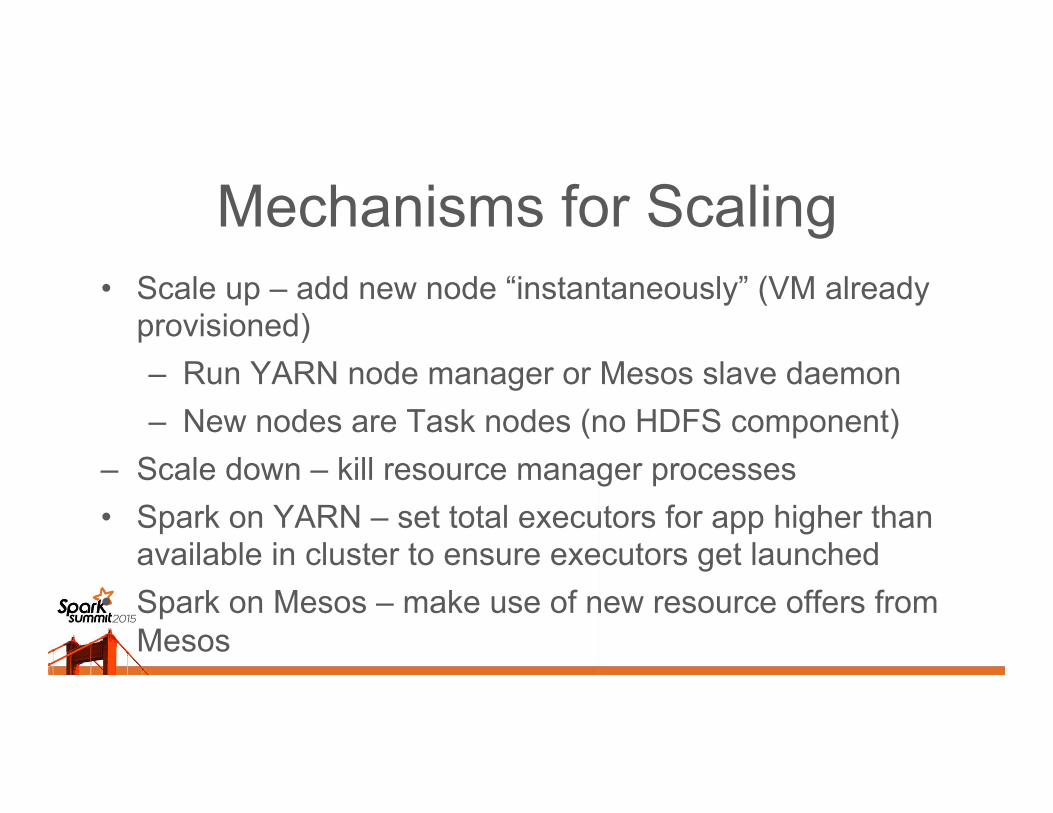
Mechanisms for Scaling • Scale up – add new node “instantaneously” (VM already
provisioned) – Run YARN node manager or Mesos slave daemon – New nodes are Task nodes (no HDFS component)
– Scale down – kill resource manager processes • Spark on YARN – set total executors for app higher than
available in cluster to ensure executors get launched • Spark on Mesos – make use of new resource offers from
Mesos

Agenda • Introduction • Evaluation setup • Impact of scaling • Auto-scaling in Spark • Lessons and future work

Runtime – Spark on YARN
Benchmark! Runtime (baseline)!
Runtime !(scale out)!
Runtime Reduction!
Kmeans" 54min 44sec" 29min 26sec" 46%"Page Rank" 9min 28sec" 8min 18sec" 12.3%"
Spark SQL queries" 15min 45sec" 13min 11sec" 16.3%"LogisticRegression" 13min 10sec" 12min 55sec" 2%"
Similar behavior seen on Mesos

Why the variation? • Delay scheduling preventing tasks to be scheduled on
new node
Benchmark! Total tasks!
% tasks locality preference
RACK or ANY!
% tasks wait >3s to be scheduled!
% tasks on new nodes!
KMeans" 7800" 0.4%" 3.5%" 24.5%"Page Rank" 21600" 0%" 0.01%" 13.5%"Spark SQL" 9805" 3%" 0.2%" 11.8%"
LogisticRegression" 6637" 0%" 0.1%" 1.5%"

Tuning Spark for Scaling • locality wait time
– How soon to change locality preference of tasks in stage
• resource revive interval – How soon to inform scheduler a resource that has not
been used is still available

Runtime – Tuning Spark Benchmark! Runtime
(baseline)!Runtime
(scale out)!Runtime (scale
out– revive interval 100ms)!
Runtime (scale out– locality wait
time 100ms)!
Runtime (scale out–locality wait
time 0ms)!KMeans" 54min 44sec" 29min 26sec" 30min 39sec" 11min 32sec" 14min 1sec"
Page Rank" 9min 28sec" 8min 18sec" 8min 35sec" 7min 35sec" 5min 57sec"Spark SQL queries" 15min 45sec" 13min 11sec" 12min 55sec" 11min 40sec" 19min 57sec"LogisticRegression" 13min 10sec" 12min 55sec" 12min 43sec" 6min 54sec" 9min 12sec"
Benchmark! % tasks on new node (locality wait
time 3s)!
% tasks on new node (locality wait time
100ms)!
% tasks on new node (locality wait time
0ms)!KMeans" 24.5%" 39.1%" 38%"
Page Rank" 13.5%" 16.1%" 39%"Spark SQL queries" 11.8%" 22.6%" 39%"LogisticRegression" 1.5%" 38%" 39%"

KMeans - CPU Utilization Per Node
Scale out (locality wait - 100ms) 1 of the 4 new nodes
Base line (1 of the 6 base nodes) Scale out (locality wait - 100ms) 1 of the 6 base nodes
Scale out (locality wait - 0ms) 1 of the 6 base nodes
Scale out (locality wait - 0ms) 1 of the 4 new nodes

KMeans - Network Utilization 10 MB shuffle read 12 MB shuffle write
Baseline
10 MB shuffle read 11 MB shuffle write
Scale out (locality wait - 100ms)
Greater bandwidth consumption due to transferring of RDD partitions
Scale out (locality wait - 0ms)
10 MB shuffle read 12 MB shuffle write

KMeans - Memory Utilization
Baseline KMeans – scale out (locality wait - 100ms)
KMeans – scale out (locality wait - 0ms)

PageRank - CPU Utilization
Scale out (locality wait - 100ms) 1 of the 4 new nodes
Base line (1 of the 6 nodes) Scale out (locality wait - 100ms) 1 of the 6 nodes
Scale out (locality wait - 0ms) 1 of the 4 new nodes
Scale out (locality wait - 0ms) 1 of the 6 nodes

PageRank - Network Utilization 15.50 GB shuffle read 16.71 GB shuffle write
Baseline
16.07 GB shuffle read 16.71 GB shuffle write
Scale out (locality wait - 100ms)
Greater bandwidth consumption due to transferring of RDD partitions
16.10 GB shuffle read 16.73 GB shuffle write
Scale out (locality wait - 0ms)

PageRank - Memory Utilization
Baseline Scale out (locality wait - 100ms)
Scale out (locality wait - 0ms)

SQL – Network Utilization
Scale out (locality wait - 0ms) Scale out (locality wait - 100ms)
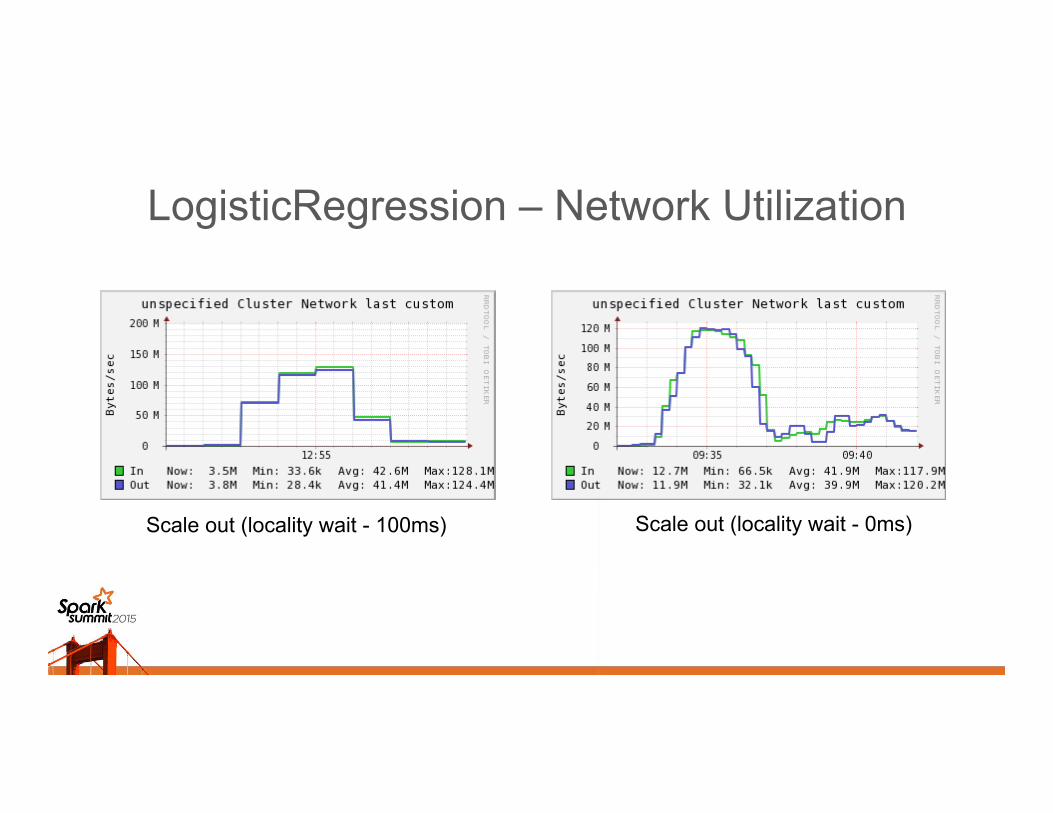
LogisticRegression – Network Utilization
Scale out (locality wait - 0ms) Scale out (locality wait - 100ms)

Take-aways • Locality wait time is key to improvement
– Tune during runtime? – Adjust during scaling to force use of new
nodes • Need to consider gains from running task
on new nodes vs. network bandwidth used

Scaling Down Benchmark" Runtime – Baseline
(10 nodes)"Runtime – "Scale in"
KMeans" 11min 54sec" 49min 13sec"
PageRank" 11min 41sec" 13min 12sec"
Spark SQL" 12min 50sec" 15min 52sec"
LogisticRegression" 10min 20sec" 14min 7sec"
Re-execution overhead worst for some workloads

Scaling Down with Mesos/YARN • Prevent Spark from scheduling more tasks on
nodes that are selected to removed – Mesos fine-grained, simply not offer resource
from node selected for removal – Mesos coarse-grained and YARN, requires
cooperation from Spark to not schedule new tasks on nodes selected for removal
• Shutdown node once tasks are drained – What to do about stored shuffle data?

Agenda • Introduction • Background • Evaluation setup • Impact of scaling • Auto-scaling in Spark • Lessons and future work

Existing Auto-scaling Mechanism • Dynamic Executor Allocation (DEA)
– Works only with YARN – Spark request new executors after a fixed time interval
when there are still pending tasks – Number of requested executors grow exponentially
• Works but does have some potential inefficiency

Improving Auto-scaling • Main reason tasks are not scheduled on new node
is data locality preferences – Delay scheduling preventing tasks from being
run on new node • Approach:
– Change locality wait time dynamically during application runtime
– Ideally, reduce locality wait time at point of scale out, then after stabilizes, revert to previous locality wait time value

Improving Auto-scaling Details • Ideally: tasks spread evenly among all executors
– average # of tasks per executor: • T = Total tasks / # executors
• ti = # of tasks per executori • If ti < alpha*T, for s seconds, then change locality
wait time • If ti is still below threshold after r seconds from first
change of locality time, then remove executor • If no executors below threshold, reset locality wait
time to initial value

Dynamically Adjusting Locality Wait Time at Runtime with Dynamic Allocator Execution
Benchmark! Runtime (scale out w/
DEA)!!
% tasks on new node (locality wait time 3s)!
Runtime!(scale out w/
DEA and runtime adjustment of
locality wait time)!
% tasks on new node (dynamic
locality wait time)!
KMeans" 32min 15sec" 28.6%" 20min 35sec" 35%"PageRank" 12min 2sec" 12.9%" 11min 23sec" 14%"Spark SQL" 12min 48sec" 11.5%" 12min 26sec" 16%"
LogisticRegression"
11min 58sec" 0.7%" 12min 16sec" 3.3%"
Parameters: alpha = 30%, s = 5sec, new locality wait time = 100ms Mechanism helps at increasing % tasks on new nodes

Simple Auto-scaling Improvements Existing Mechanism
Description Drawbacks Proposal
When to scale? Backlogged tasks exist for n secs
Request CPU resources when Tasks might be I/O bound
CPU/memory of more than 50% nodes are greater than a threshold t (e.g., 98%) over n seconds
How many more VMs?
Increase exponentially number of executors until configured max or # of pending tasks
Initially under request n% of the task queue length
Whether to scale (still beneficial)?
Always scale if above condition met
Scaling unnecessary if near end or short runtime
Option1: According to the ratio of unprocessed data: e.g., < 80%. Rough estimation of job execution time: proportional to the data process rate
Option2: Model driven – predict runtime based on previous runs

Agenda • Introduction • Evaluation setup • Impact of scaling • Auto-scaling in Spark • Lessons and future work

Lessons • Naïve scaling can help but effectiveness varies greatly
across different workloads • Why some workloads do not respond well to scaling?
– Delay scheduling preventing new nodes to be utilized • Dynamic executor allocation works but can be improved
– Dynamically changing locality wait time can be effective
• Overhead of transferring RDD partitions can reduce benefit of scaling

Future Work • Study scaling effects given multiple
simultaneous workloads • Implement better support for scaling down • Enhance DEA to make use of resource
monitors and job runtime prediction

Backup

Delay Scheduling • Intended for fixed-size clusters running
multiple workloads with short tasks • Emphasis on scheduling task on nodes
containing data – Wait short time for resources to free up
on nodes containing data rather than run task on node available now but further away from data

Resource Managers + Auto-scaling • Resource management → different frameworks can coexist
→ high resource utilization • Facilitates on-demand resource allocation – support
elastic services
Infrastructure as a Service"
Resource Manager (YARN/Mesos)"

Brief Intro: YARN
• Resource Manager (RM) controls resource allocation • Application Master (AM) negotiates with RM for
resources and launch executors to run jobs

Brief Intro: Mesos • Framework schedulers accept or reject offered resource • Resource preferences are communicated to Mesos thru common APIs
• Coarse-grained mode – Mesos launches one long-running Spark
executor on each node to execute all Spark tasks
• Fine-grained mode – Mesos launches executor for each Spark
task

Runtime – Spark on Mesos Benchmark! Runtime (baseline)! Runtime (scale out)!
Fine-grained" KMeans" 92min 54sec" 35min 37sec"Page Rank" 19min 29sec" 16min 55 sec"
Spark SQL queries" 24min 45sec" 19min 7sec"LogisticRegression" 14min 43sec" 14min 39sec"
Coarse-grained" KMeans" 89min 24sec" 11min 49sec"Page Rank" 8min 29sec" 7min 41sec"
Spark SQL queries" 10min 32sec" 8min 30sec"LogisticRegression" 10min 57sec" 7min 56sec"


![Chapter 12 Static Equilibrium and Elasticity...1185 Chapter 12 Static Equilibrium and Elasticity Conceptual Problems 1 • [SSM] True or false: (a) G F ii ∑ =0 is sufficient for](https://img.pdfslide.net/doc/110x75/60cb9597eeb3a275f25b50f1/chapter-12-static-equilibrium-and-elasticity-1185-chapter-12-static-equilibrium.jpg)


![Topic 4 Elasticity - Trinity College, Dublin · PDF filePrice Elasticity of Demand ... Price Elasticity of Supply ... Microsoft PowerPoint - Topic 4 Elasticity [Compatibility Mode]](https://img.pdfslide.net/doc/110x75/5ab680a27f8b9a6e1c8dc1e4/topic-4-elasticity-trinity-college-dublin-elasticity-of-demand-price-elasticity.jpg)