Embed Size (px)
Citation preview
“Using Data Analytics to Discover the 100 Trillion Bacteria Living Within Each of Us”
Invited Talk
New Applications of Computer Analysis to Biomedical Data Sets
QB3 Seminar
San Francisco, CA
May 28, 2015
Dr. Larry Smarr
Director, California Institute for Telecommunications and Information Technology
Harry E. Gruber Professor,
Dept. of Computer Science and Engineering
Jacobs School of Engineering, UCSD
http://lsmarr.calit2.net1
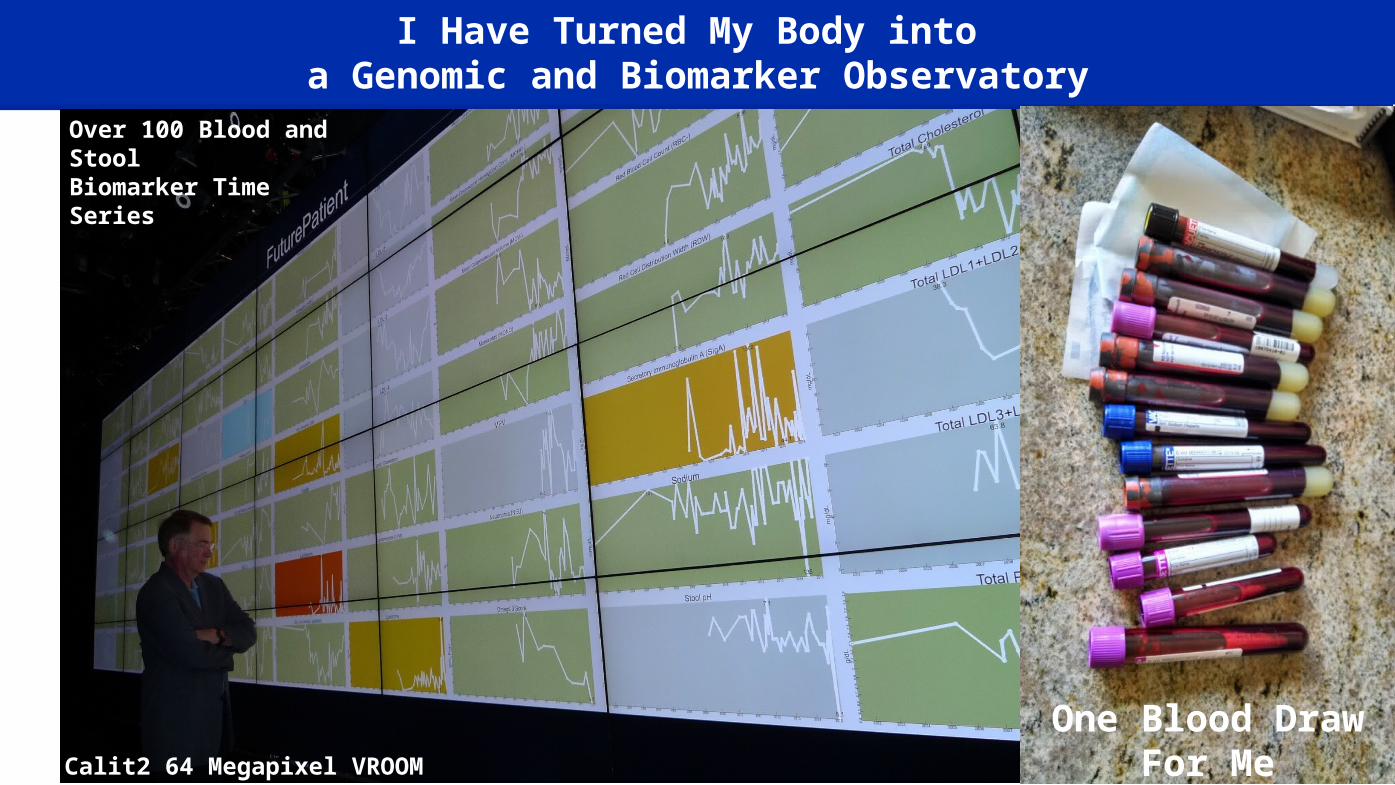
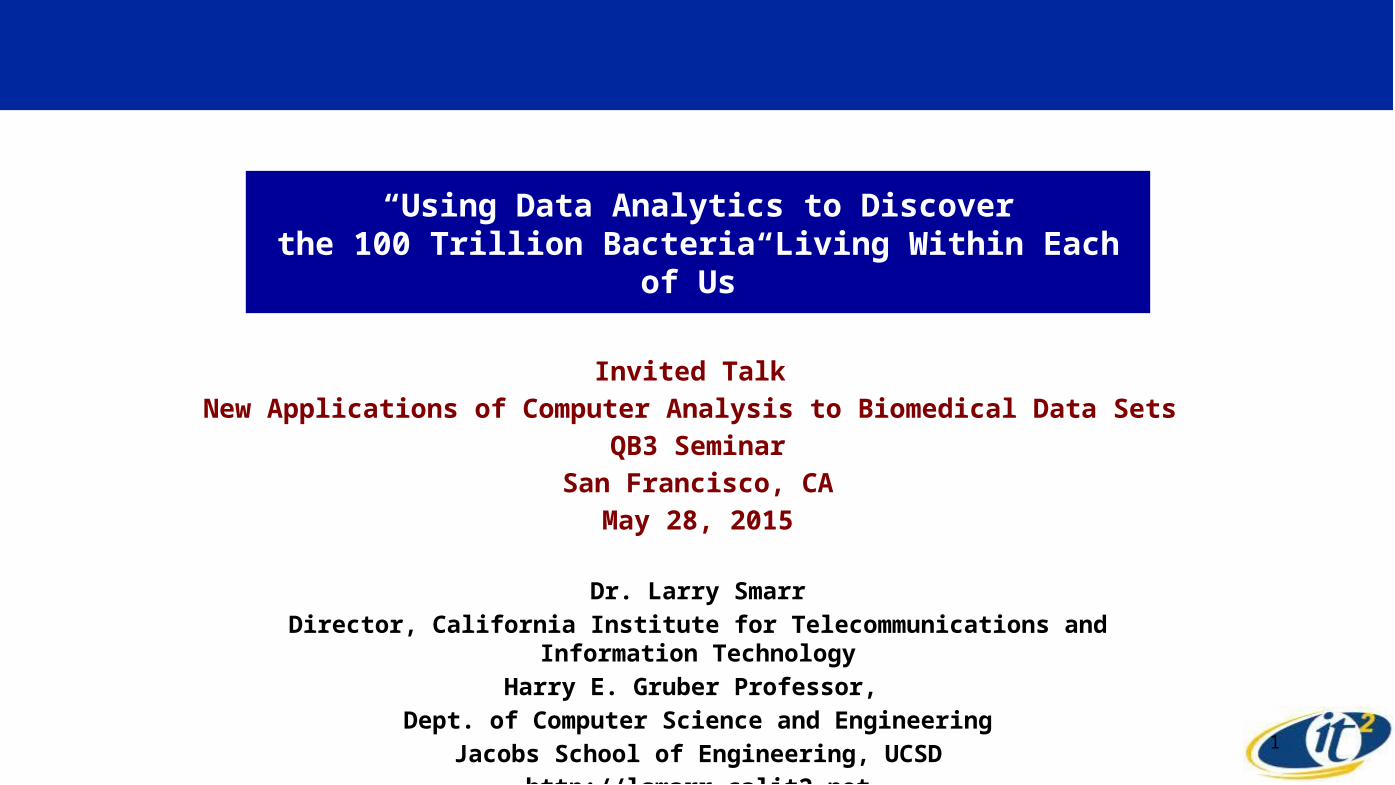
I Have Turned My Body into a Genomic and Biomarker Observatory
One Blood DrawFor MeCalit2 64 Megapixel VROOM
Over 100 Blood and Stool Biomarker Time Series
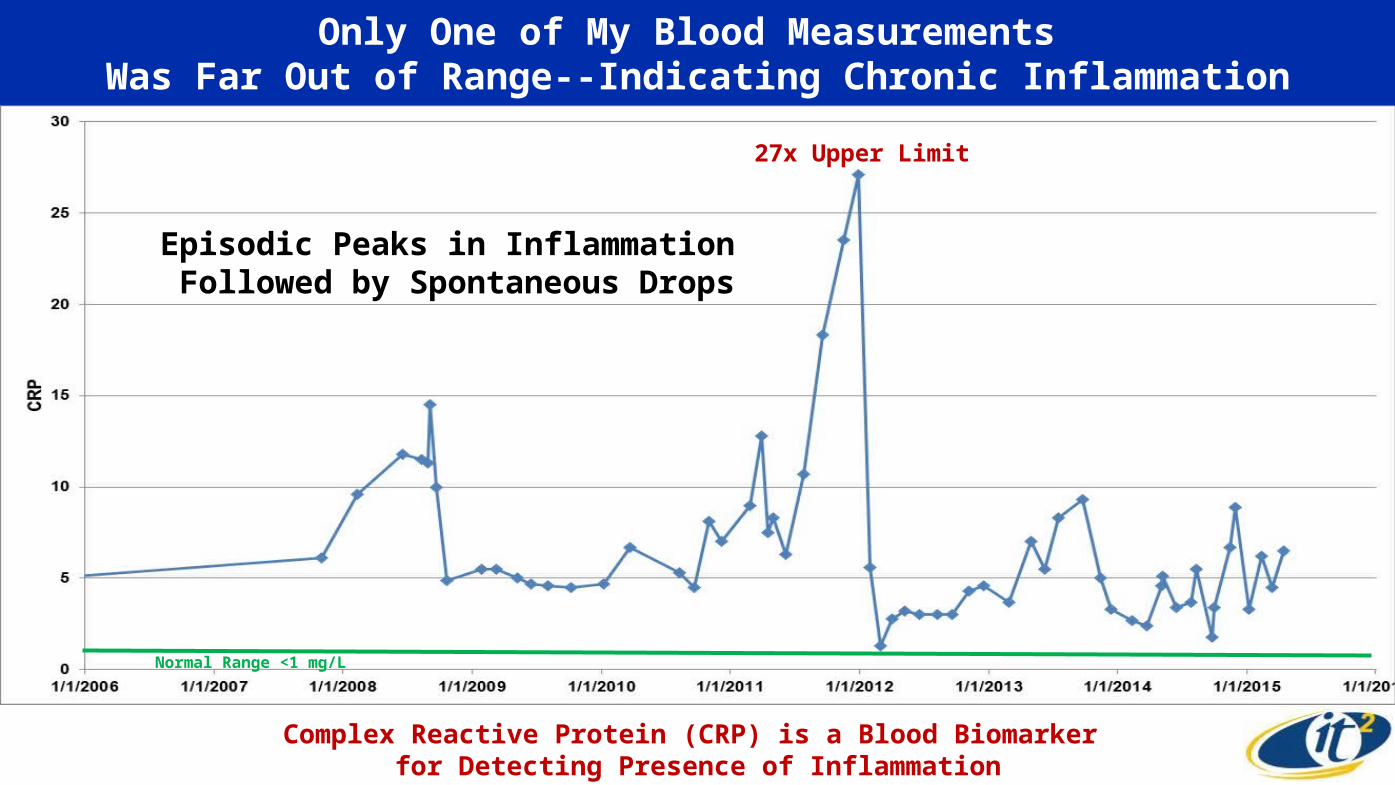
Only One of My Blood Measurements Was Far Out of Range--Indicating Chronic Inflammation
Normal Range <1 mg/L
27x Upper Limit
Complex Reactive Protein (CRP) is a Blood Biomarker for Detecting Presence of Inflammation
Episodic Peaks in Inflammation Followed by Spontaneous Drops
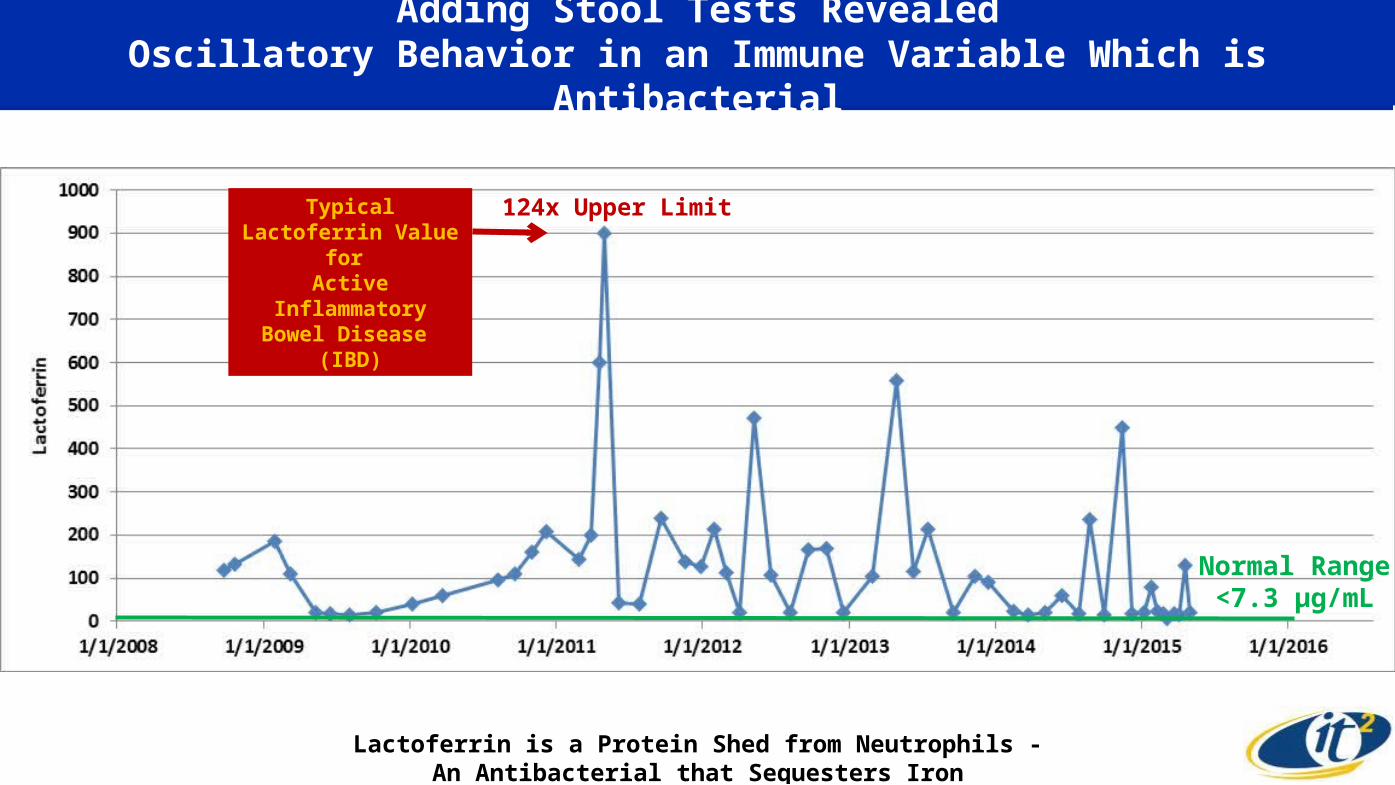
Adding Stool Tests RevealedOscillatory Behavior in an Immune Variable Which is Antibacterial
Normal Range<7.3 µg/mL
124x Upper Limit
Lactoferrin is a Protein Shed from Neutrophils -An Antibacterial that Sequesters Iron
TypicalLactoferrin Value for Active Inflammatory
Bowel Disease (IBD)
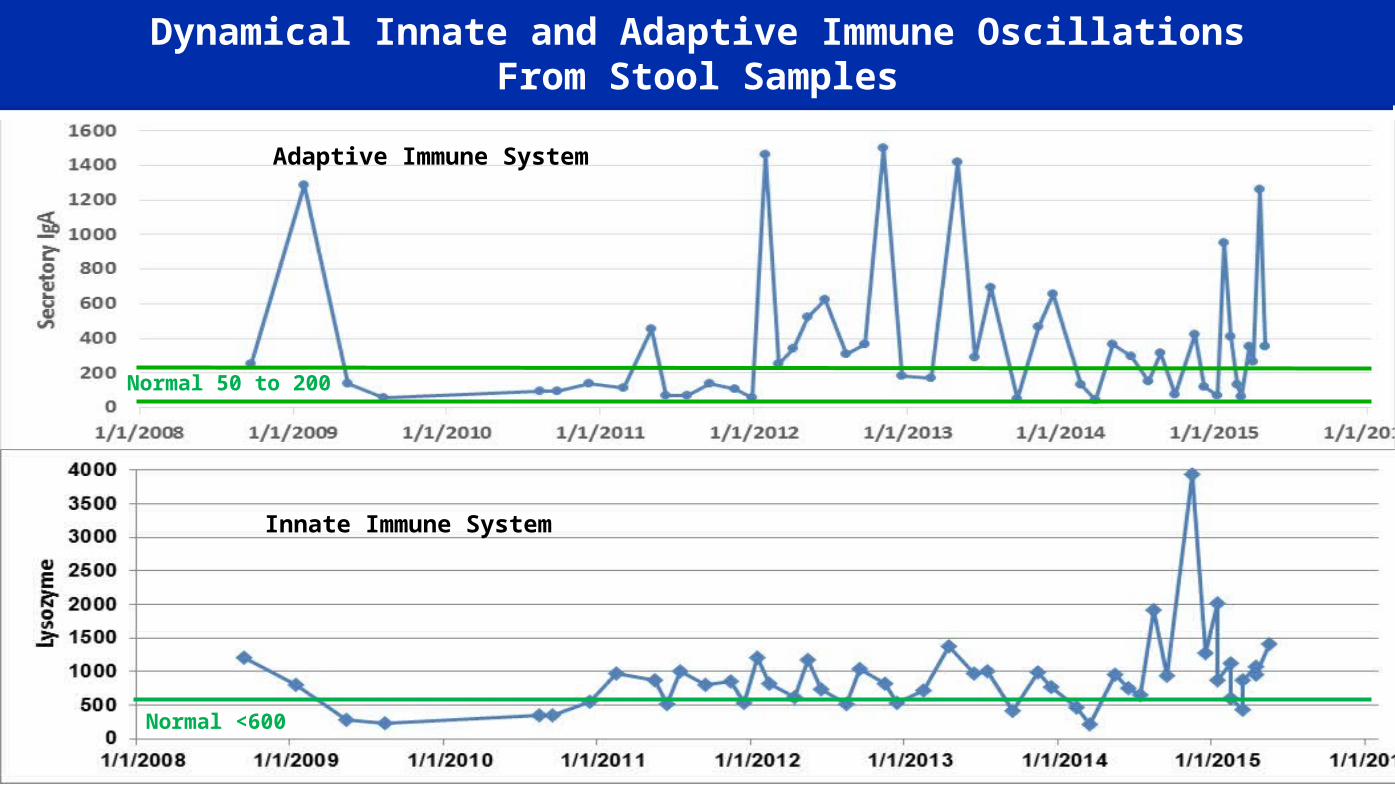
Dynamical Innate and Adaptive Immune OscillationsFrom Stool Samples
Normal <600
Innate Immune System
Normal 50 to 200
Adaptive Immune System
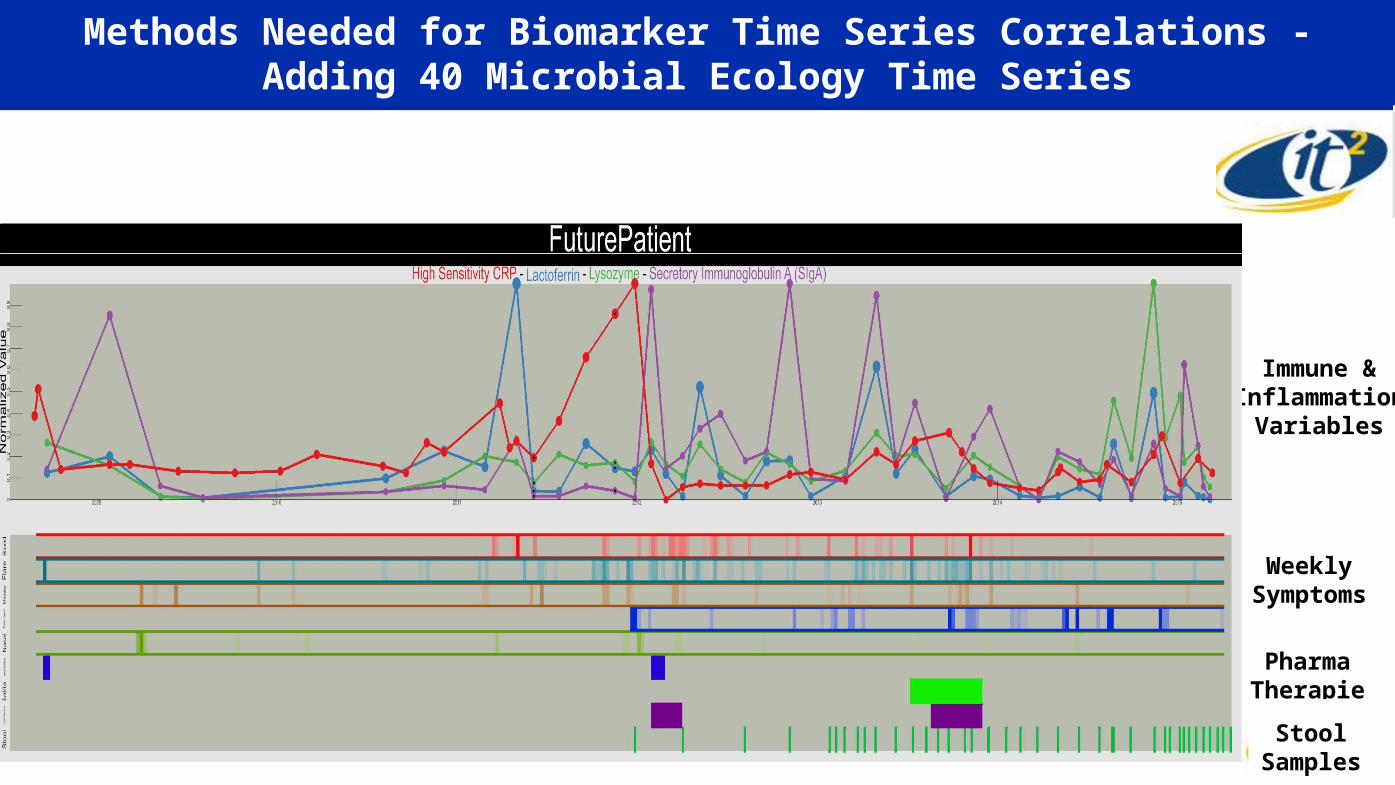
Methods Needed for Biomarker Time Series Correlations -Adding 40 Microbial Ecology Time Series
Immune &Inflammation
Variables
Weekly Symptoms
PharmaTherapies
StoolSamples
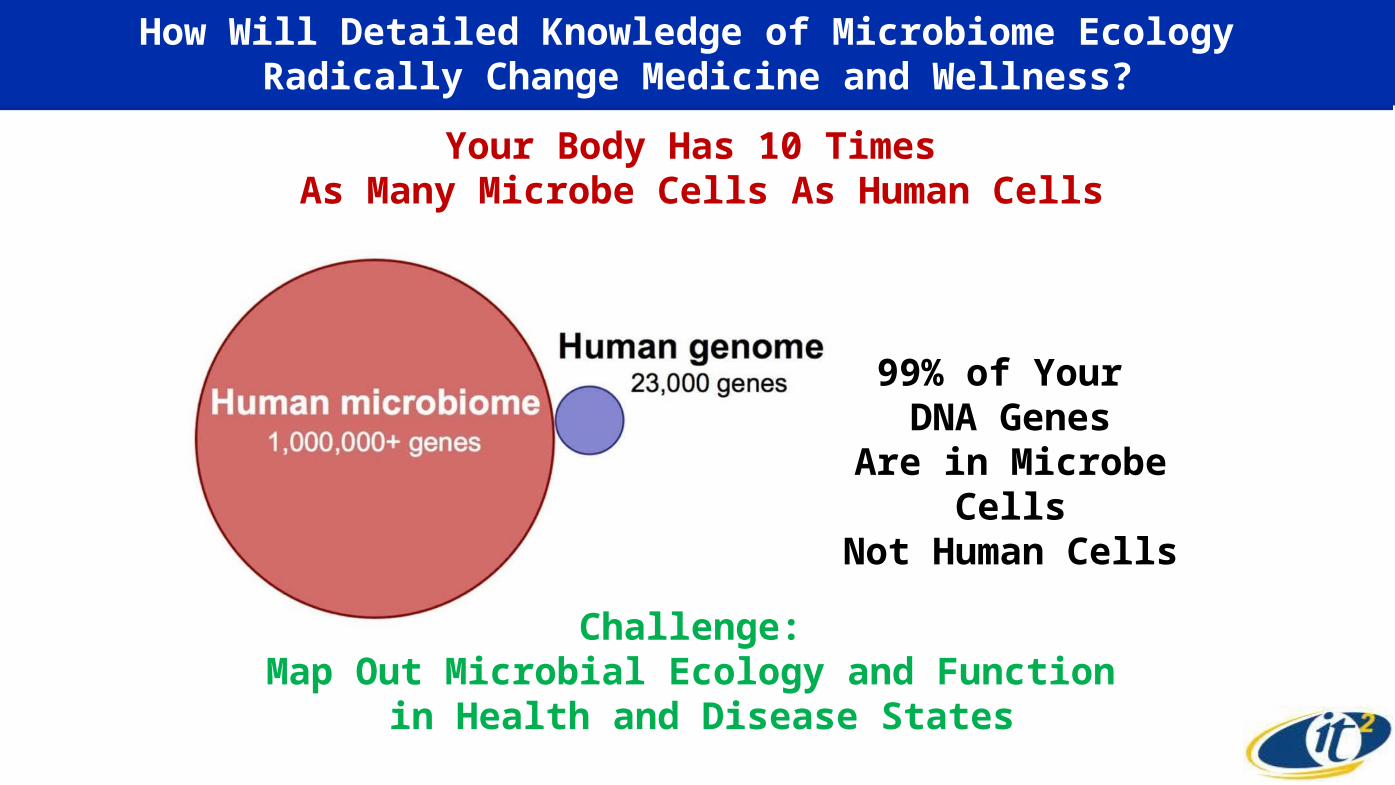
How Will Detailed Knowledge of Microbiome Ecology Radically Change Medicine and Wellness?
99% of Your DNA Genes
Are in Microbe CellsNot Human Cells
Your Body Has 10 Times As Many Microbe Cells As Human Cells
Challenge: Map Out Microbial Ecology and Function
in Health and Disease States
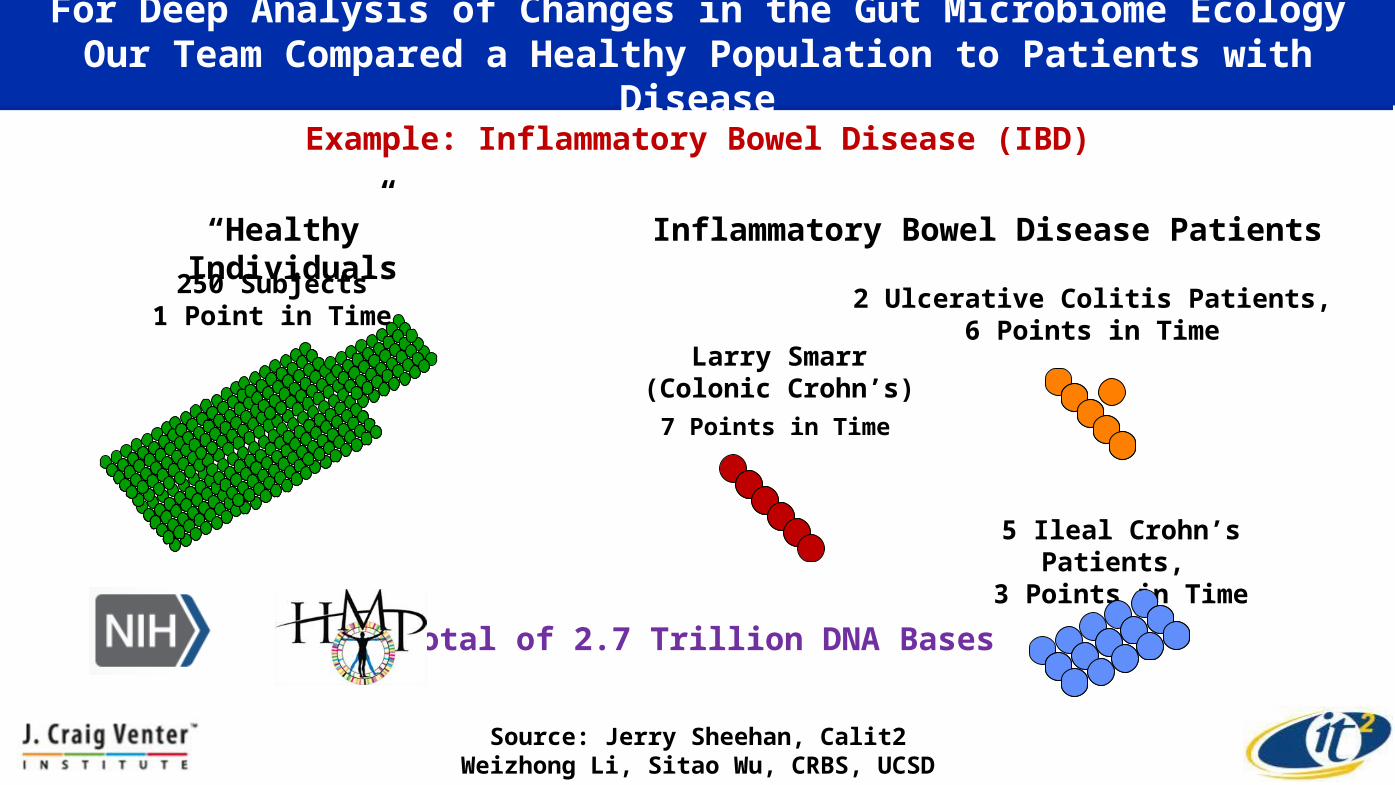
For Deep Analysis of Changes in the Gut Microbiome EcologyOur Team Compared a Healthy Population to Patients with Disease
5 Ileal Crohn’s Patients, 3 Points in Time
2 Ulcerative Colitis Patients, 6 Points in Time
“Healthy” Individuals
Source: Jerry Sheehan, Calit2Weizhong Li, Sitao Wu, CRBS, UCSD
Total of 2.7 Trillion DNA Bases
Inflammatory Bowel Disease Patients
250 Subjects1 Point in Time
7 Points in Time
Larry Smarr(Colonic Crohn’s)
Example: Inflammatory Bowel Disease (IBD)
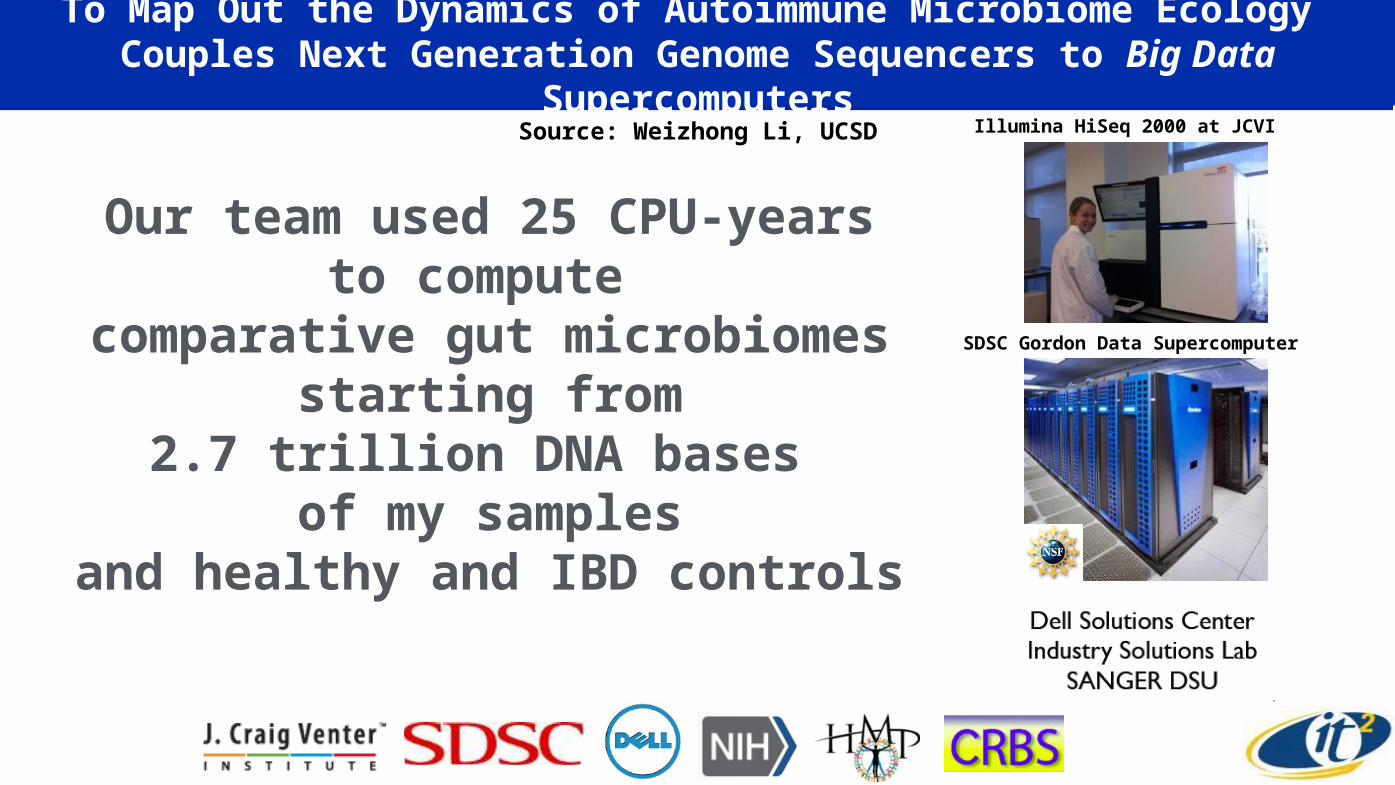
To Map Out the Dynamics of Autoimmune Microbiome Ecology Couples Next Generation Genome Sequencers to Big Data Supercomputers
Source: Weizhong Li, UCSD
Our team used 25 CPU-yearsto compute
comparative gut microbiomesstarting from
2.7 trillion DNA bases of my samples
and healthy and IBD controls
Illumina HiSeq 2000 at JCVI
SDSC Gordon Data Supercomputer
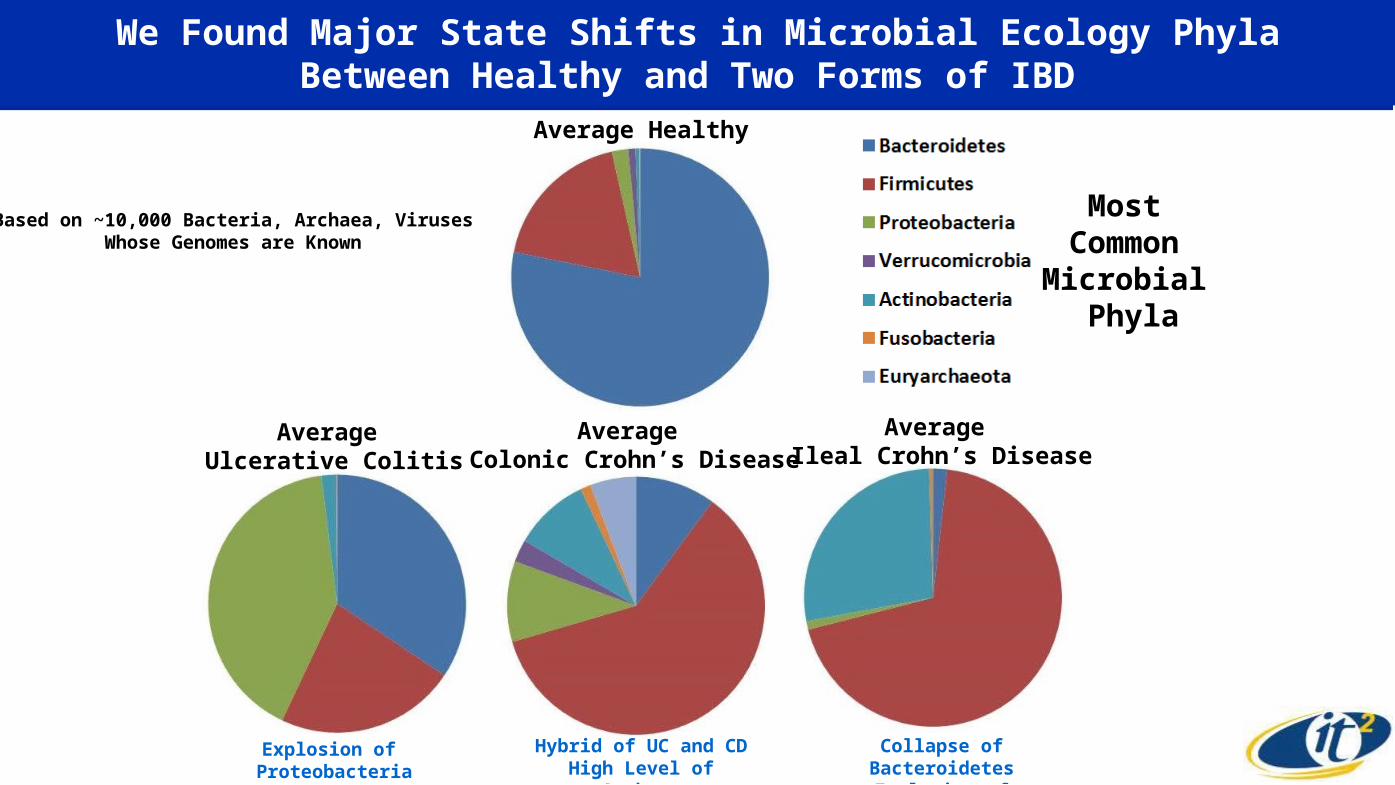
We Found Major State Shifts in Microbial Ecology PhylaBetween Healthy and Two Forms of IBD
Most Common Microbial
Phyla
Average Healthy
Average Ulcerative Colitis
Average Colonic Crohn’s Disease
Average Ileal Crohn’s Disease
Collapse of BacteroidetesExplosion of Actinobacteria
Explosion of Proteobacteria
Hybrid of UC and CDHigh Level of Archaea
Based on ~10,000 Bacteria, Archaea, VirusesWhose Genomes are Known
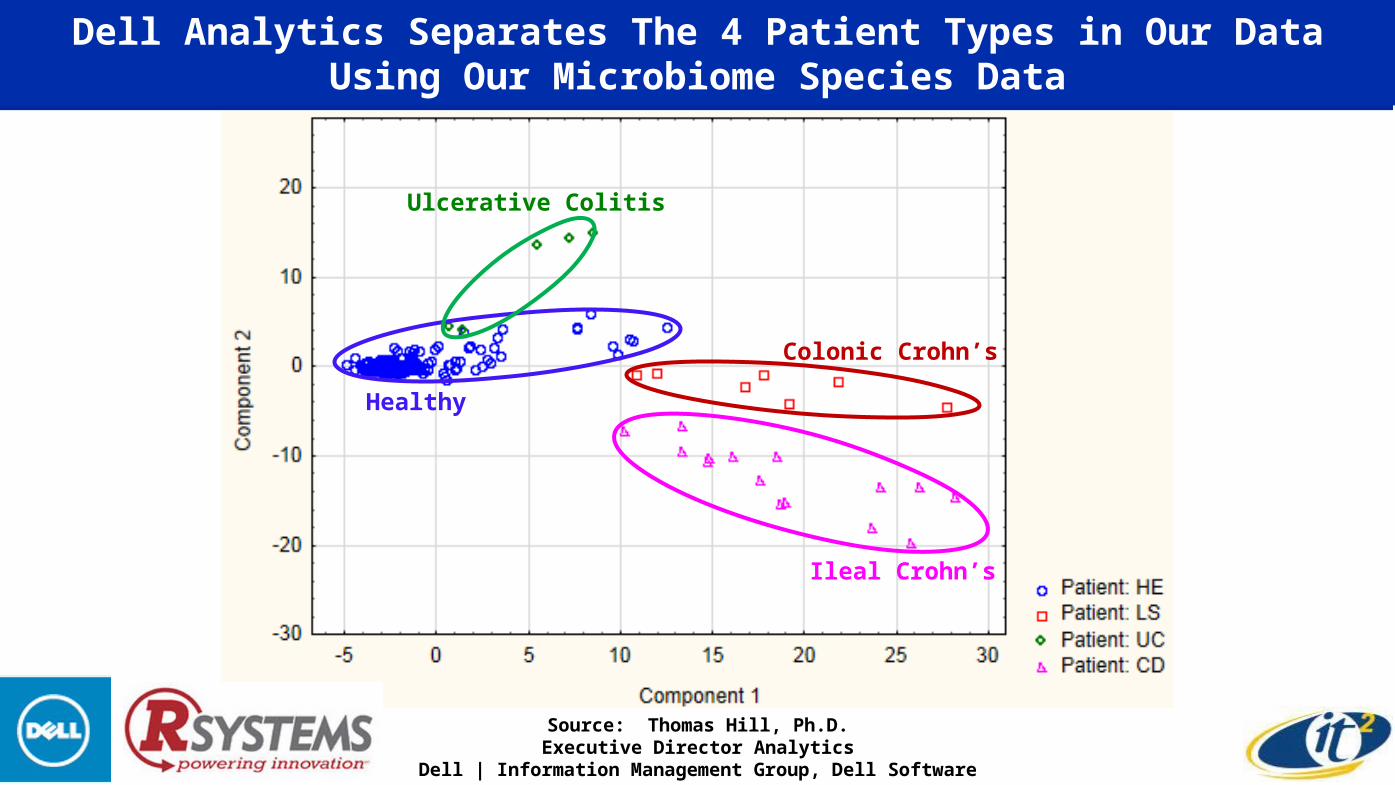
Dell Analytics Separates The 4 Patient Types in Our DataUsing Our Microbiome Species Data
Source: Thomas Hill, Ph.D.Executive Director Analytics
Dell | Information Management Group, Dell Software
Healthy
Ulcerative Colitis
Colonic Crohn’s
Ileal Crohn’s
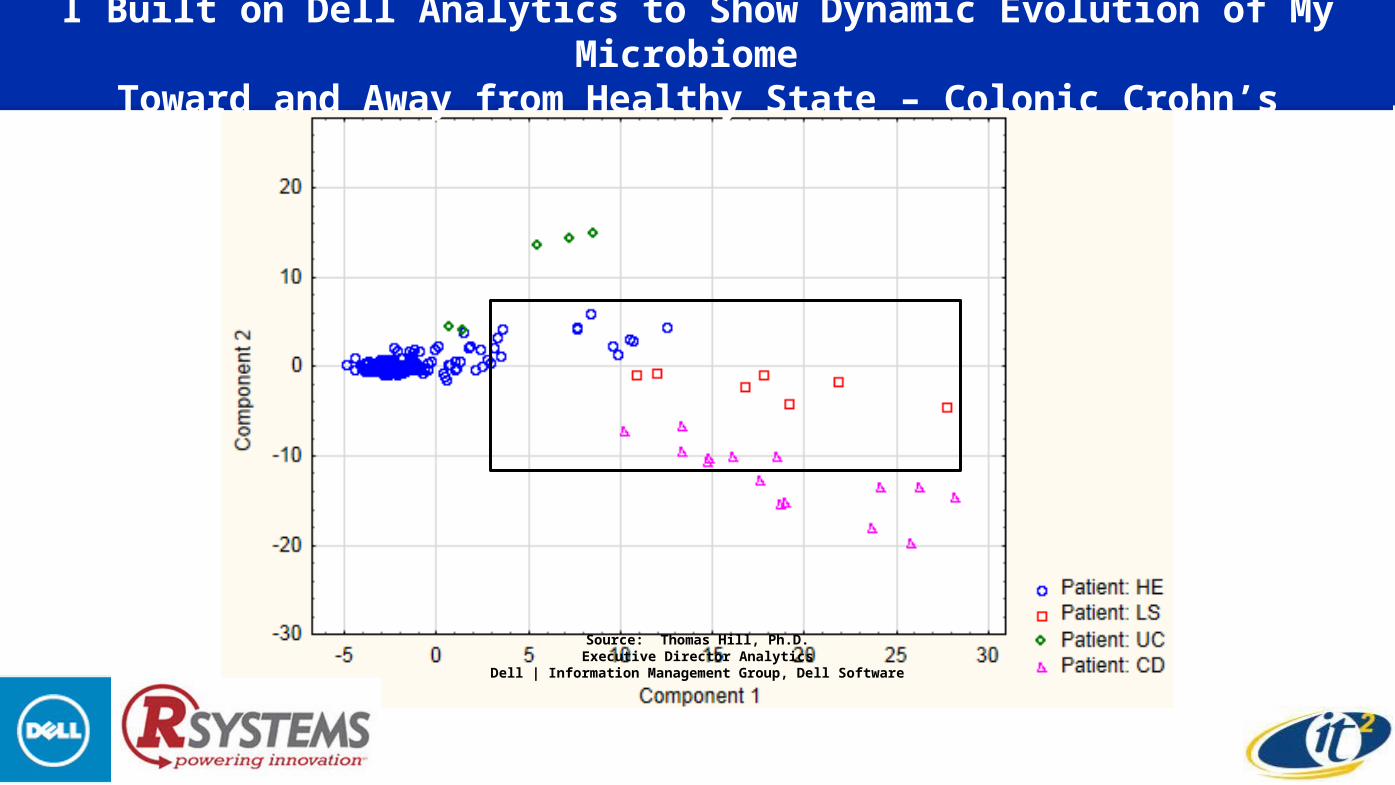
I Built on Dell Analytics to Show Dynamic Evolution of My Microbiome Toward and Away from Healthy State – Colonic Crohn’s
Source: Thomas Hill, Ph.D.Executive Director Analytics
Dell | Information Management Group, Dell Software
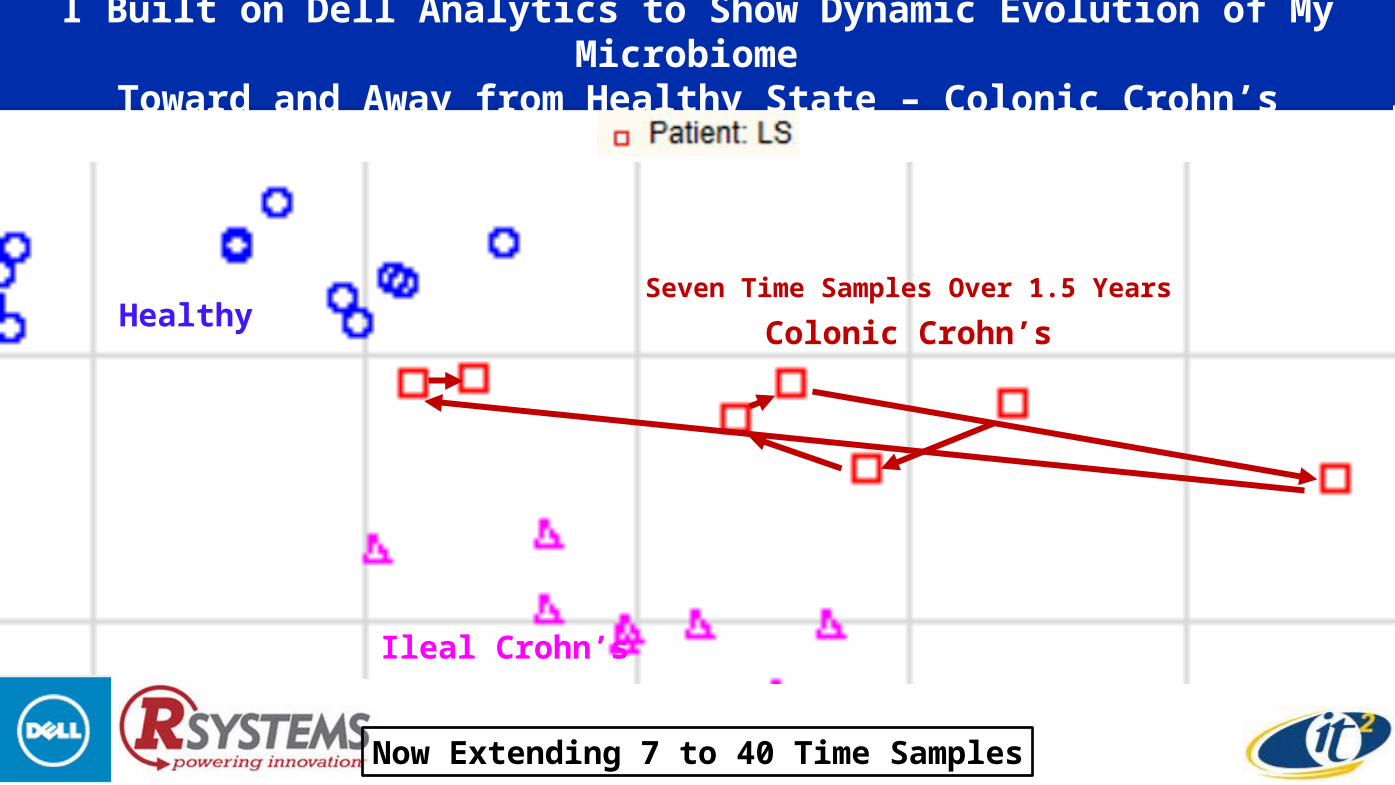
I Built on Dell Analytics to Show Dynamic Evolution of My Microbiome Toward and Away from Healthy State – Colonic Crohn’s
Healthy
Ileal Crohn’s
Seven Time Samples Over 1.5 Years
Colonic Crohn’s
Now Extending 7 to 40 Time Samples
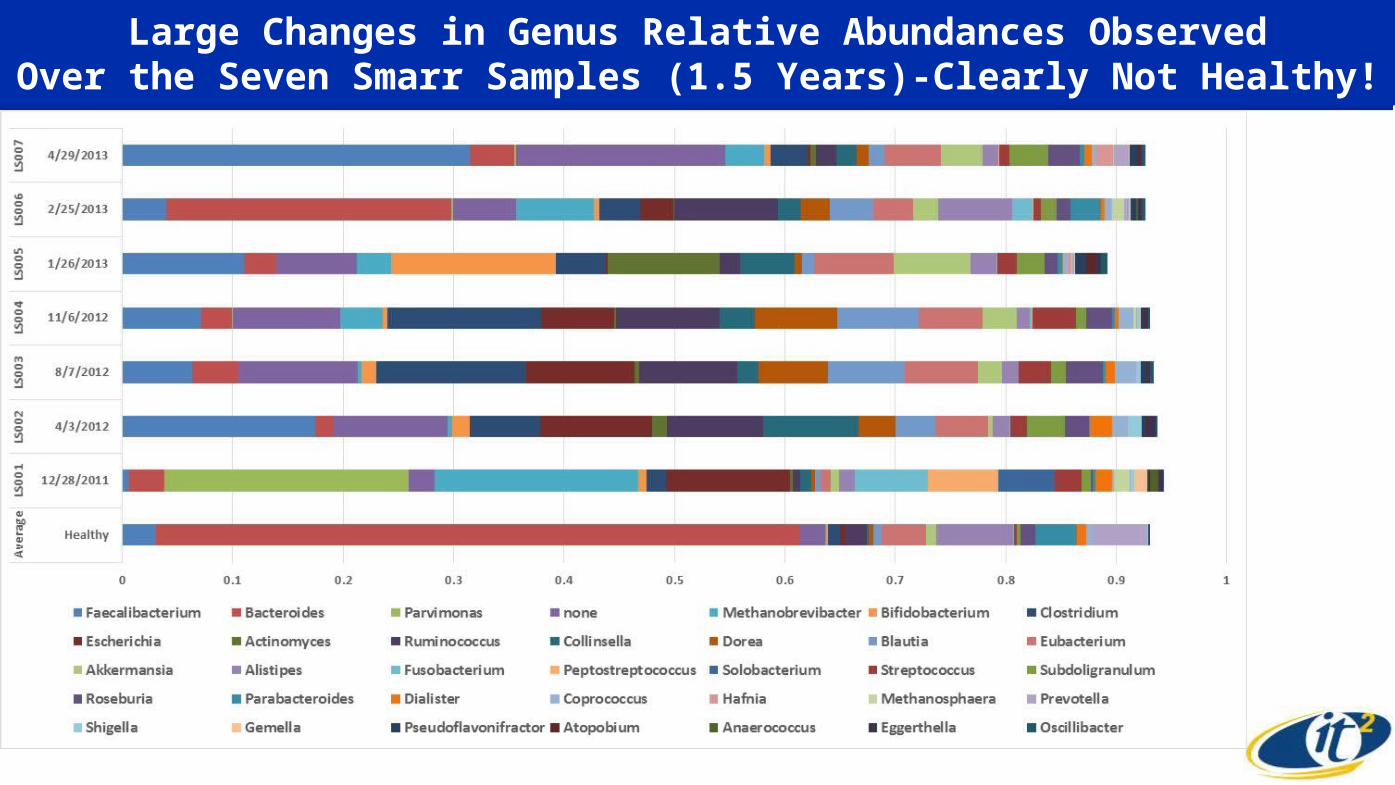
Large Changes in Genus Relative Abundances ObservedOver the Seven Smarr Samples (1.5 Years)-Clearly Not Healthy!
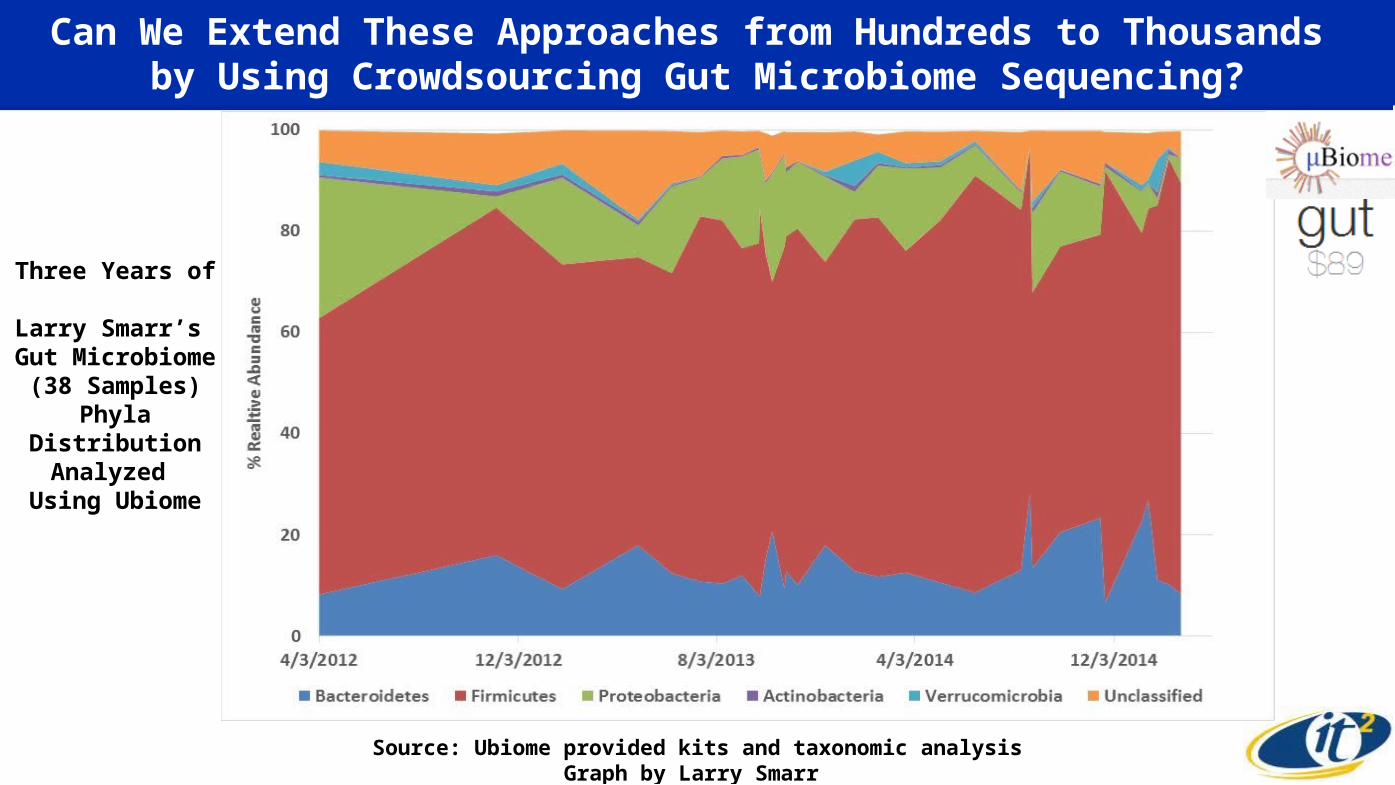
Can We Extend These Approaches from Hundreds to Thousands by Using Crowdsourcing Gut Microbiome Sequencing?
Source: Ubiome provided kits and taxonomic analysisGraph by Larry Smarr
Three Years of Larry Smarr’s
Gut Microbiome(38 Samples)
Phyla Distribution Analyzed
Using Ubiome
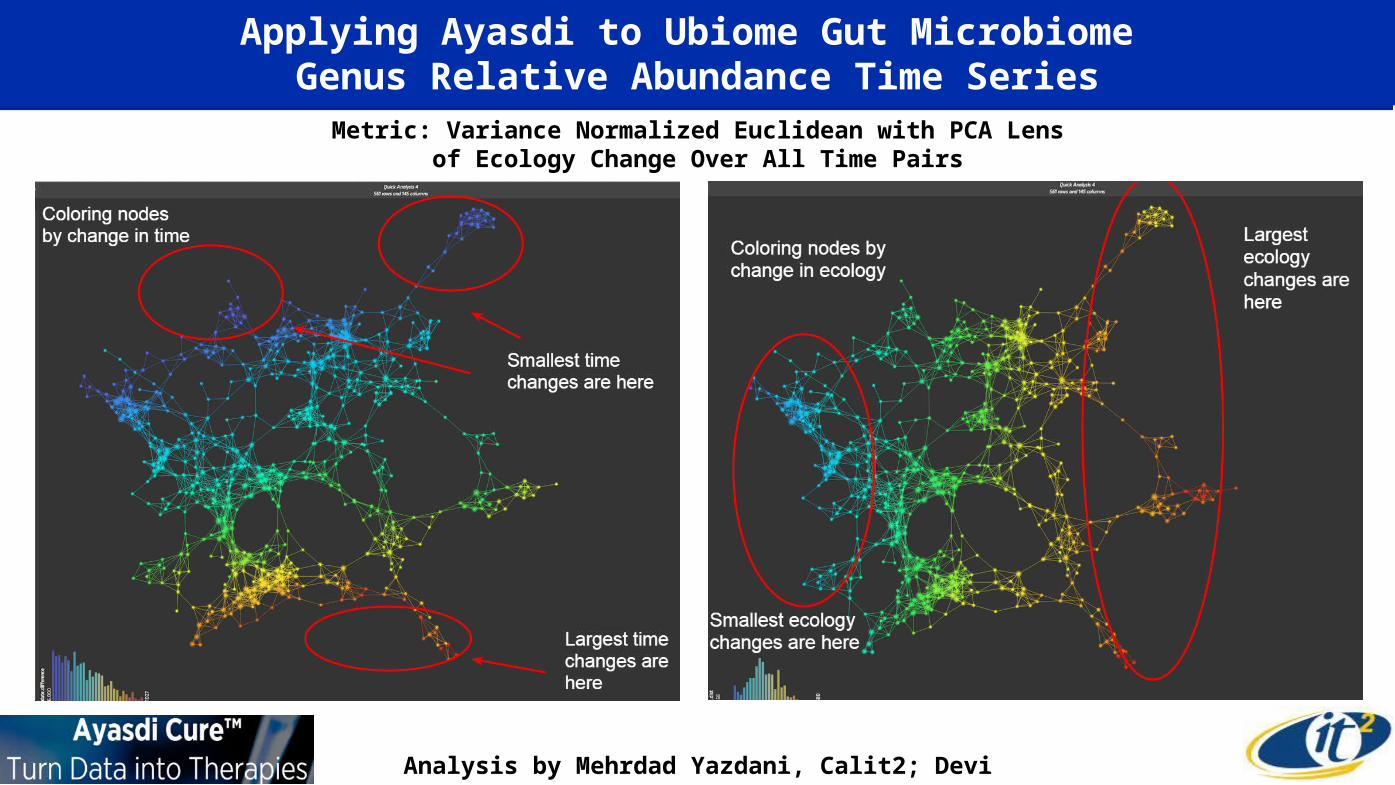
Applying Ayasdi to Ubiome Gut Microbiome Genus Relative Abundance Time Series
Analysis by Mehrdad Yazdani, Calit2; Devi Ramanan, Ubiome
Metric: Variance Normalized Euclidean with PCA Lensof Ecology Change Over All Time Pairs
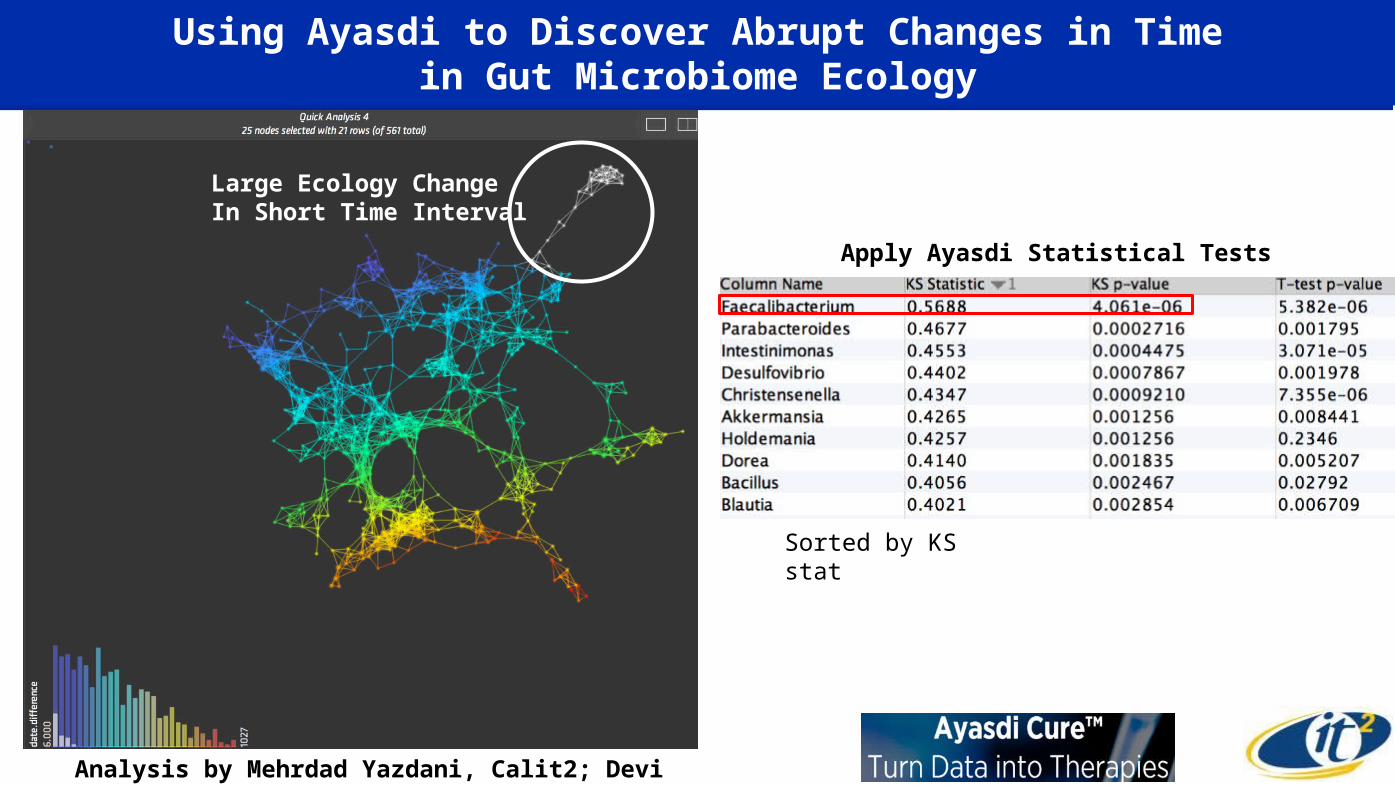
Sorted by KS stat
Apply Ayasdi Statistical Tests
Using Ayasdi to Discover Abrupt Changes in Timein Gut Microbiome Ecology
Large Ecology ChangeIn Short Time Interval
Analysis by Mehrdad Yazdani, Calit2; Devi Ramanan, Ubiome
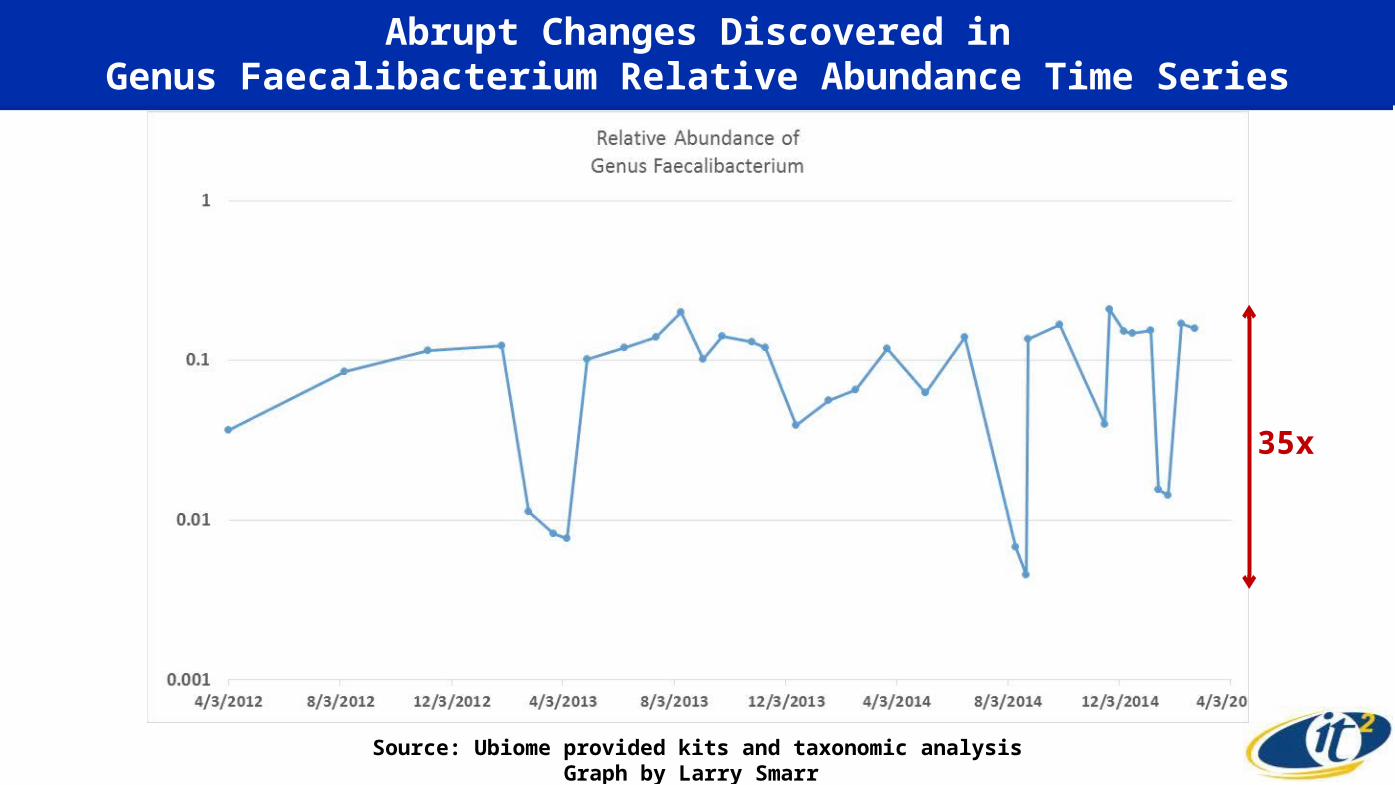
Abrupt Changes Discovered inGenus Faecalibacterium Relative Abundance Time Series
Source: Ubiome provided kits and taxonomic analysisGraph by Larry Smarr
35x

Genetic Sequencing of Humans and Their MicrobesIs a Huge Growth Area and the Future Foundation of Medicine
Source: @EricTopolTwitter 9/27/2014
Thanks to Our Great Team!
UCSD Metagenomics TeamWeizhong LiSitao Wu
Calit2@UCSD Future Patient TeamJerry SheehanTom DeFantiKevin PatrickJurgen SchulzeAndrew PrudhommePhilip WeberFred RaabJoe KeefeErnesto Ramirez
JCVI TeamKaren NelsonShibu YoosephManolito Torralba
SDSC TeamMichael NormanIlkay AltintasShweta PurawatMahidhar Tatineni Robert Sinkovits
UCSD Health Sciences TeamWilliam J. SandbornElisabeth EvansJohn ChangBrigid BolandDavid Brenner
Dell/R Systems and Dell AnalyticsBrian KucicJohn ThompsonTom Hill