Embed Size (px)
Citation preview
Scaling SparkR in Production.Lessons from the Field.
Heiko KorndorfWireframe, CEO & Founder
About meHeiko Korndorf• CEO & Founder Wireframe• MS in Computer Science• Application Areas: ERP, CRM, BI, EAI• Helping companies in
• Manufacturing• Telecommunications• Financial Services• Utilities• Oil & Gas• Professional Services
Rapid Application Developmentfor Hadoop/Spark
Data Science-as-a-Service
What we’ll talk aboutClassify this talk ….
• Data Science: Scaling your R application with SparkR
• Data Engineering: How to bring Data Science applications into your production pipelines, i.e. adding R to your toolset.
• Management: Integrating Data Science and Data Engineering withSparkR
Agenda• SparkR Architecture 1.x/2.x• Reference Projects I + II• Approach with Spark 1.5/1.6
• Parallelization via YARN• Dynamic R Deployment, incl. dependencies/packages
• Approach with Spark 2.0• Parallelization via SparkR• R-Graphics: headless environment, concurrency• Use Spark APIs: SQL, Mllib• On-Prem vs Cloud (Elasticity/decouple storage and compute)
• Integrating Data Science and Data Engineering• A Broader Look at the Ecosystem• Outlook and Next Steps
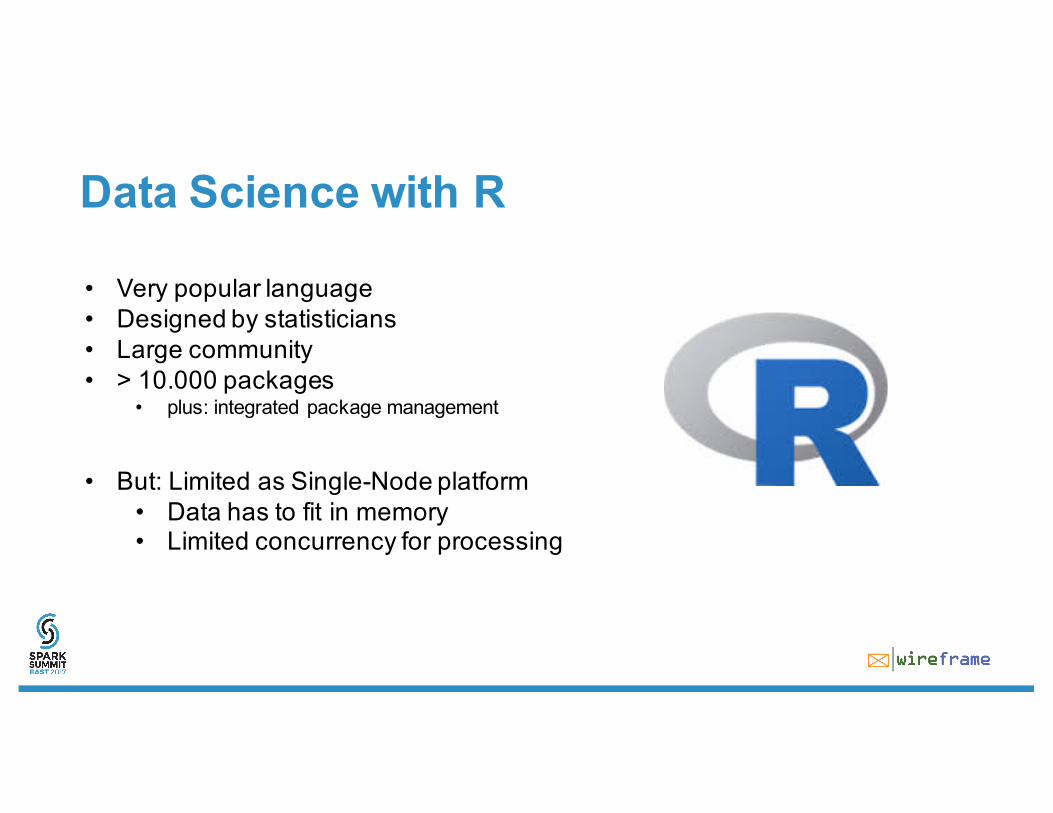
Data Science with R
• Very popular language• Designed by statisticians• Large community• > 10.000 packages
• plus: integrated package management
• But: Limited as Single-Node platform• Data has to fit in memory• Limited concurrency for processing
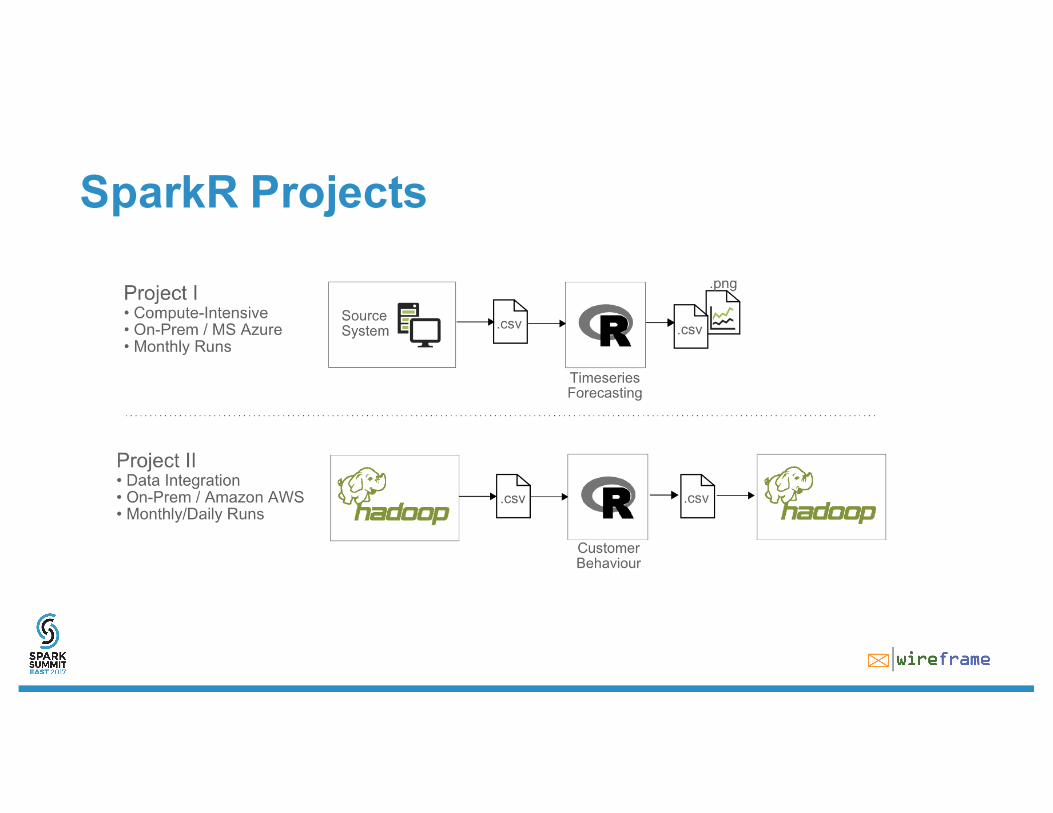
SparkR Projects
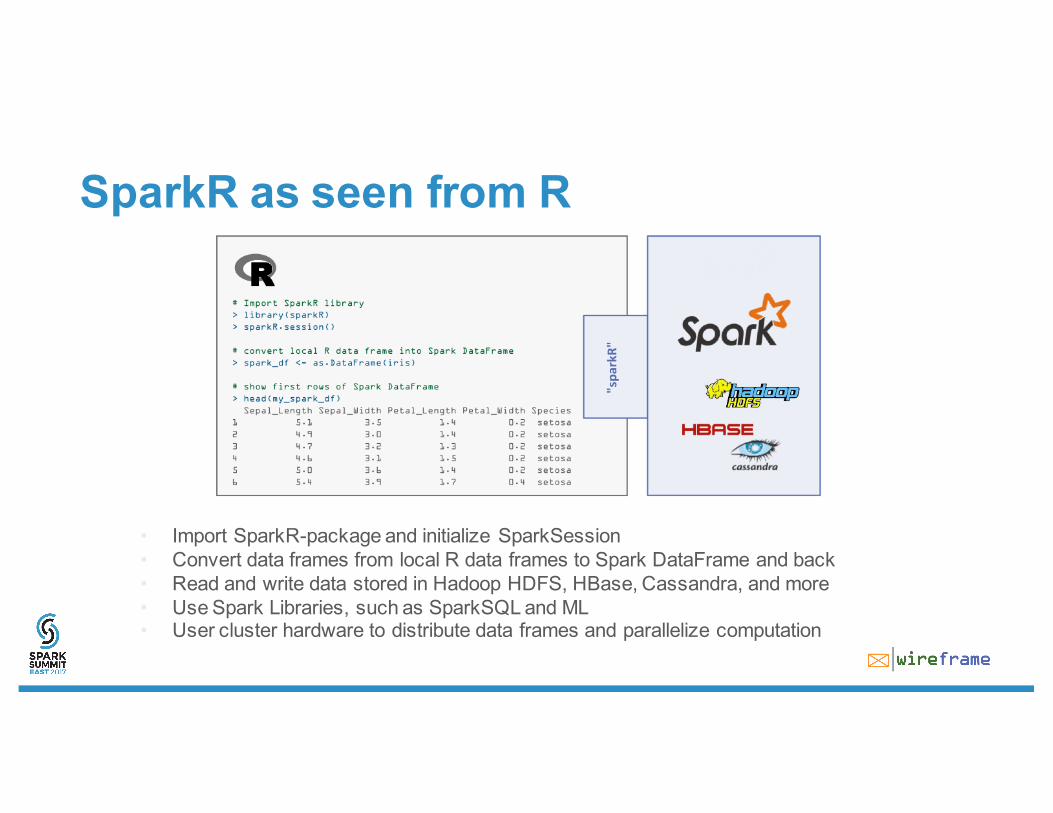
SparkR as seen from R
• Import SparkR-package and initialize SparkSession• Convert data frames from local R data frames to Spark DataFrame and back• Read and write data stored in Hadoop HDFS, HBase, Cassandra, and more• Use Spark Libraries, such as SparkSQL and ML• User cluster hardware to distribute data frames and parallelize computation
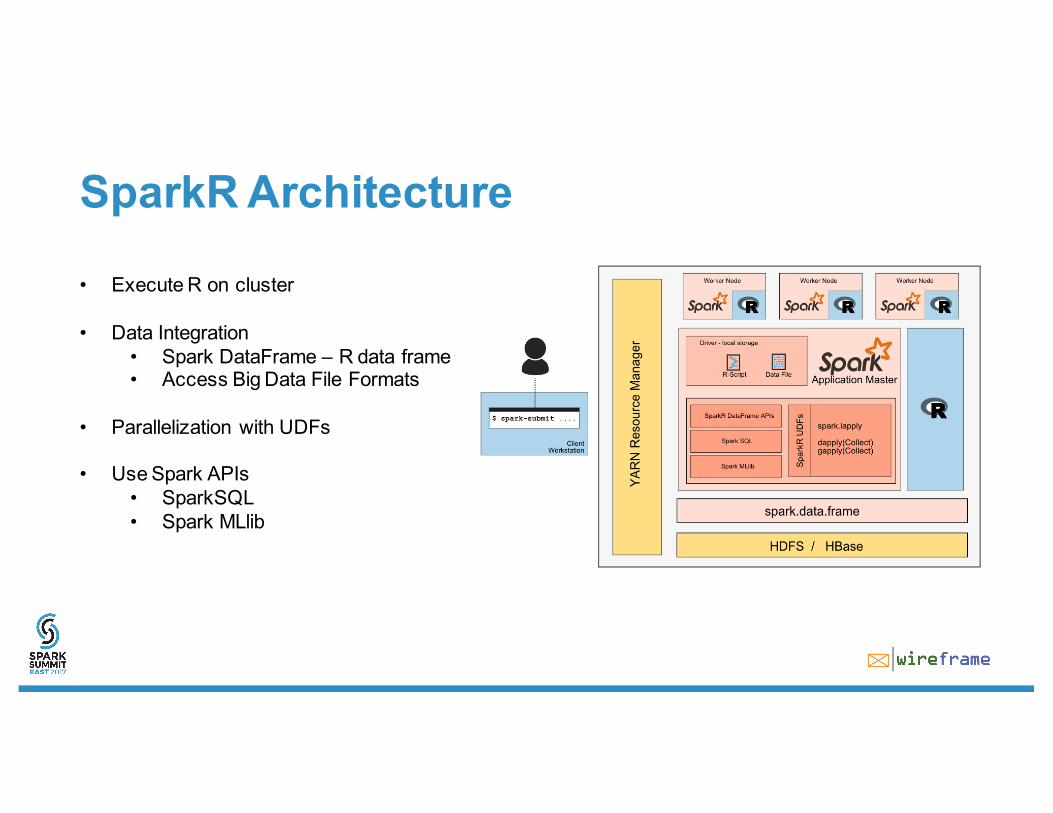
SparkR Architecture
• Execute R on cluster
• Data Integration• Spark DataFrame – R data frame• Access Big Data File Formats
• Parallelization with UDFs
• Use Spark APIs• SparkSQL• Spark MLlib
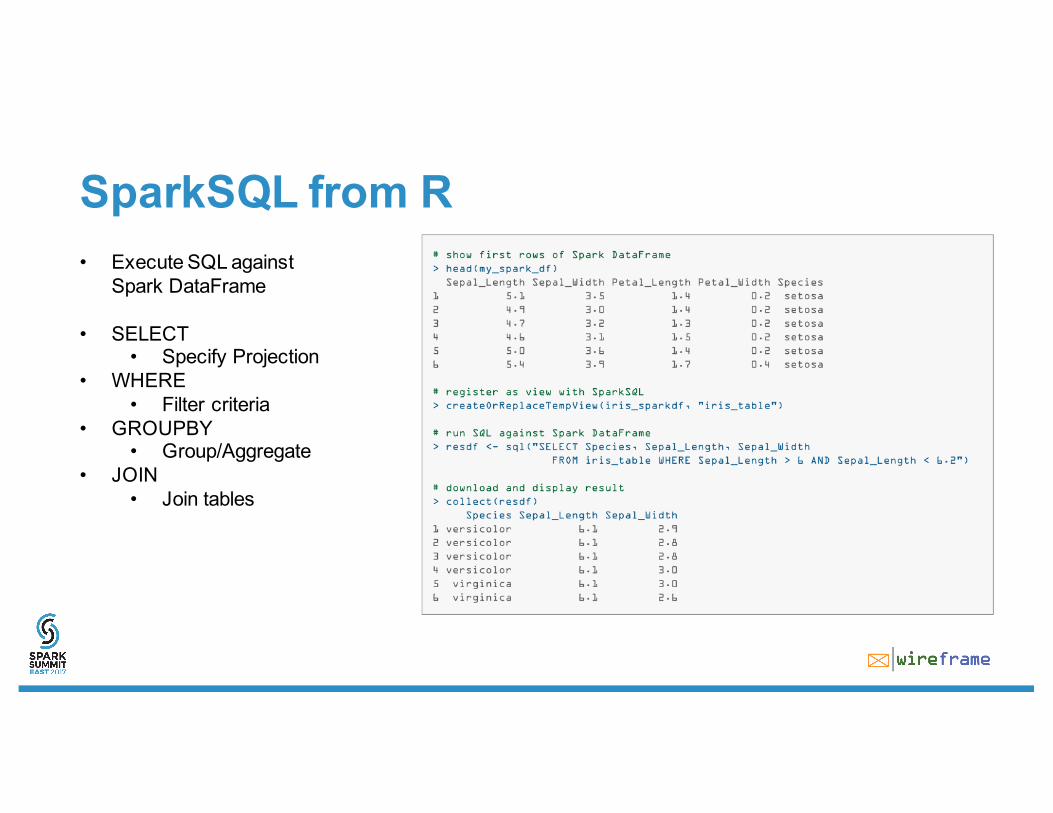
SparkSQL from R• Execute SQL against
Spark DataFrame
• SELECT• Specify Projection
• WHERE• Filter criteria
• GROUPBY• Group/Aggregate
• JOIN• Join tables
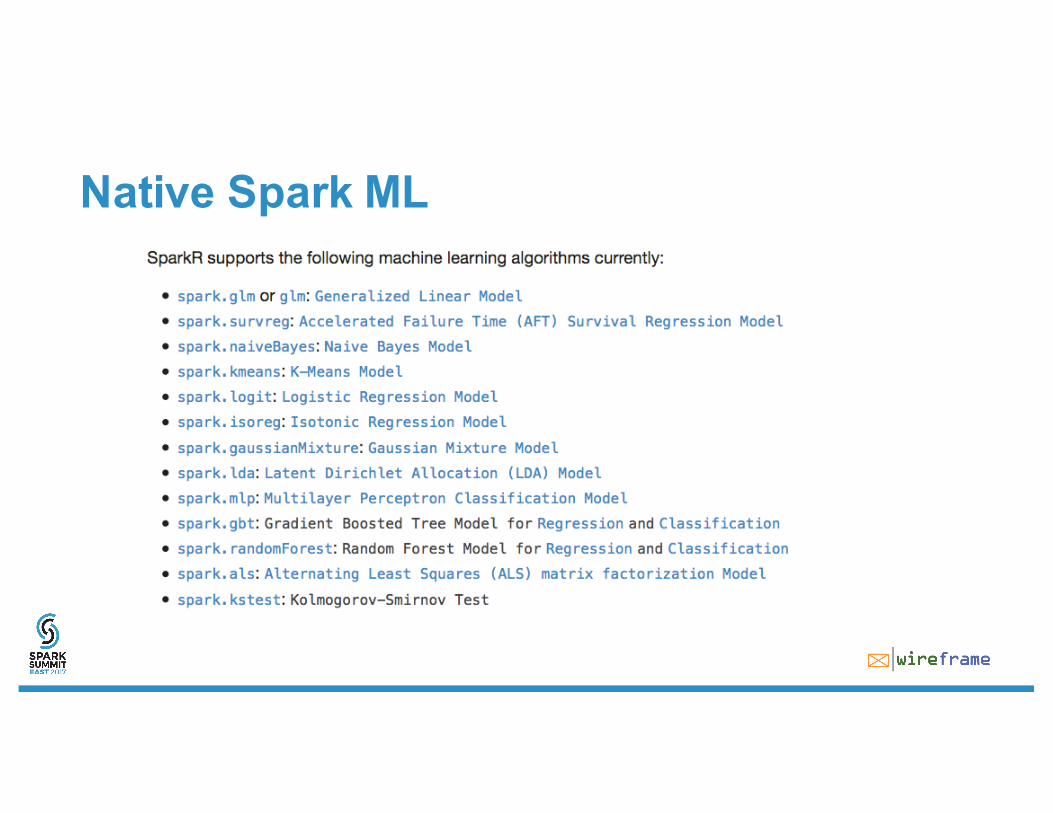
Native Spark ML
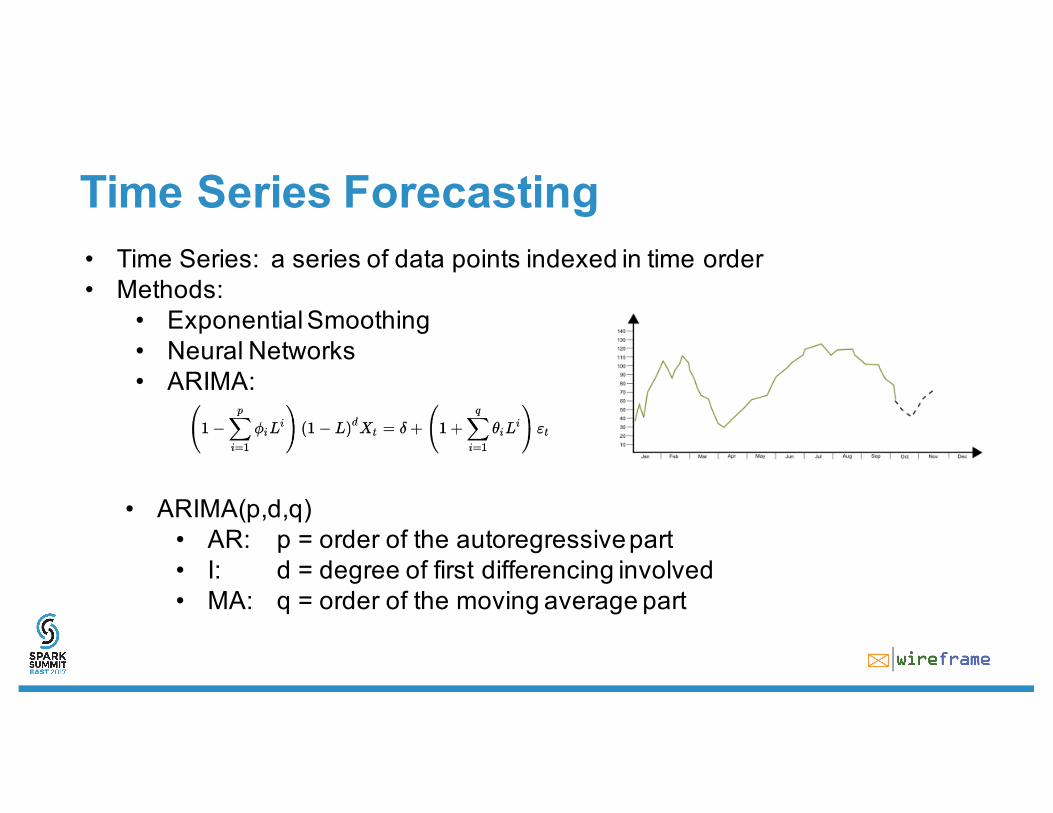
Time Series Forecasting
• ARIMA(p,d,q)• AR: p = order of the autoregressive part• I: d = degree of first differencing involved• MA: q = order of the moving average part
• Time Series: a series of data points indexed in time order• Methods:
• Exponential Smoothing• Neural Networks• ARIMA:
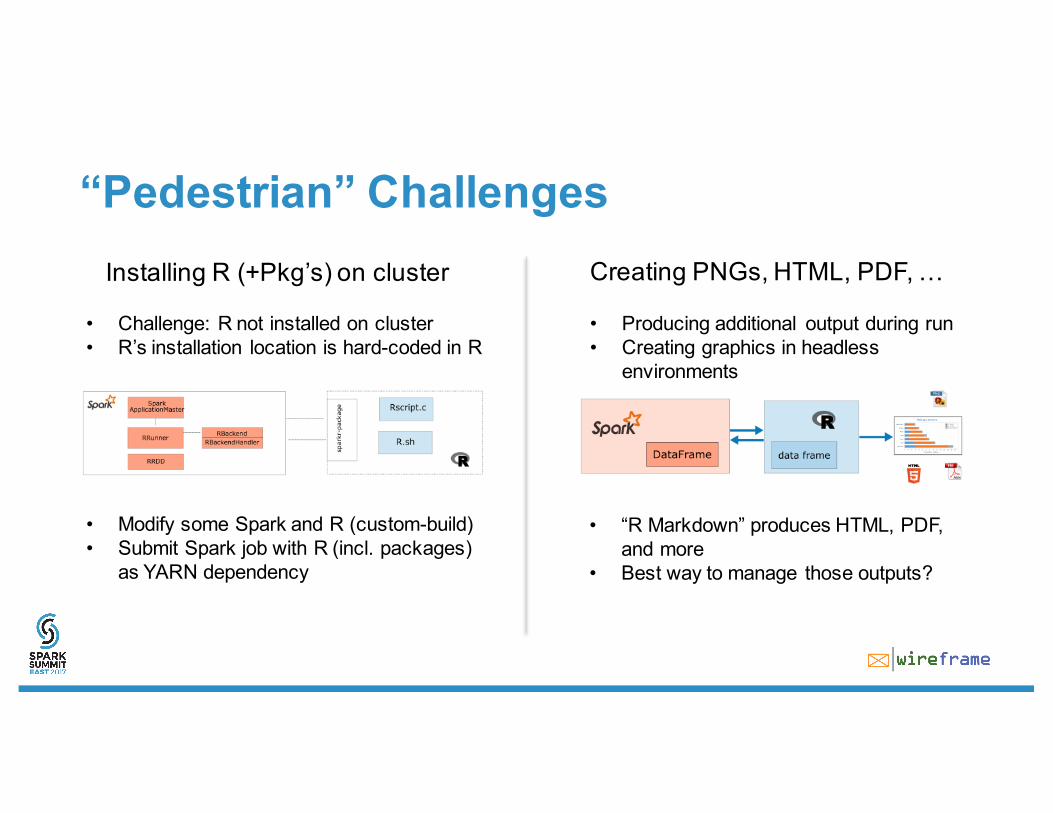
“Pedestrian” Challenges
• Modify some Spark and R (custom-build)• Submit Spark job with R (incl. packages)
as YARN dependency
• Challenge: R not installed on cluster• R’s installation location is hard-coded in R
• “R Markdown” produces HTML, PDF, and more
• Best way to manage those outputs?
• Producing additional output during run• Creating graphics in headless
environments
Installing R (+Pkg’s) on cluster Creating PNGs, HTML, PDF, …
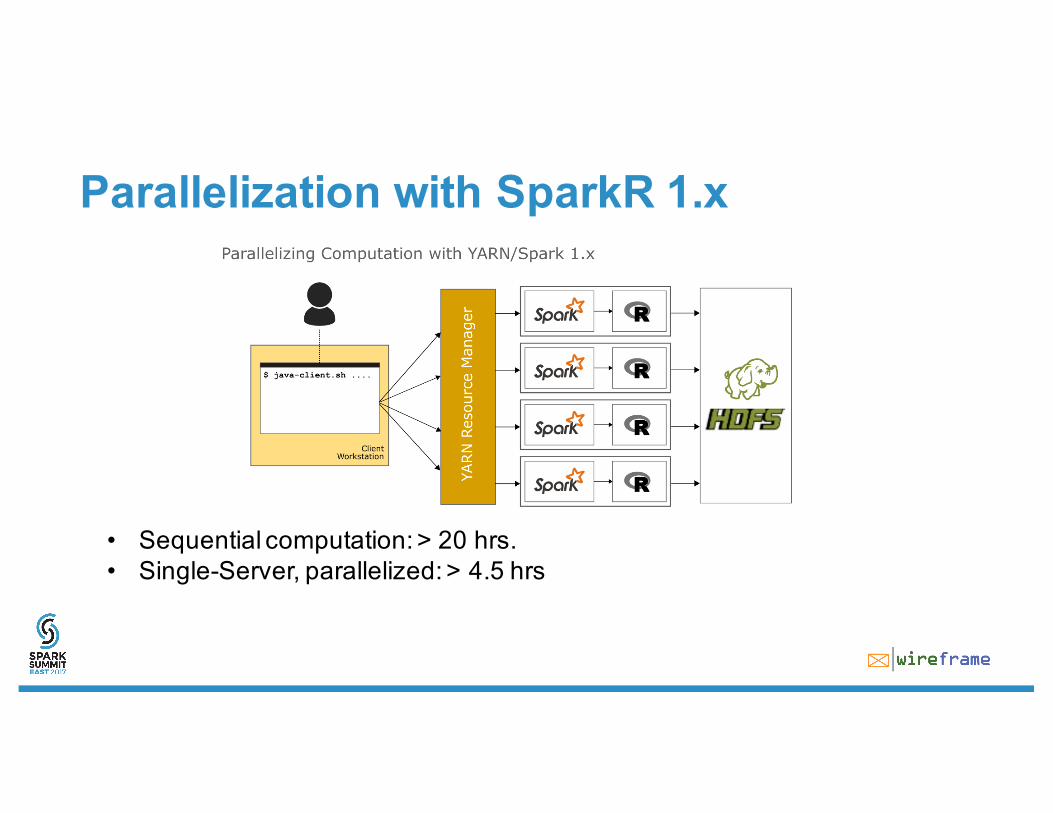
Parallelization with SparkR 1.x
• Sequential computation: > 20 hrs.• Single-Server, parallelized: > 4.5 hrs
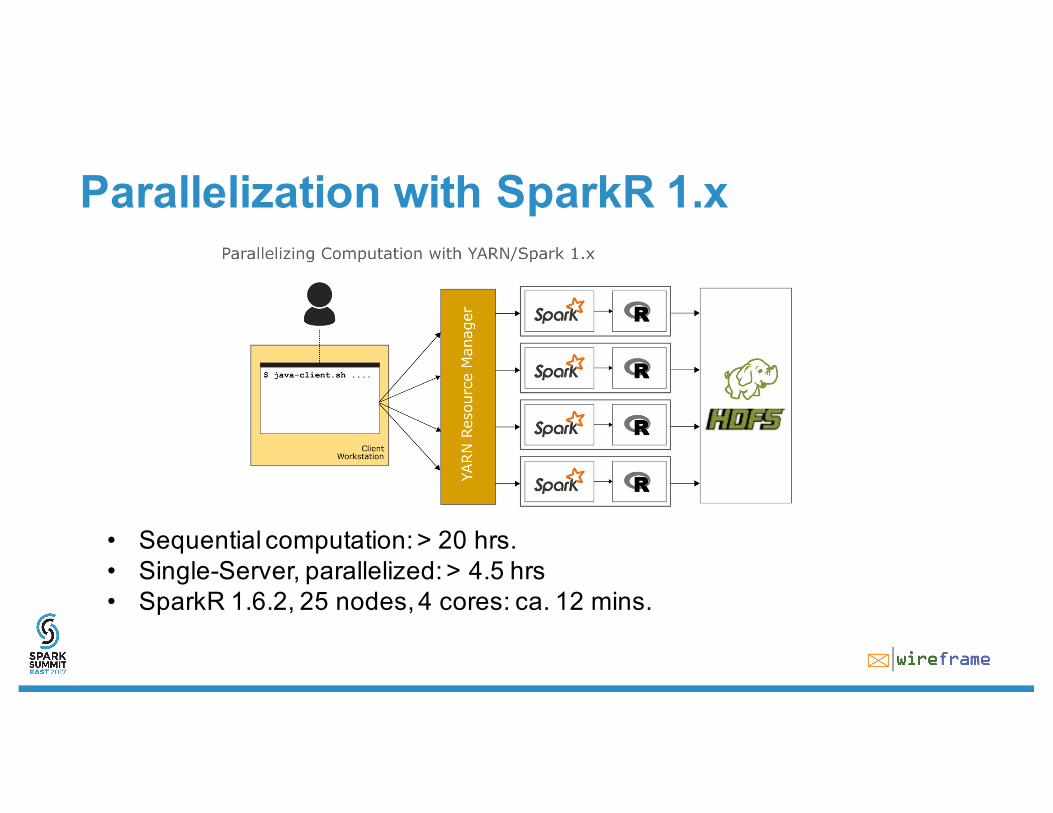
Parallelization with SparkR 1.x
• Sequential computation: > 20 hrs.• Single-Server, parallelized: > 4.5 hrs• SparkR 1.6.2, 25 nodes, 4 cores: ca. 12 mins.
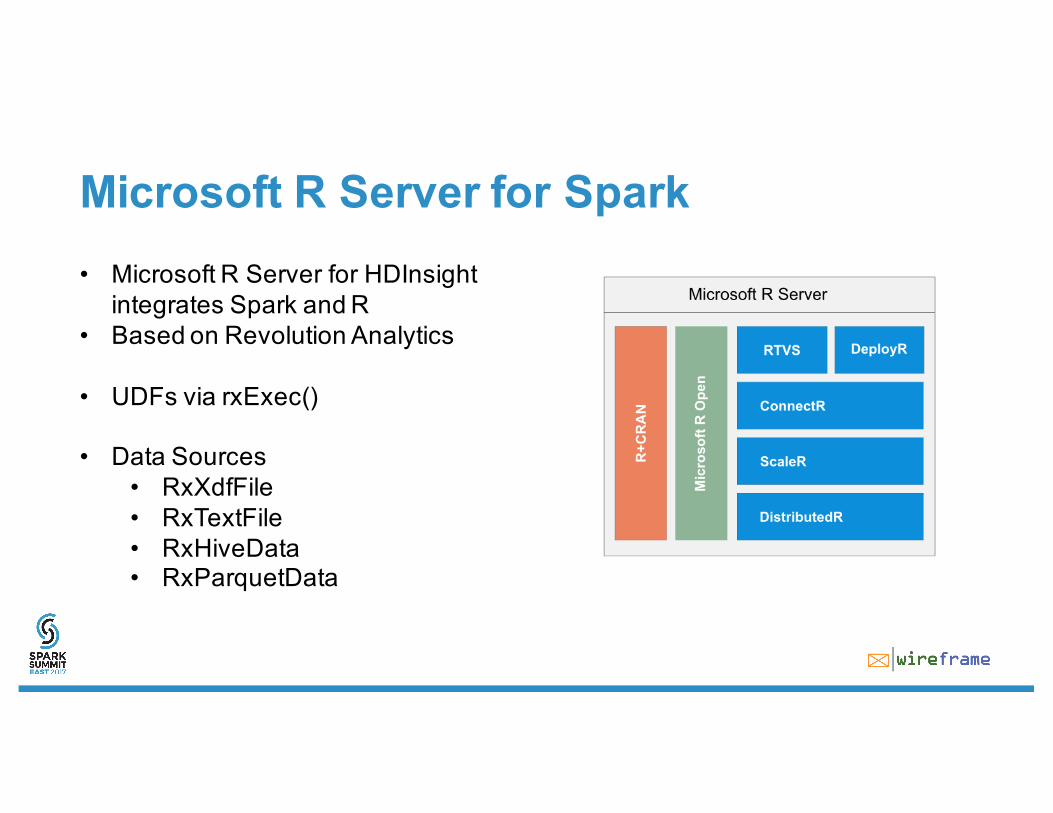
Microsoft R Server for Spark• Microsoft R Server for HDInsight
integrates Spark and R• Based on Revolution Analytics
• UDFs via rxExec()
• Data Sources• RxXdfFile• RxTextFile• RxHiveData• RxParquetData
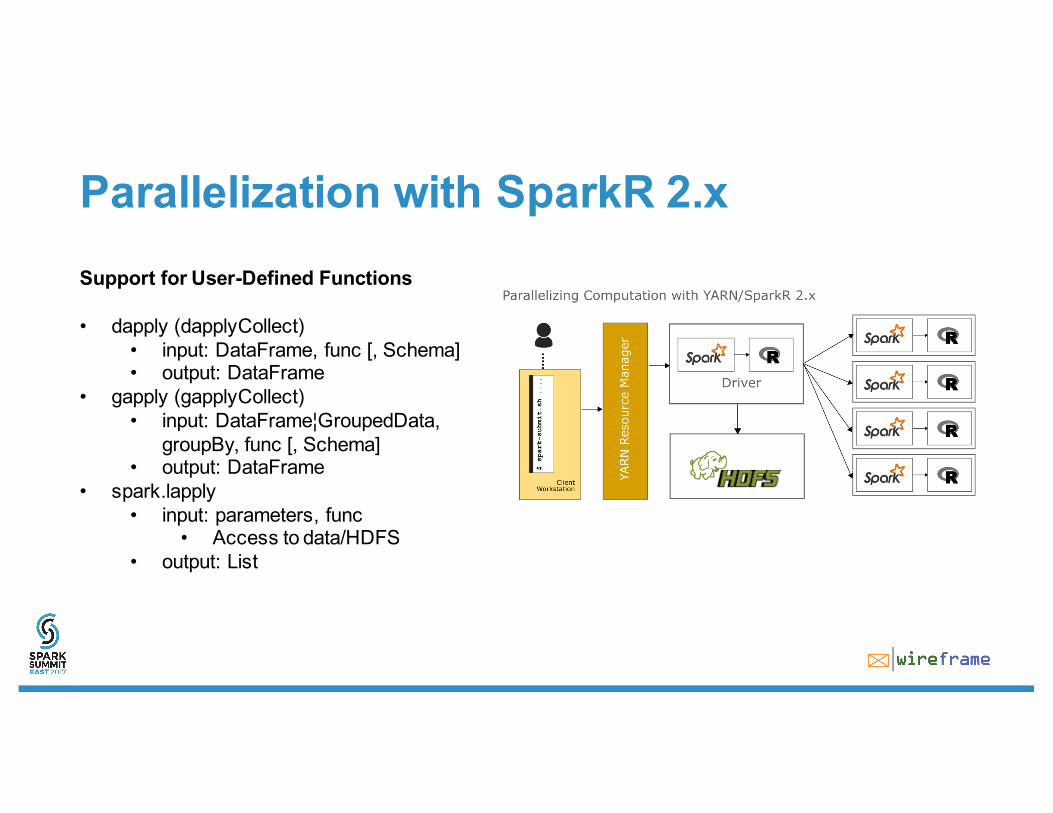
Parallelization with SparkR 2.xSupport for User-Defined Functions
• dapply (dapplyCollect)• input: DataFrame, func [, Schema]• output: DataFrame
• gapply (gapplyCollect)• input: DataFrame¦GroupedData,
groupBy, func [, Schema]• output: DataFrame
• spark.lapply• input: parameters, func
• Access to data/HDFS• output: List
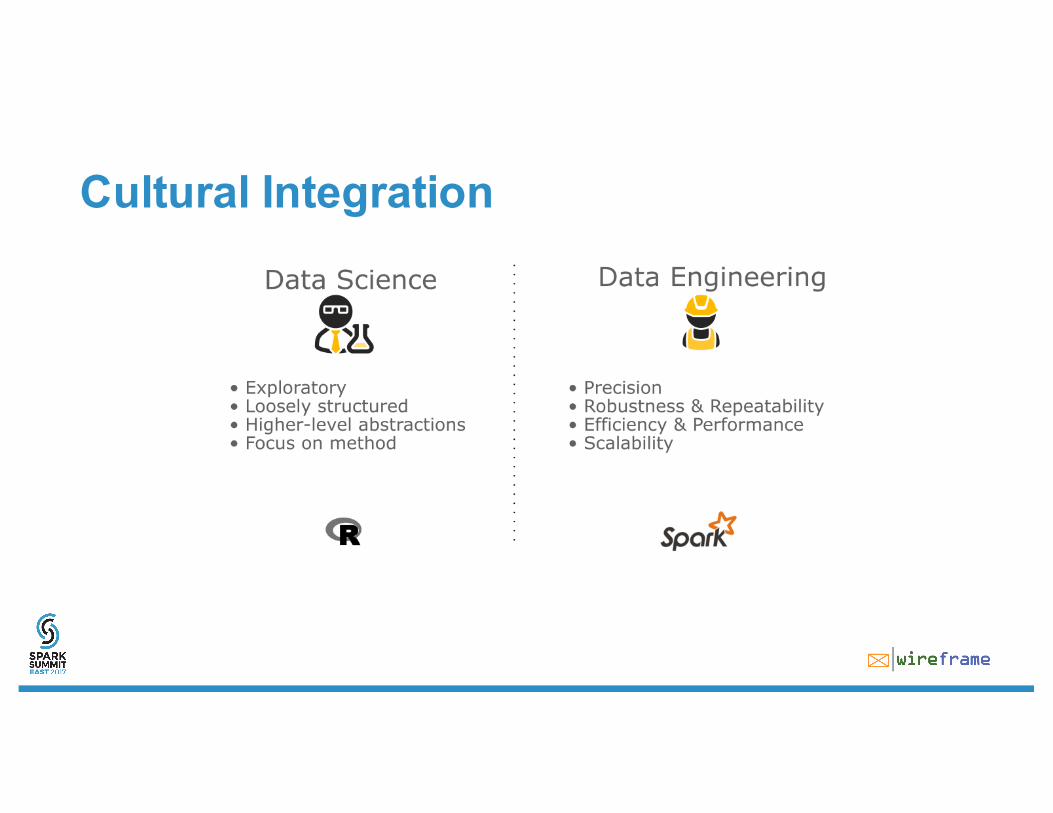
Cultural Integration
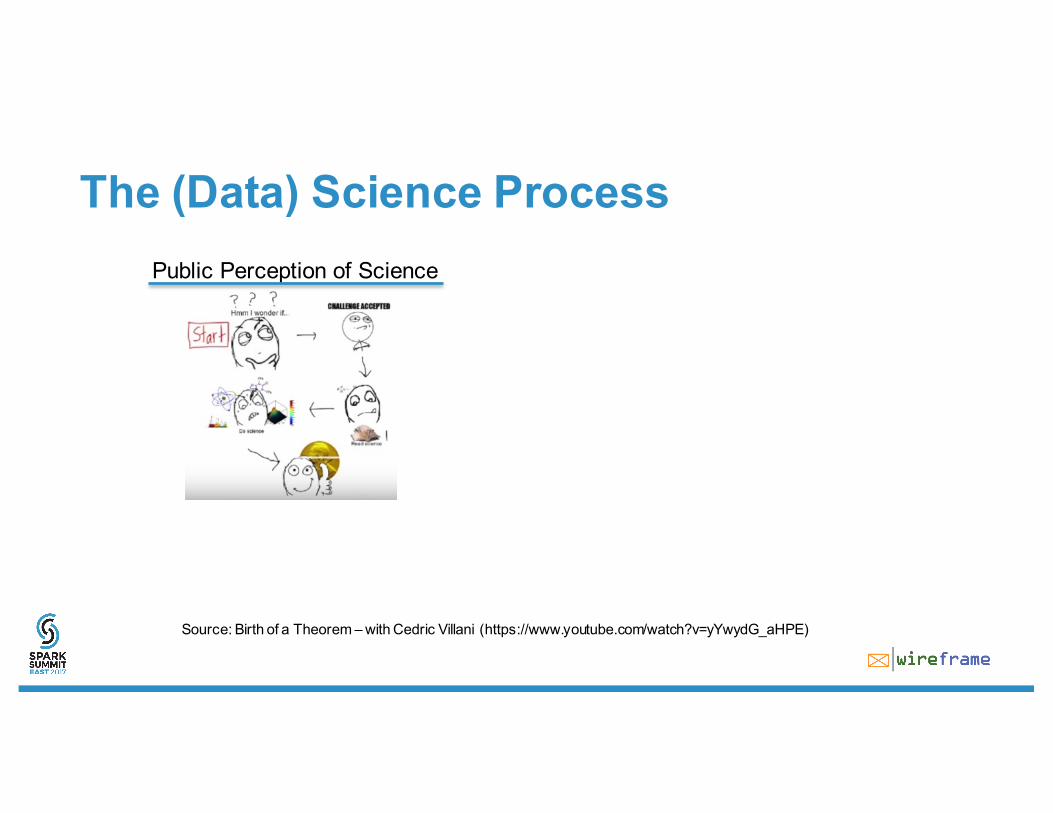
The (Data) Science ProcessPublic Perception of Science
Source: Birth of a Theorem – with Cedric Villani (https://www.youtube.com/watch?v=yYwydG_aHPE)
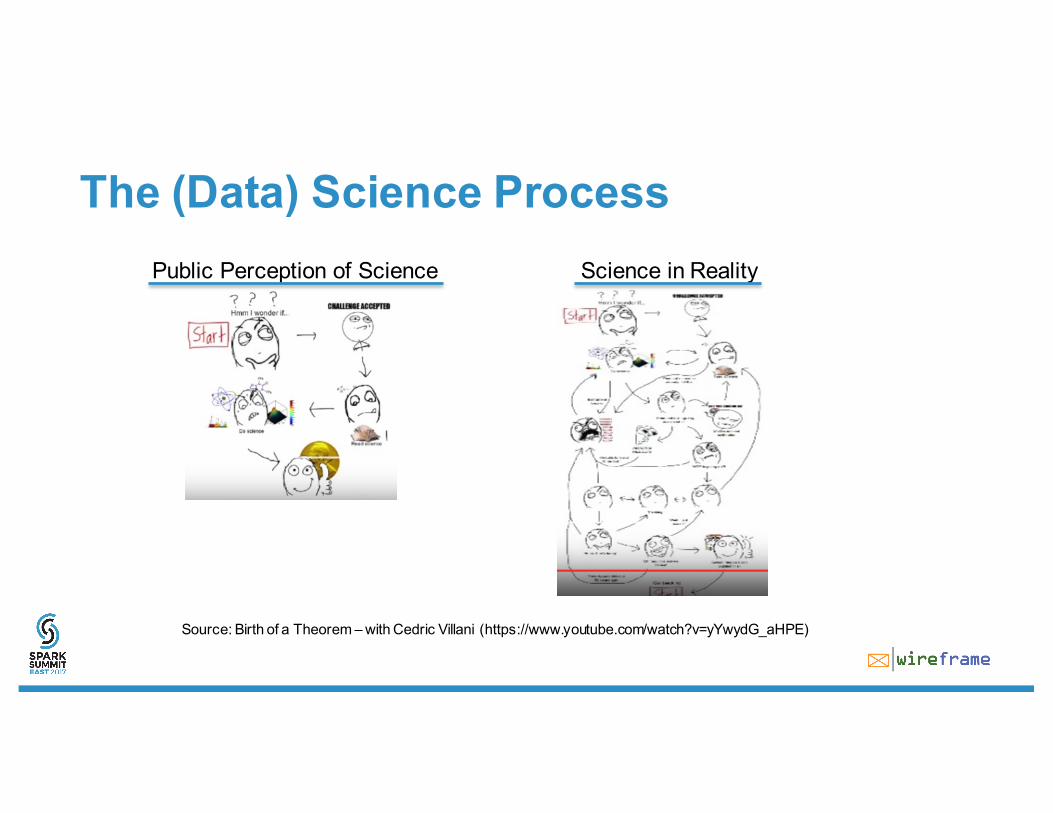
The (Data) Science ProcessPublic Perception of Science Science in Reality
Source: Birth of a Theorem – with Cedric Villani (https://www.youtube.com/watch?v=yYwydG_aHPE)
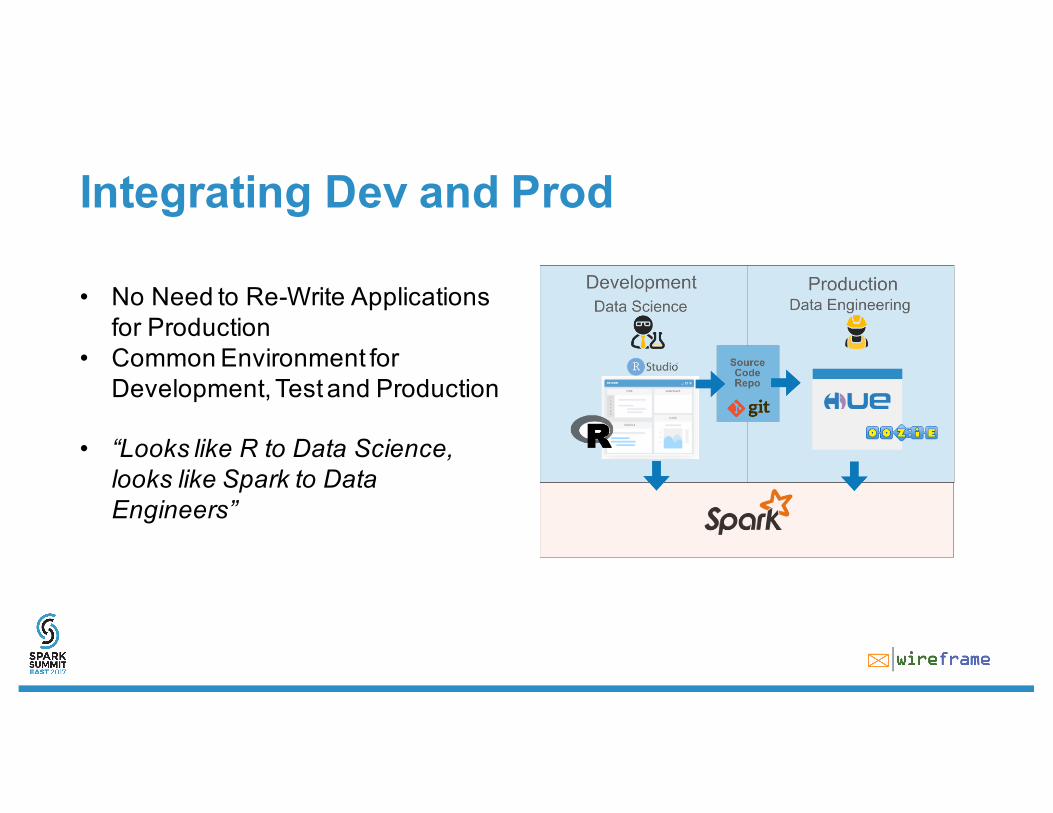
Integrating Dev and Prod
• No Need to Re-Write Applications for Production
• Common Environment for Development, Test and Production
• “Looks like R to Data Science, looks like Spark to Data Engineers”
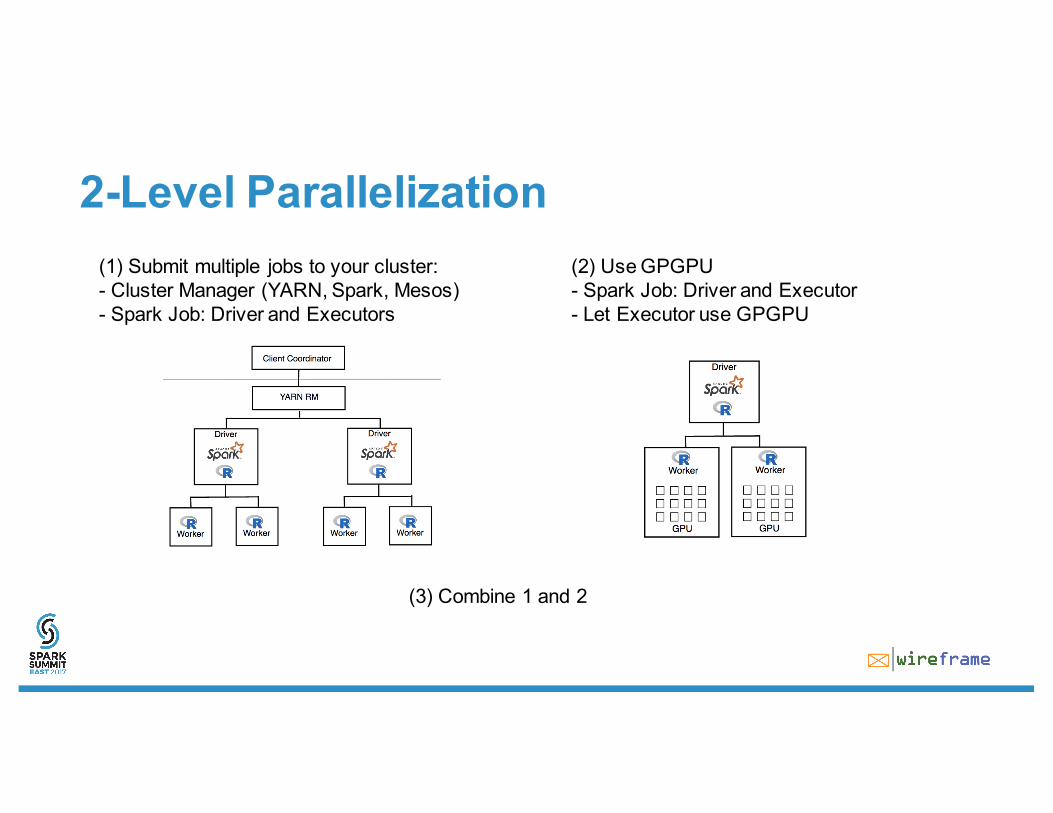
2-Level Parallelization(1) Submit multiple jobs to your cluster:- Cluster Manager (YARN, Spark, Mesos)- Spark Job: Driver and Executors
(2) Use GPGPU - Spark Job: Driver and Executor- Let Executor use GPGPU
(3) Combine 1 and 2
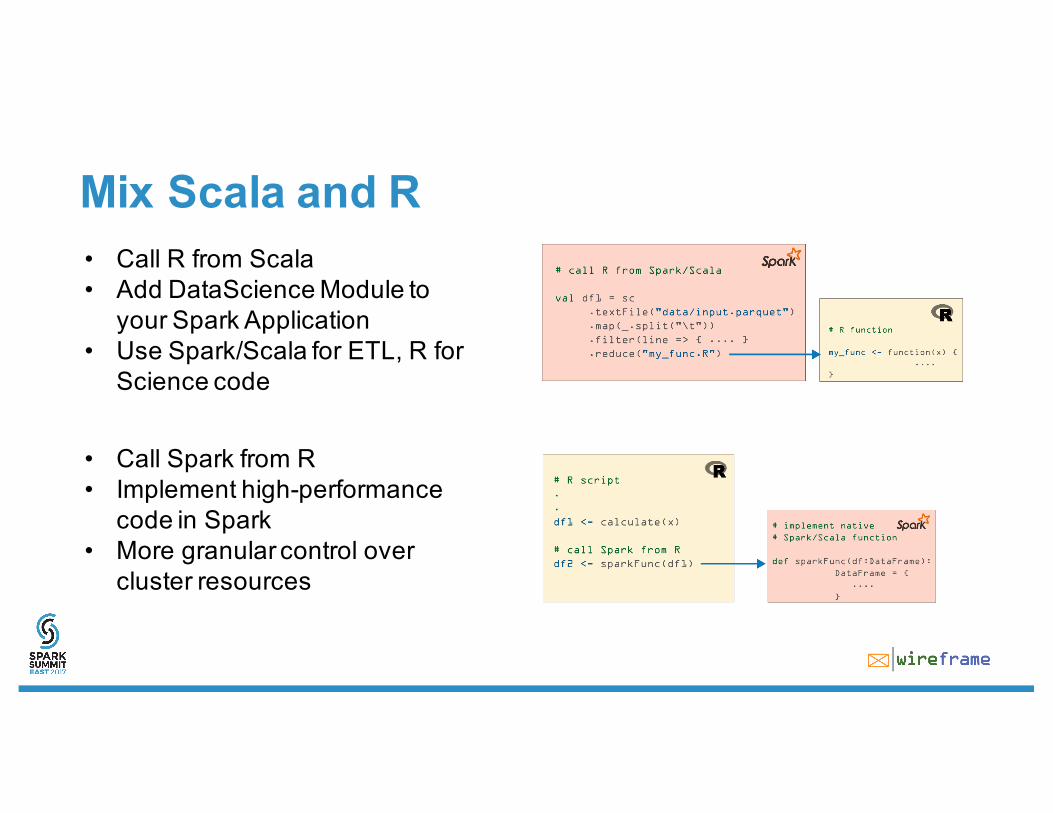
Mix Scala and R• Call R from Scala• Add DataScience Module to
your Spark Application• Use Spark/Scala for ETL, R for
Science code
• Call Spark from R• Implement high-performance
code in Spark • More granular control over
cluster resources
Spark & R: A Dynamic Ecosystem
Hadoop, Spark & R: Many interesting projects and options
• SparkR (Apache, Databricks)• R Server for Spark (Microsoft)• Sparklyr (RStudio)
• SystemML (IBM)• FastR (Oracle)• Renjin (BeDataDriven)
Outlook & Misc• Organizational: Deepen Integration of Data Engineering & Data Science
• Source Code Control & Versioning (git …)• Continuous Build• Test Management (RUnit, testthat…?)• Multi-Output (Rmarkdown)
• Technical: New Approaches• Simplify/Unify Data Pipelines (SparkSQL)• Performance Improvement: use MLlib• Performance Improvement: move calculation to GPU
Thank You.Heiko [email protected]