Embed Size (px)
Citation preview
© OECD/IEA 2017
Power, renewables and energy efficiency
7 December 2017
© OECD/IEA 2017
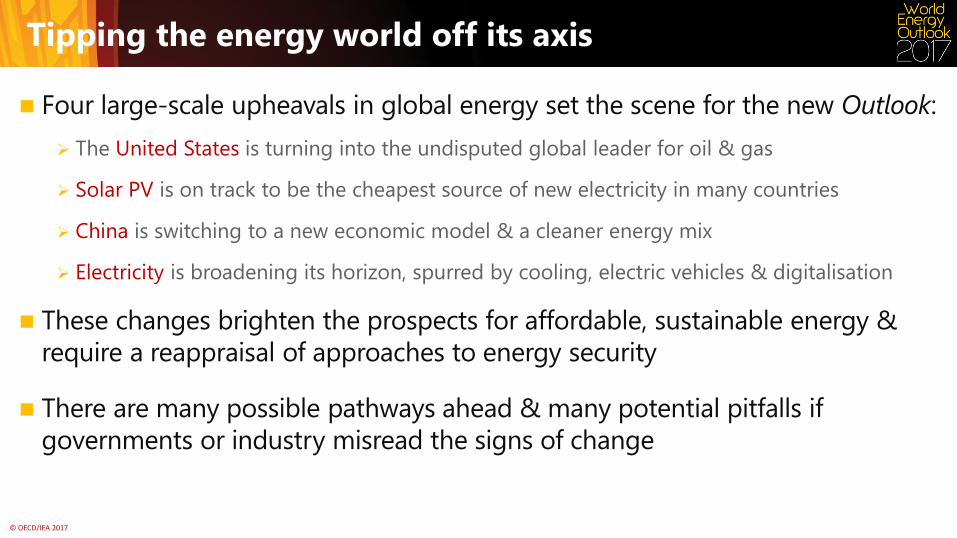
Tipping the energy world off its axis
Four large-scale upheavals in global energy set the scene for the new Outlook:
The United States is turning into the undisputed global leader for oil & gas
Solar PV is on track to be the cheapest source of new electricity in many countries
China is switching to a new economic model & a cleaner energy mix
Electricity is broadening its horizon, spurred by cooling, electric vehicles & digitalisation
These changes brighten the prospects for affordable, sustainable energy &
require a reappraisal of approaches to energy security
There are many possible pathways ahead & many potential pitfalls if
governments or industry misread the signs of change
© OECD/IEA 2017
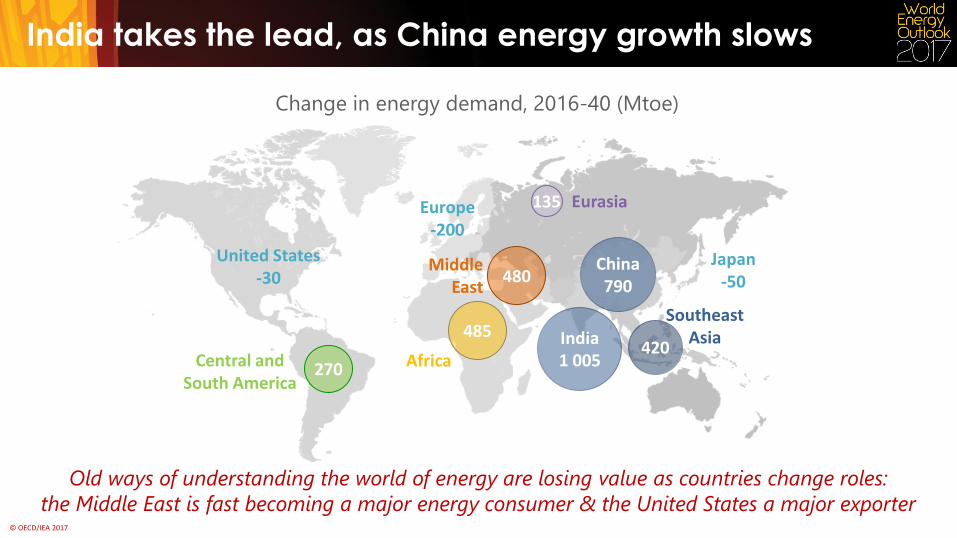
India takes the lead, as China energy growth slows
Change in energy demand, 2016-40 (Mtoe)
Old ways of understanding the world of energy are losing value as countries change roles:
the Middle East is fast becoming a major energy consumer & the United States a major exporter
India 1 005
420
Southeast Asia
China 790
United States -30
Japan -50
Europe -200
270 Central and South America
485
Africa
135 Eurasia
480 Middle
East
© OECD/IEA 2017
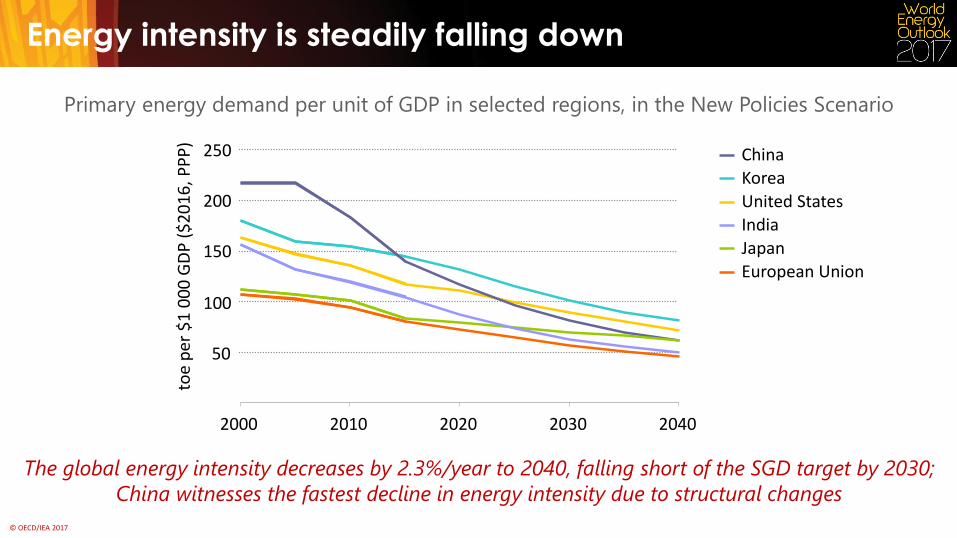
Energy intensity is steadily falling down
The global energy intensity decreases by 2.3%/year to 2040, falling short of the SGD target by 2030;
China witnesses the fastest decline in energy intensity due to structural changes
50
100
150
200
250
2000 2010 2020 2030 2040
Korea
United States
China
Japan
India
European Union
toe
per
$1
00
0 G
DP
($
20
16
, PP
P)
Primary energy demand per unit of GDP in selected regions, in the New Policies Scenario
© OECD/IEA 2017
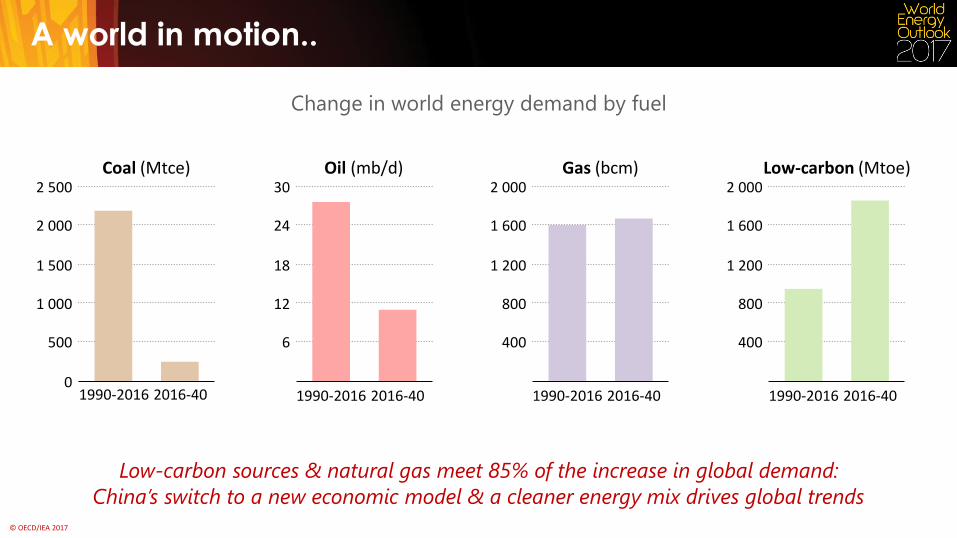
Change in world energy demand by fuel
Low-carbon sources & natural gas meet 85% of the increase in global demand:
Coal (Mtce)
0
500
1 000
1 500
2 000
2 500 Oil (mb/d)
6
12
18
24
30
1990-2016 2016-40
Gas (bcm)
400
800
1 200
1 600
2 000
1990-2016 2016-40
Low-carbon (Mtoe)
400
800
1 200
1 600
2 000
1990-2016 2016-40 1990-2016 2016-40
A world in motion..
China’s switch to a new economic model & a cleaner energy mix drives global trends
© OECD/IEA 2017
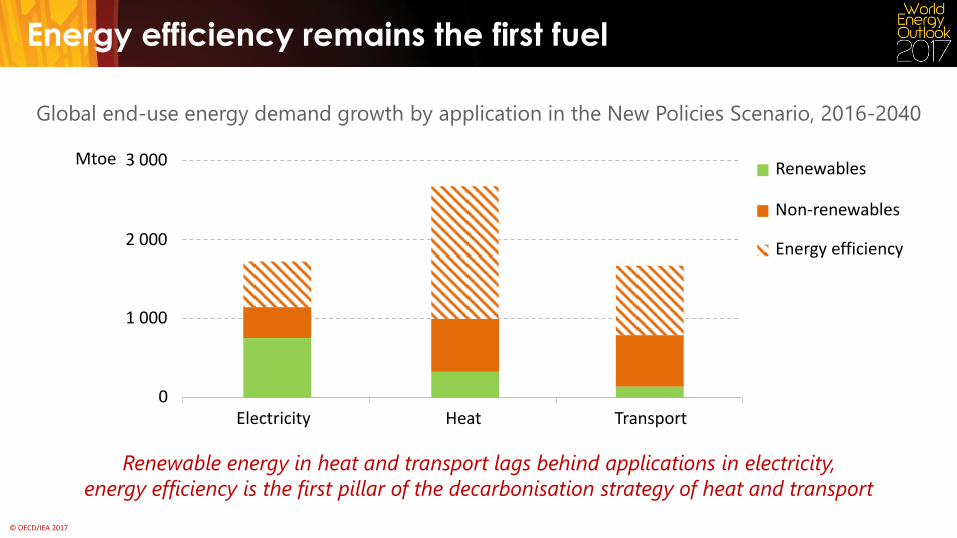
Energy efficiency remains the first fuel
Renewable energy in heat and transport lags behind applications in electricity,
energy efficiency is the first pillar of the decarbonisation strategy of heat and transport
Global end-use energy demand growth by application in the New Policies Scenario, 2016-2040
Renewables
Energy efficiency
Electricity Heat Transport
Non-renewables
1 000
2 000
3 000 Mtoe
0
© OECD/IEA 2017
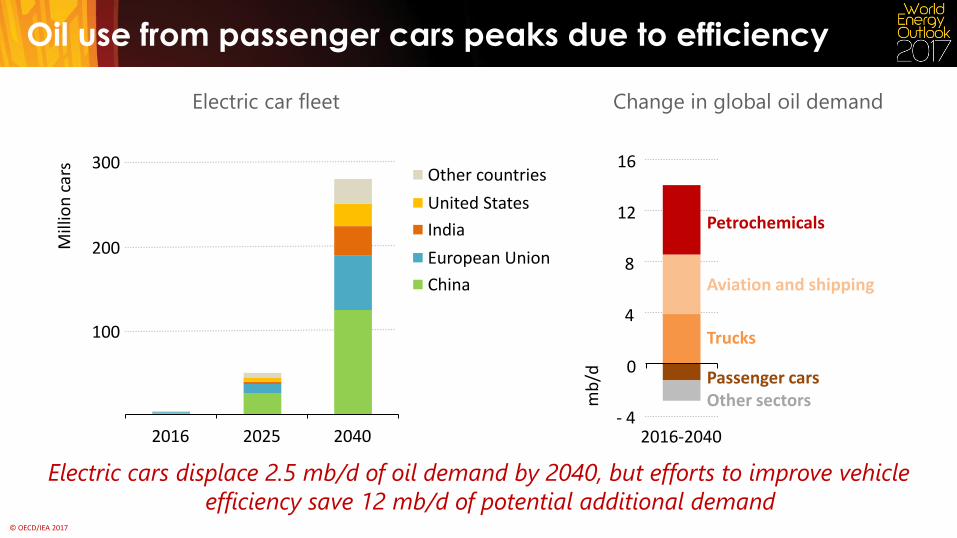
Oil use from passenger cars peaks due to efficiency
Electric car fleet
100
200
300
2016 2025 2040
Mill
ion
car
s
Other countries
United States
India
European Union
China
Passenger cars Other sectors
Change in global oil demand
4
8
12
16
Petrochemicals
Aviation and shipping
Trucks
mb
/d
- 4 2016-2040
0
Electric cars displace 2.5 mb/d of oil demand by 2040, but efforts to improve vehicle
efficiency save 12 mb/d of potential additional demand
© OECD/IEA 2017
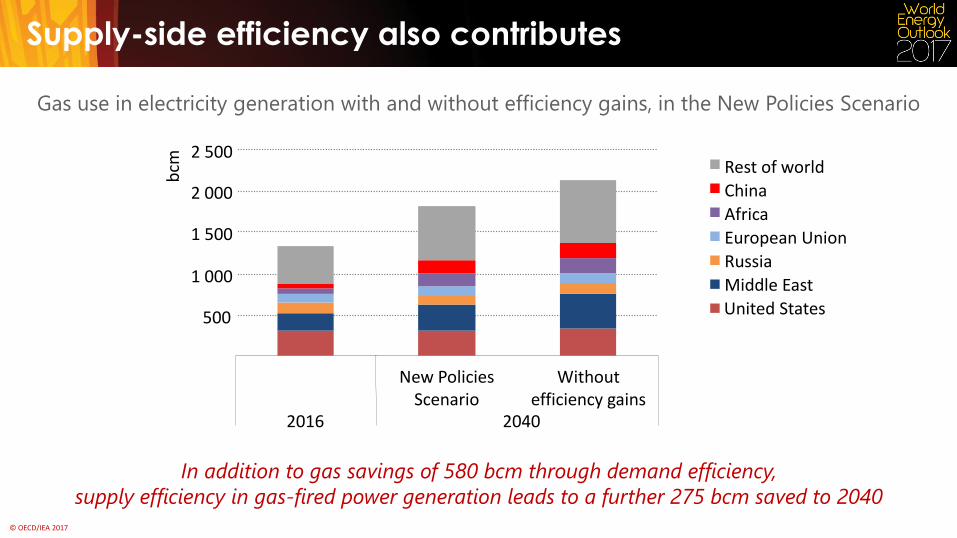
Supply-side efficiency also contributes
Gas use in electricity generation with and without efficiency gains, in the New Policies Scenario
In addition to gas savings of 580 bcm through demand efficiency,
supply efficiency in gas-fired power generation leads to a further 275 bcm saved to 2040
500
1 000
1 500
2 000
2 500
New Policies Scenario
Without efficiency gains
2040
bcm
Rest of world
China
Africa
European Union
Russia
Middle East
United States
2016
© OECD/IEA 2017
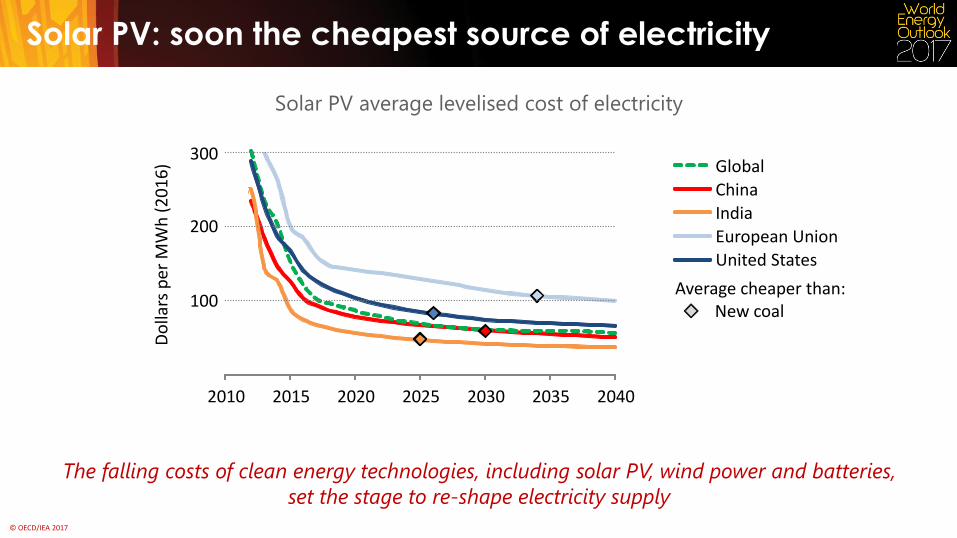
Solar PV: soon the cheapest source of electricity
Solar PV average levelised cost of electricity
The falling costs of clean energy technologies, including solar PV, wind power and batteries,
set the stage to re-shape electricity supply
100
200
300
2010 2015 2020 2025 2030 2035 2040
Do
llars
per
MW
h (
20
16
) Global
China
India
European Union
United States
New coal Average cheaper than:
© OECD/IEA 2017
GW
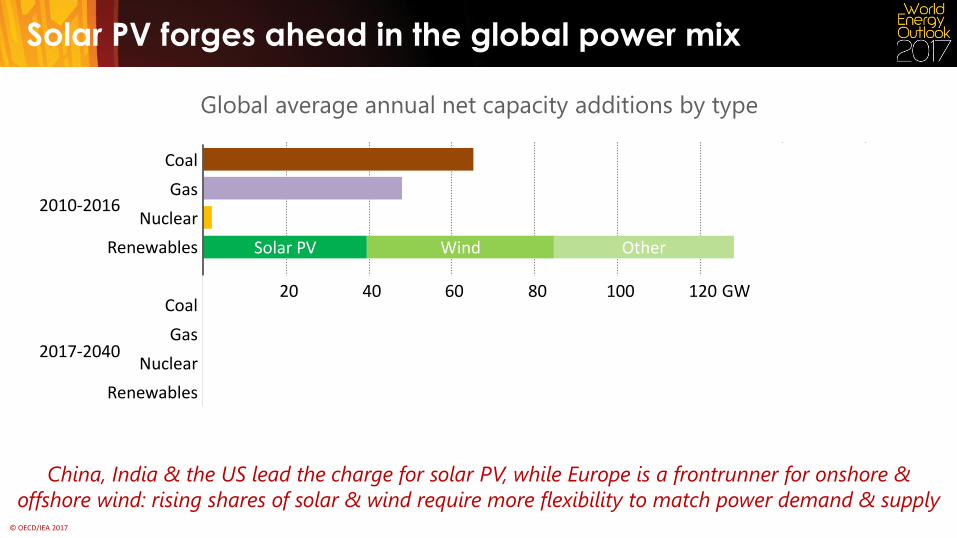
Solar PV forges ahead in the global power mix
Global average annual net capacity additions by type
China, India & the US lead the charge for solar PV, while Europe is a frontrunner for onshore &
offshore wind: rising shares of solar & wind require more flexibility to match power demand & supply
Renewables
Nuclear
Gas
Coal
Renewables
Nuclear
Gas
Coal
20 40 60 80 100 120 140 160 GW
2010-2016
2017-2040
Solar PV Wind
Solar PV Wind Other
Other
20 40 60 80 100 120 GW
© OECD/IEA 2017
10
20
30
40
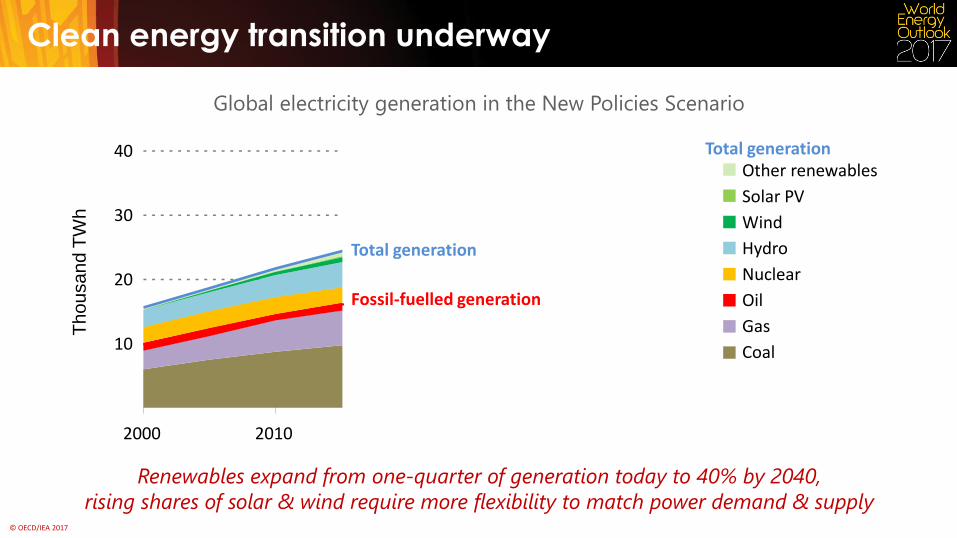
Clean energy transition underway
Renewables expand from one-quarter of generation today to 40% by 2040,
rising shares of solar & wind require more flexibility to match power demand & supply
Global electricity generation in the New Policies Scenario
2000 2010 2020 2030 2040
Th
ou
sa
nd
TW
h
Other renewables
Solar PV
Wind
Hydro
Nuclear
Oil
Gas
Coal
Total generation
Fossil-fuelled generation
Total generation
© OECD/IEA 2017
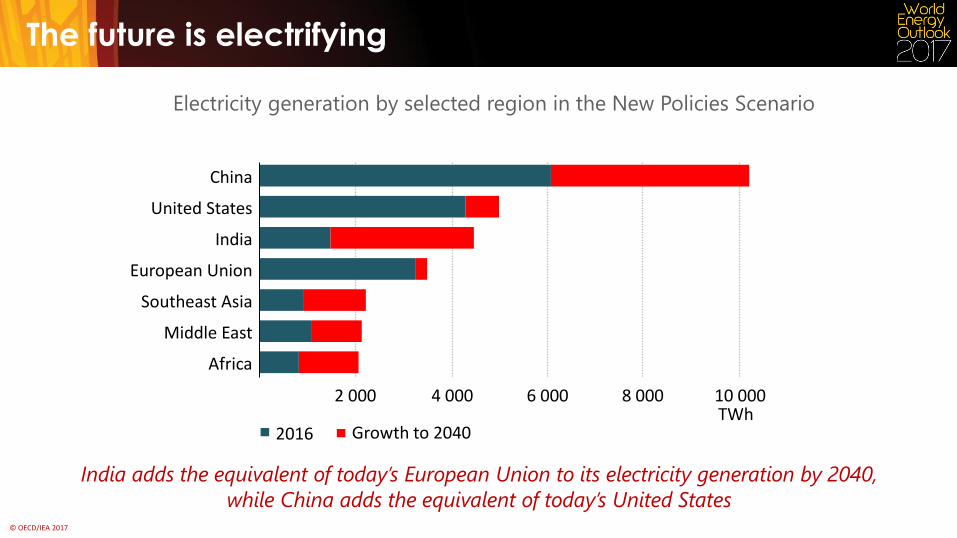
The future is electrifying
Electricity generation by selected region in the New Policies Scenario
India adds the equivalent of today’s European Union to its electricity generation by 2040,
Middle East
2 000 4 000 6 000 8 000 10 000
Africa
Southeast Asia
European Union
India
United States
China
TWh 2016 Growth to 2040
while China adds the equivalent of today’s United States
© OECD/IEA 2017
2040
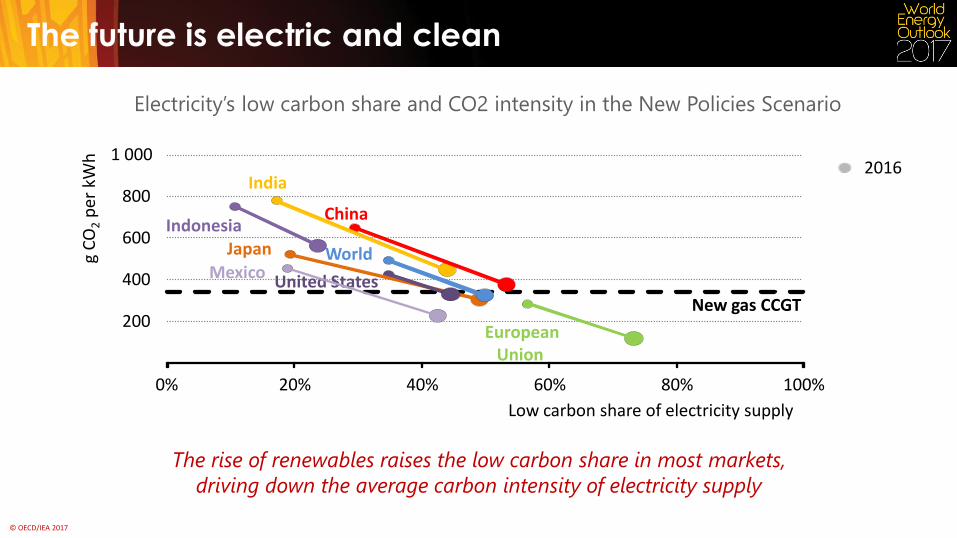
The future is electric and clean
The rise of renewables raises the low carbon share in most markets,
driving down the average carbon intensity of electricity supply
Electricity’s low carbon share and CO2 intensity in the New Policies Scenario
200
400
600
800
1 000
0% 20% 40% 60% 80% 100%
g C
O2 p
er k
Wh
Low carbon share of electricity supply
Japan
India
Indonesia China
European Union
United States Mexico
New gas CCGT
World
2016
© OECD/IEA 2017
10
20
30
40
2000 2010 2020 2030 2040 G
t
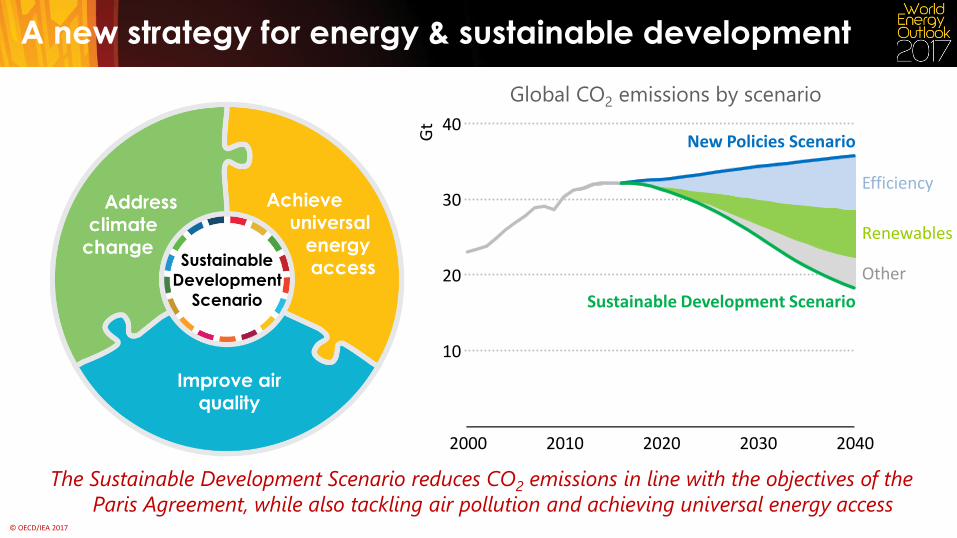
A new strategy for energy & sustainable development
Sustainable
Development
Scenario
The Sustainable Development Scenario reduces CO2 emissions in line with the objectives of the
Paris Agreement, while also tackling air pollution and achieving universal energy access
New Policies Scenario
Sustainable Development Scenario
Global CO2 emissions by scenario
Efficiency
Renewables
Other
© OECD/IEA 2017
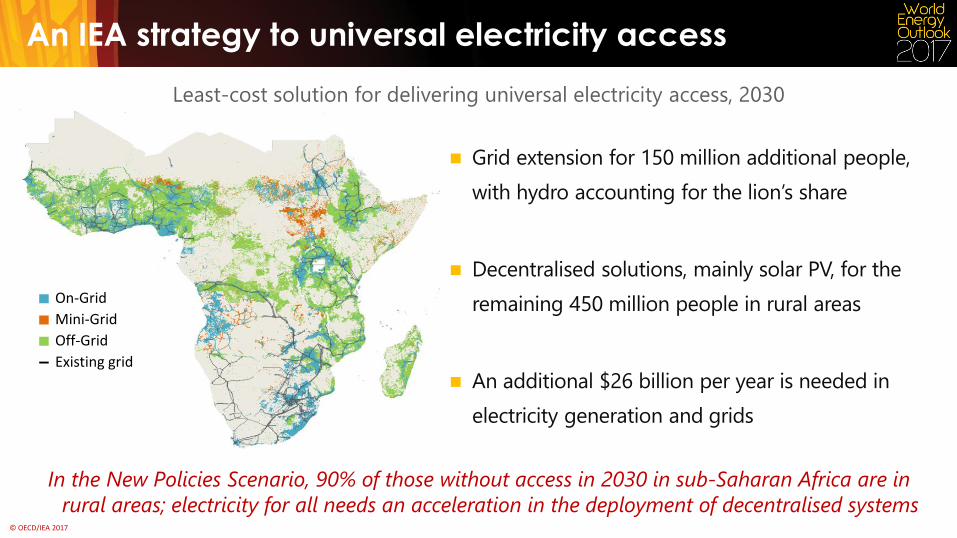
An IEA strategy to universal electricity access
On-Grid
Mini-Grid
Off-Grid
Existing grid
Grid extension for 150 million additional people,
with hydro accounting for the lion’s share
Decentralised solutions, mainly solar PV, for the
remaining 450 million people in rural areas
An additional $26 billion per year is needed in
electricity generation and grids
In the New Policies Scenario, 90% of those without access in 2030 in sub-Saharan Africa are in
rural areas; electricity for all needs an acceleration in the deployment of decentralised systems
Least-cost solution for delivering universal electricity access, 2030
© OECD/IEA 2017
200
400
600
NPS
TWh
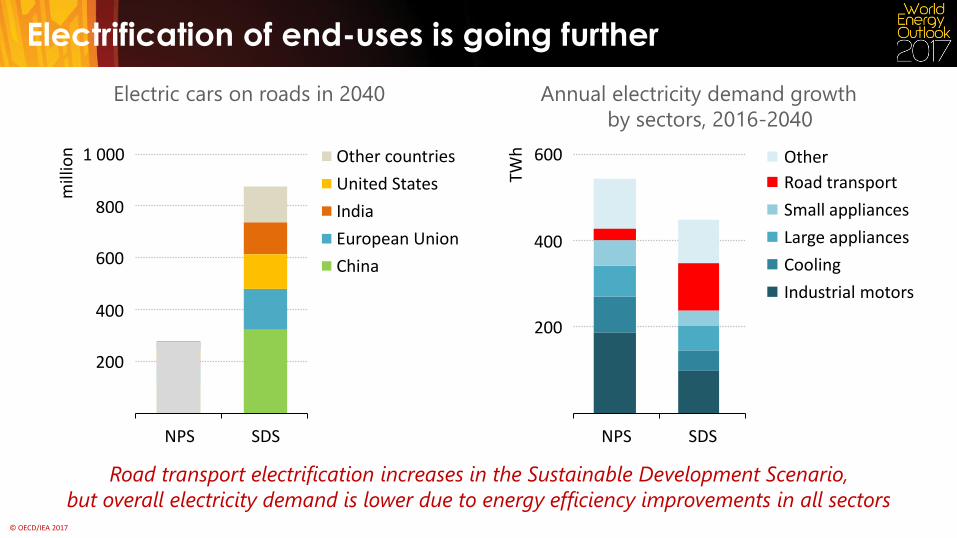
Electrification of end-uses is going further
Electric cars on roads in 2040
Road transport electrification increases in the Sustainable Development Scenario,
but overall electricity demand is lower due to energy efficiency improvements in all sectors
200
400
600
800
1 000
NPS SDS
mill
ion
SDS
Other
Road transport
Small appliances
Large appliances
Cooling
Industrial motors
Other countries
United States
India
European Union
China
Annual electricity demand growth
by sectors, 2016-2040
© OECD/IEA 2017
Industry
Transport Buildings
NPS
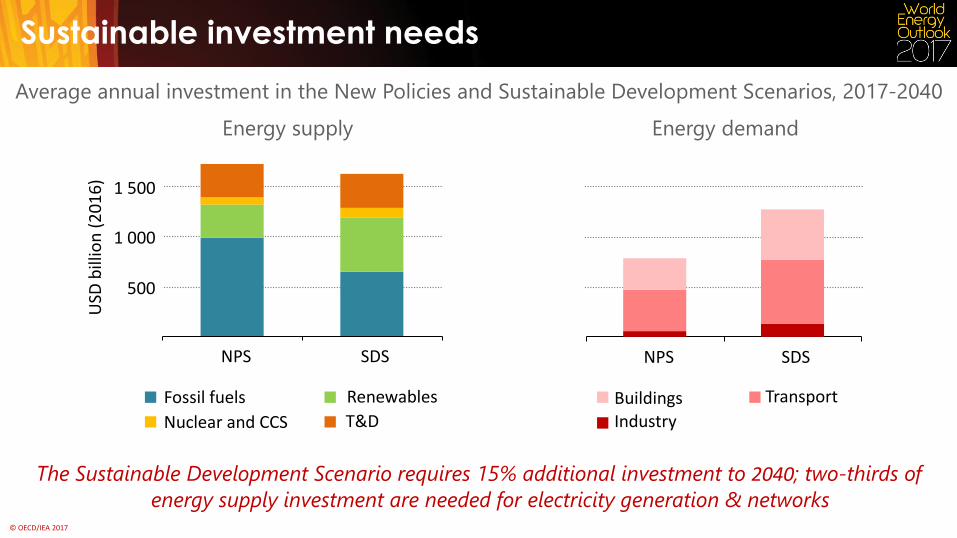
Average annual investment in the New Policies and Sustainable Development Scenarios, 2017-2040
Sustainable investment needs
The Sustainable Development Scenario requires 15% additional investment to 2040; two-thirds of
energy supply investment are needed for electricity generation & networks
T&D Nuclear and CCS
Renewables Fossil fuels
Energy supply
500
1 000
1 500
NPS SDS
USD
bill
ion
(2
01
6)
SDS
Energy demand
© OECD/IEA 2017
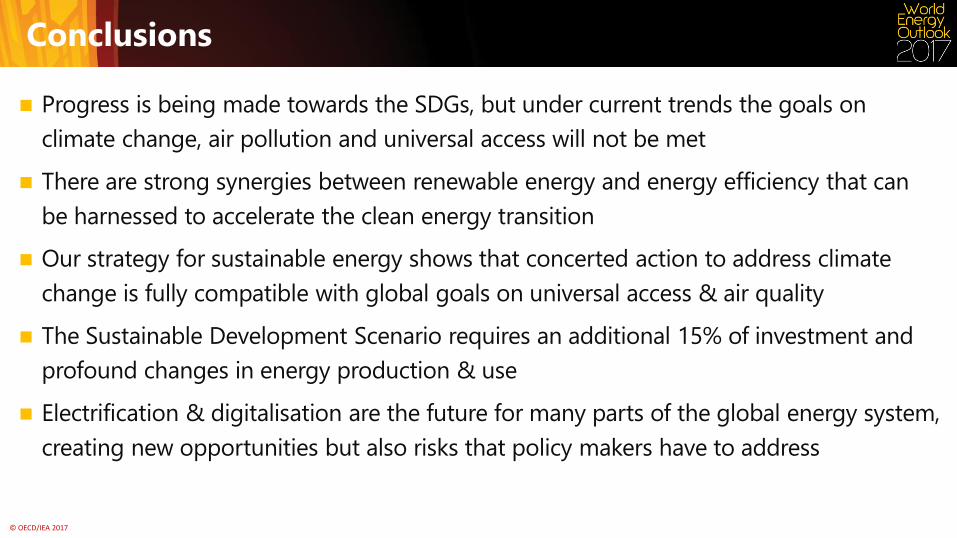
Conclusions
Progress is being made towards the SDGs, but under current trends the goals on
climate change, air pollution and universal access will not be met
There are strong synergies between renewable energy and energy efficiency that can
be harnessed to accelerate the clean energy transition
Our strategy for sustainable energy shows that concerted action to address climate
change is fully compatible with global goals on universal access & air quality
The Sustainable Development Scenario requires an additional 15% of investment and
profound changes in energy production & use
Electrification & digitalisation are the future for many parts of the global energy system,
creating new opportunities but also risks that policy makers have to address
© OECD/IEA 2017
iea.org/weo


![[Webinar Slides] Advanced distribution management system integration of renewables and storage](https://img.pdfslide.net/doc/110x75/554a07c5b4c905e56c8b5840/webinar-slides-advanced-distribution-management-system-integration-of-renewables-and-storage.jpg)