Embed Size (px)
Citation preview
SAP HANA SPS 11 - What’s New? SAP HANA Operations
SAP HANA Product Management November, 2015
(Delta from SPS 10 to SPS 11)
© 2015 SAP AG or an SAP affiliate company. All rights reserved. 2
Agenda
Administration & Monitoring – Melanie Handreck
Backup & Recovery – Andrea Kristen
High Availability – Ralf Czekalla
SAP DB Control Center - José Ramos
Platform Lifecycle Management - Stephanie Lewellen
Application Lifecycle Management – Ron Silberstein
Questions & Answers – all
© 2015 SAP AG or an SAP affiliate company. All rights reserved. 3
Agenda Administration & Monitoring
SAP HANA Cockpit Offline system administration and diagnosis
SAP HANA Database Monitoring of DDL statements
Improved connection monitoring
Improved SQL statement analysis
SAP HANA CockpitFor Offline Administration
© 2015 SAP AG or an SAP affiliate company. All rights reserved. 5
SAP HANA Cockpit for Offline Administration
Overview
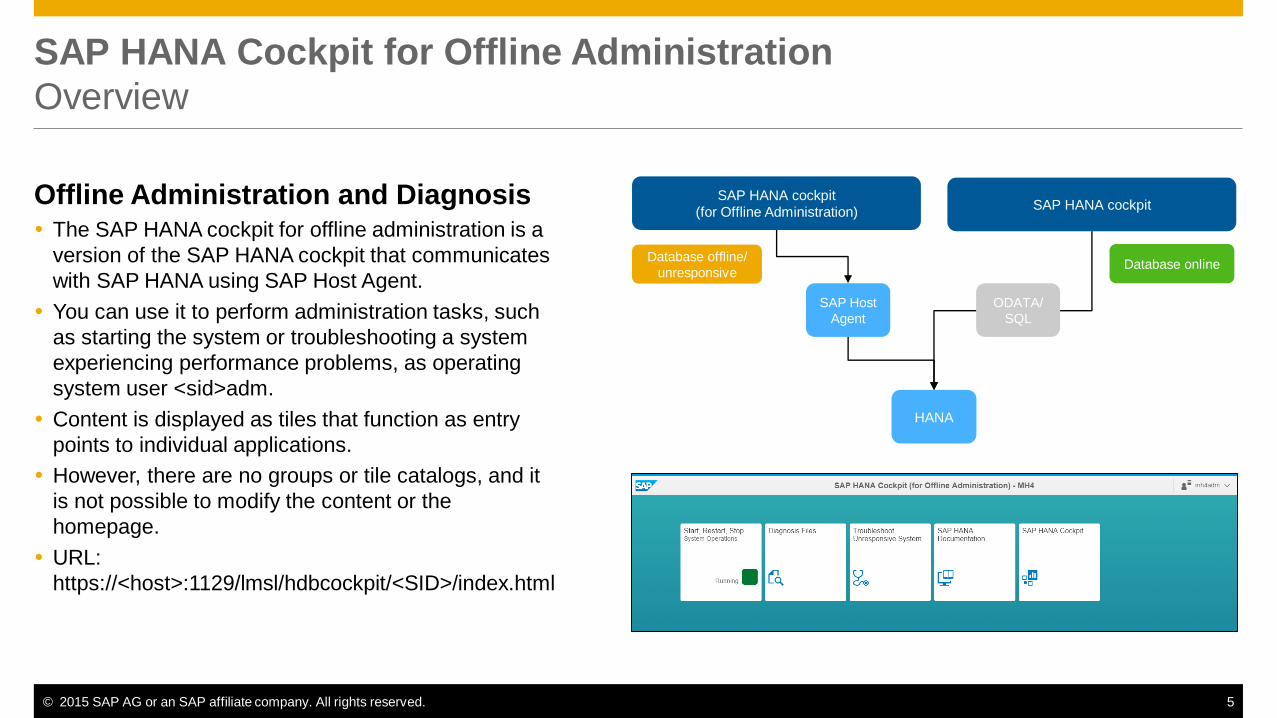
Offline Administration and Diagnosis The SAP HANA cockpit for offline administration is a
version of the SAP HANA cockpit that communicates
with SAP HANA using SAP Host Agent.
You can use it to perform administration tasks, such
as starting the system or troubleshooting a system
experiencing performance problems, as operating
system user <sid>adm.
Content is displayed as tiles that function as entry
points to individual applications.
However, there are no groups or tile catalogs, and it
is not possible to modify the content or the
homepage.
URL:
https://<host>:1129/lmsl/hdbcockpit/<SID>/index.html
HANA
SAP Host
Agent
SAP HANA cockpit
(for Offline Administration)
Database offline/
unresponsive
SAP HANA cockpit
Database online
ODATA/
SQL
© 2015 SAP AG or an SAP affiliate company. All rights reserved. 6
SAP HANA Cockpit for Offline Administration
Start/Restart/Stop System
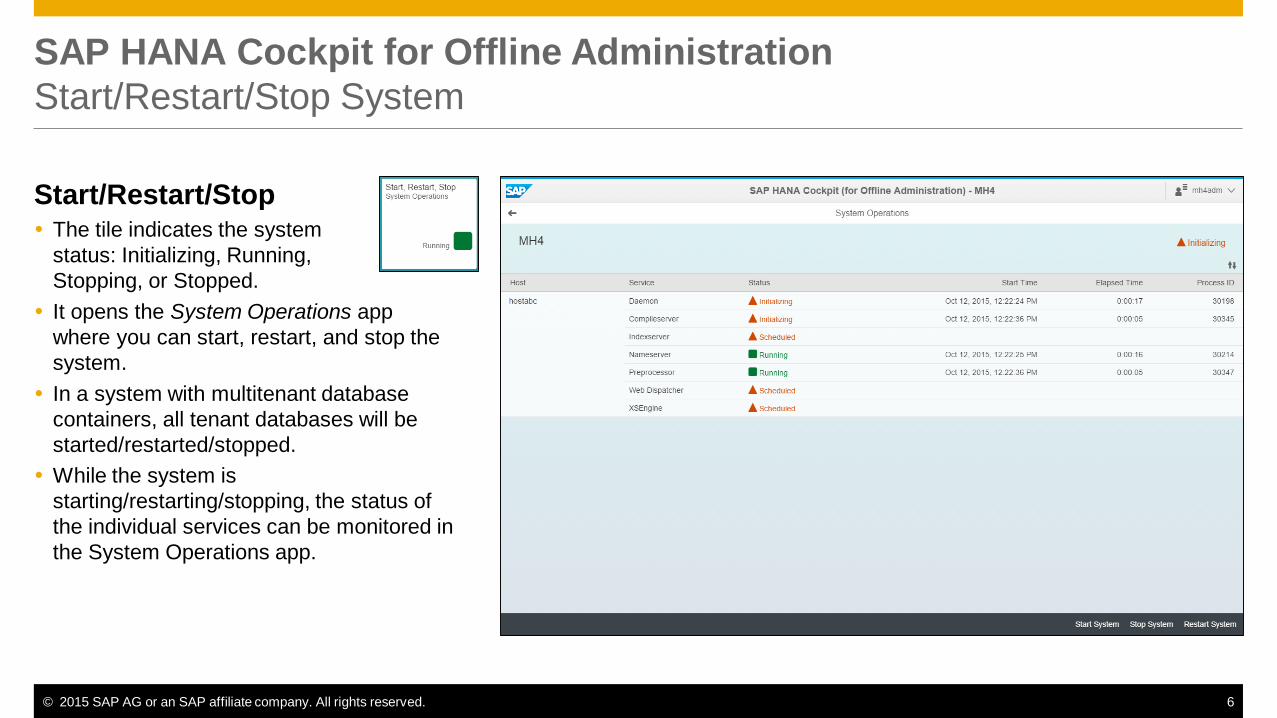
Start/Restart/Stop The tile indicates the system
status: Initializing, Running,
Stopping, or Stopped.
It opens the System Operations app
where you can start, restart, and stop the
system.
In a system with multitenant database
containers, all tenant databases will be
started/restarted/stopped.
While the system is
starting/restarting/stopping, the status of
the individual services can be monitored in
the System Operations app.
© 2015 SAP AG or an SAP affiliate company. All rights reserved. 7
SAP HANA Cockpit for Offline Administration
Diagnosis Files
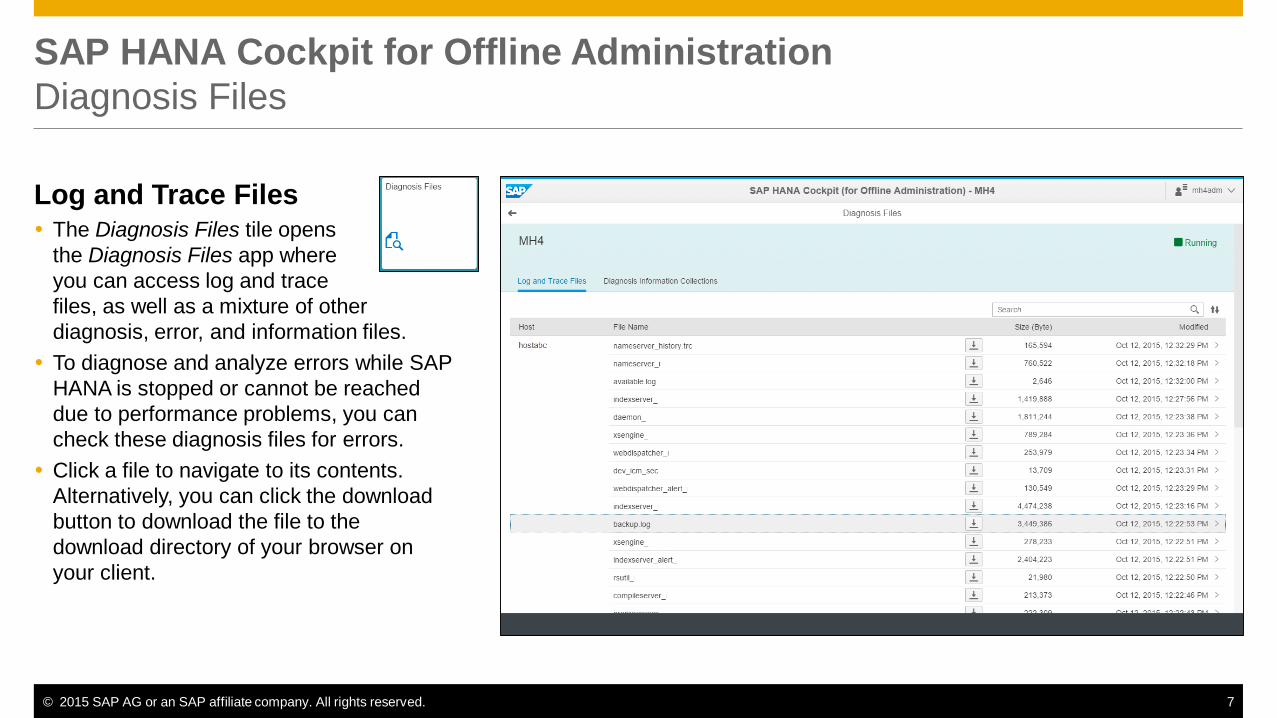
Log and Trace Files The Diagnosis Files tile opens
the Diagnosis Files app where
you can access log and trace
files, as well as a mixture of other
diagnosis, error, and information files.
To diagnose and analyze errors while SAP
HANA is stopped or cannot be reached
due to performance problems, you can
check these diagnosis files for errors.
Click a file to navigate to its contents.
Alternatively, you can click the download
button to download the file to the
download directory of your browser on
your client.
© 2015 SAP AG or an SAP affiliate company. All rights reserved. 8
SAP HANA Cockpit for Offline Administration
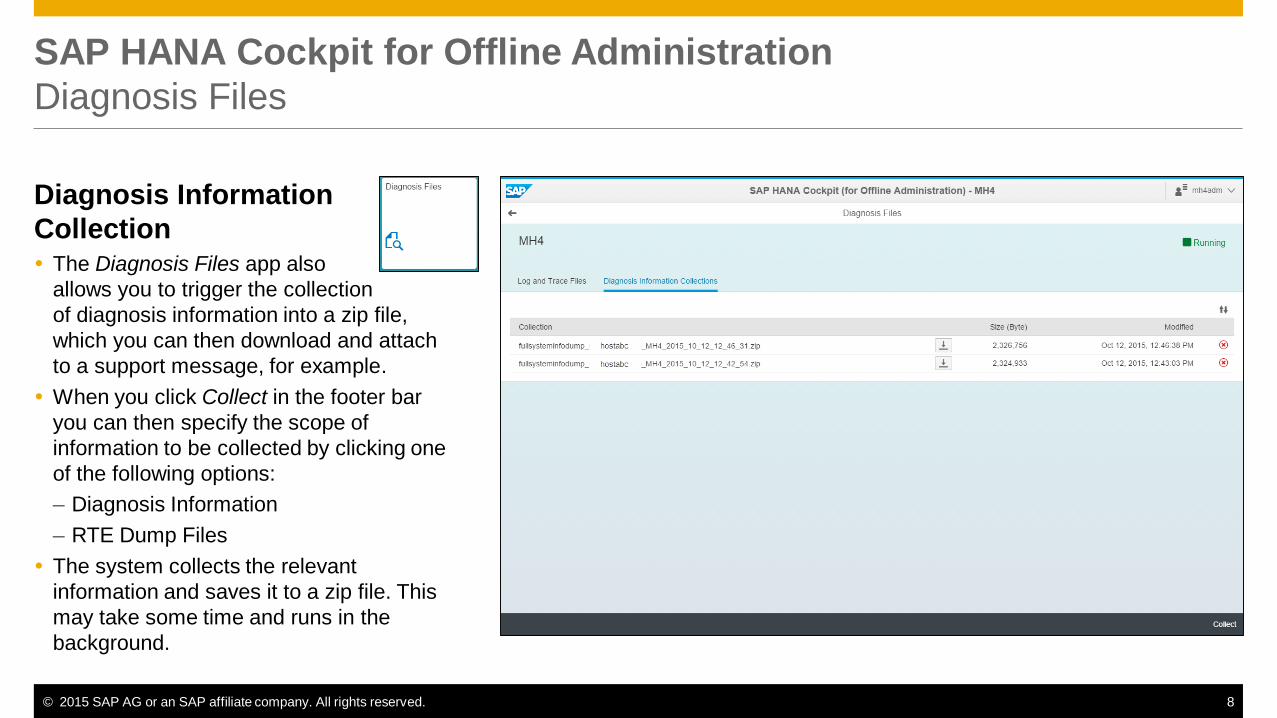
Diagnosis Files
Diagnosis Information
Collection The Diagnosis Files app also
allows you to trigger the collection
of diagnosis information into a zip file,
which you can then download and attach
to a support message, for example.
When you click Collect in the footer bar
you can then specify the scope of
information to be collected by clicking one
of the following options:
– Diagnosis Information
– RTE Dump Files
The system collects the relevant
information and saves it to a zip file. This
may take some time and runs in the
background.
© 2015 SAP AG or an SAP affiliate company. All rights reserved. 9
SAP HANA Cockpit for Offline Administration
Troubleshoot Unresponsive System
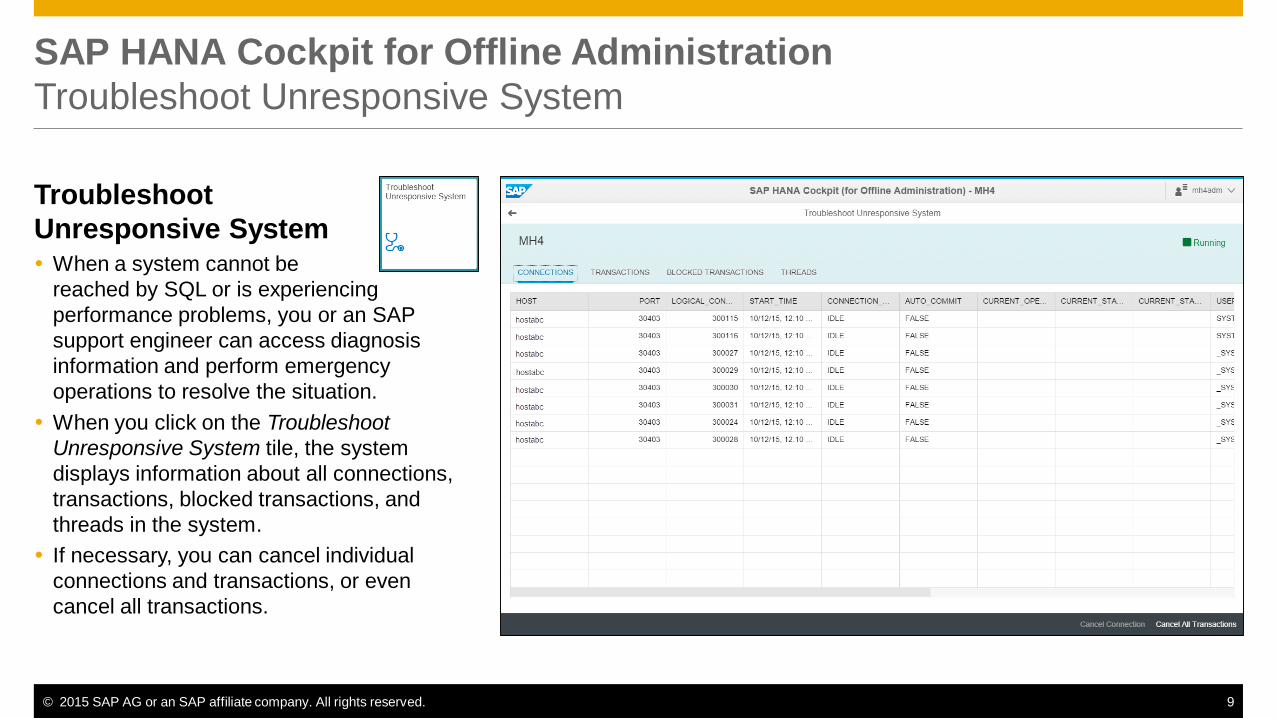
Troubleshoot
Unresponsive System When a system cannot be
reached by SQL or is experiencing
performance problems, you or an SAP
support engineer can access diagnosis
information and perform emergency
operations to resolve the situation.
When you click on the Troubleshoot
Unresponsive System tile, the system
displays information about all connections,
transactions, blocked transactions, and
threads in the system.
If necessary, you can cancel individual
connections and transactions, or even
cancel all transactions.
SAP HANA Database
© 2015 SAP AG or an SAP affiliate company. All rights reserved. 11
SAP HANA Database
Monitoring Improvements
Monitoring of DDL Statements Monitoring view M_EXECUTED_STATEMENTS records all DDL statements (e.g. table split/move) by default (can be disabled
using parameter enable_ddl in global.ini, section executed_statements).
Statements are traced in memory, and flushed in regular intervals to a file.
The file size and flush interval are configurable as well as the max. number of trace files (parameters maxfilesize, maxfiles and
trace_flush_internal).
Connection Monitoring New column CLOSE_REASON in view M_CONNECTIONS now reveals the reason, why a session has been closed (e.g.
because the connection client has been terminated, or because of an idle timeout).
New columns COMMIT_MAX_EXECUTION_TIME, COMMIT_TOTAL_EXECUTION_TIME,
COMMIT_AVG_EXECUTION_TIME and COMMIT_COUNT in view M_CONNECTION_STATISTICS record the time needed
to perform a commit.
© 2015 SAP AG or an SAP affiliate company. All rights reserved. 12
SAP HANA Database
Monitoring Improvements
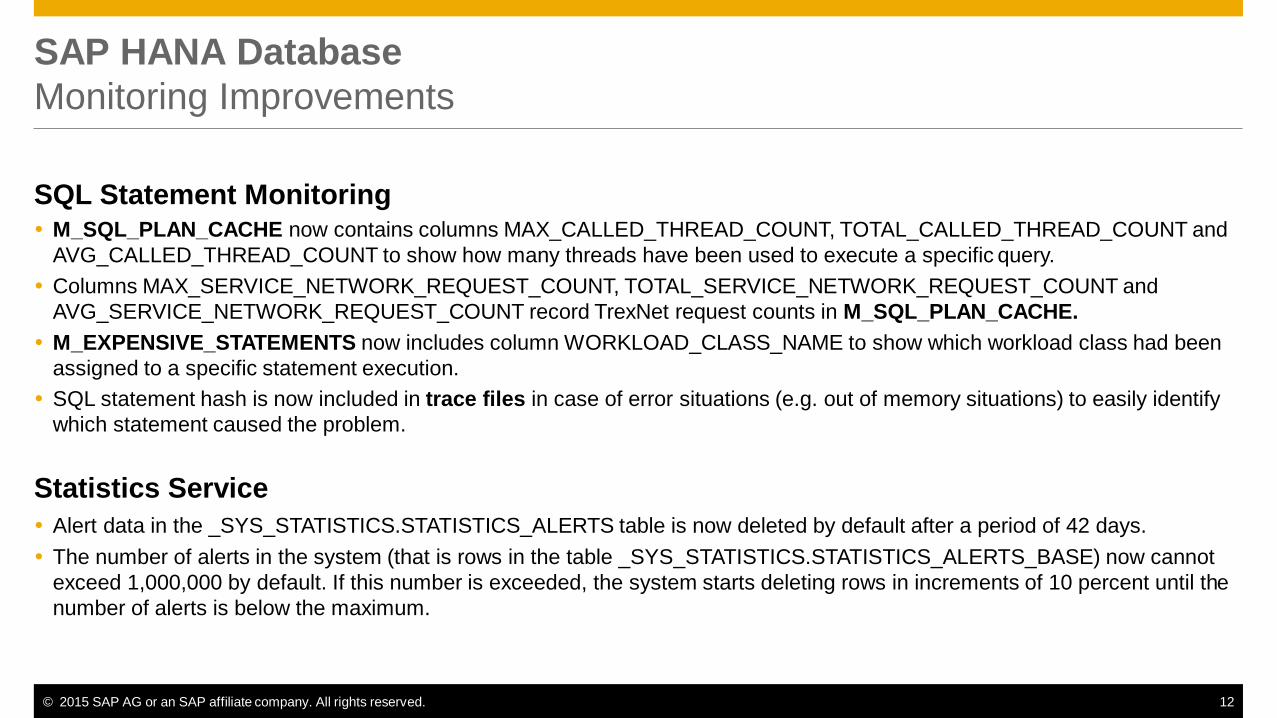
SQL Statement Monitoring M_SQL_PLAN_CACHE now contains columns MAX_CALLED_THREAD_COUNT, TOTAL_CALLED_THREAD_COUNT and
AVG_CALLED_THREAD_COUNT to show how many threads have been used to execute a specific query.
Columns MAX_SERVICE_NETWORK_REQUEST_COUNT, TOTAL_SERVICE_NETWORK_REQUEST_COUNT and
AVG_SERVICE_NETWORK_REQUEST_COUNT record TrexNet request counts in M_SQL_PLAN_CACHE.
M_EXPENSIVE_STATEMENTS now includes column WORKLOAD_CLASS_NAME to show which workload class had been
assigned to a specific statement execution.
SQL statement hash is now included in trace files in case of error situations (e.g. out of memory situations) to easily identify
which statement caused the problem.
Statistics Service
Alert data in the _SYS_STATISTICS.STATISTICS_ALERTS table is now deleted by default after a period of 42 days.
The number of alerts in the system (that is rows in the table _SYS_STATISTICS.STATISTICS_ALERTS_BASE) now cannot
exceed 1,000,000 by default. If this number is exceeded, the system starts deleting rows in increments of 10 percent until the
number of alerts is below the maximum.
© 2015 SAP AG or an SAP affiliate company. All rights reserved.
Thank you
Contact information
Melanie Handreck
SAP HANA Product Management