Embed Size (px)
Citation preview

Summary of European country’s PV applicationsBased on the IEA-PVPS-Annual Report
For FinSolar ProjectAalto University School of Business
PART 2: NORDICsDenmark, Sweden, Norway
16.3.2015Kim Yukyeong

DENMARKSummary ofNational survey report of PV power applications in DENMARK 2013
2

Electricity generation [GWh] 2012 2013Ratio
in 2013
Net electricity generation 29 025 32 956
Net import 5 214 1 081
Consumption (incl. grid losses) 34 239 34 137 100 %
Specification of electricity generation [GWh]Ratio to
comsumption
Central power stations 13 718 16 833 49,3 %
Local CHP plants 4 917 4 468 13,1 %
Land-based wind turbines 6 796 6 772 19,8 %
Offshore wind turbines 3 472 4 351 12,7 %
Photovoltaic cells 104 518 1,5 %
http://www.energinet.dk/EN/KLIMA-OG-MILJOE/Miljoerapportering/Elproduktion-i-Danmark/Sider/Elproduktion-i-Danmark.aspx
Denmark 3
Generation of electricity in Denmark
PV deployment statistics
Key figures for solar power 2012 2013 2014*
Capacity in total [MW] 406,9 563,4 610,1
Plants ≤ 6 kW 377,5 445,5
Plants > 6 kW ≤ 50 kW 19,9 45,0
Plants > 50 kW ≤ 400 kW 9,5 48,4
Plants > 400 kW 0 24,5
Number in total [amount] 76 184 91 407 94 117
Plants ≤ 6 kW 74 815 88 397
Plants > 6 kW ≤ 50 kW 1 286 2 586
Plants > 50 kW ≤ 400 kW 83 368
Plants > 400 kW 0 56
Generation in total [GWh] 104 518
http://www.energinet.dk/EN/KLIMA-OG-MILJOE/Miljoerapportering/VE-produktion/Sider/Sol.aspx*http://www.energinet.dk/DA/El/Engrosmarked/Udtraek-af-markedsdata/Sider/Statistik.aspx
Denmark 4
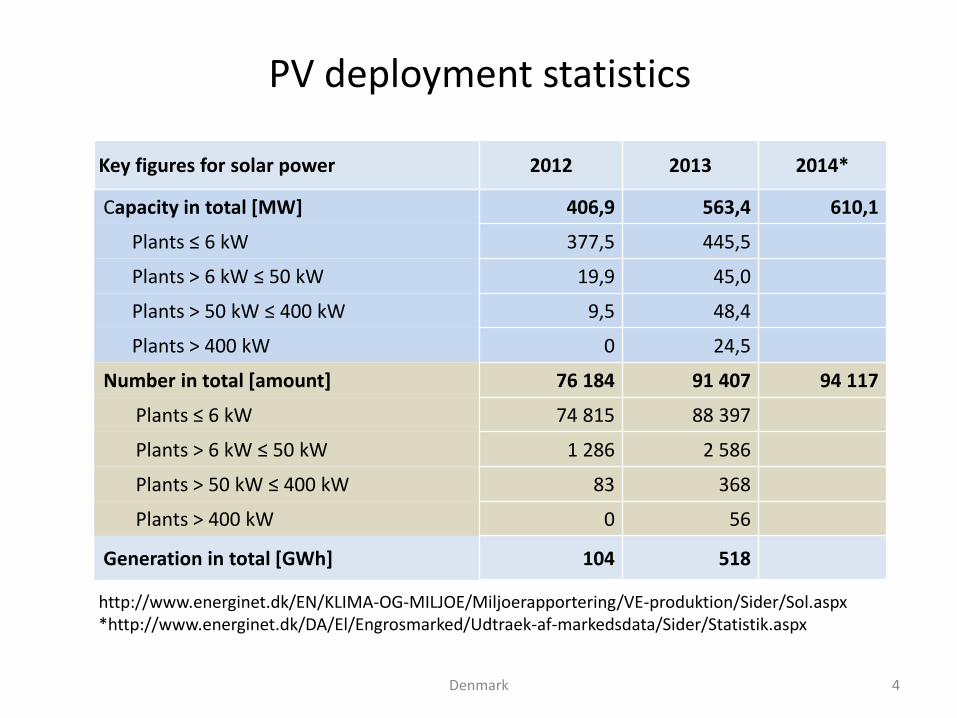
Annually installed PV plants
MW 2008 2009 2010 2011 2012 2013 2014
Annually 0,1 1,4 2,5 9,6 391,1 155,5 46,7
Cumulative 3,2 4,6 7,1 16,7 407,8 563,3 610
Denmark 5
0
100
200
300
400
500
600
700
v2008 v2009 v2010 v2011 v2012 v2013 v2014
Cumulative
Annually
MW

Denmark 6
The Danish PV boom Year 2012
6299
16078
46854
544 4460
10000
20000
30000
40000
50000
0-3 kW 3-5 kW 5-6 kW 6-10 kW >10kW
Plant scale (kW)
Number of PV installation
Total 70 221 plants installed in 2012

Renewable Energy Act
Programs On going measure
Feed-in tariffs For solar PV systems, lifetime is 20 years(10+10).Elevated surcharge for certain PV systems in 60 MW pools 2015.
Self consumptionincentives
Net settlement (net metering) based on 1h time window: Electricity produced and consumed within the same hour is free of PSO (Public Service Obligation) and electricity payments.Surplus production gets same tariffs.
Sustainablebuildingrequirements
BAPV/BIPV has a positive effect on the energy footprint of buildings (factored by 2,5)
Support for renewable energy http://www.ens.dk/undergrund-forsyning/el-naturgas-varmeforsyning/elforsyning/elproduktion/stotte-vedvarende-energi
Denmark 7

Feed-in Tariffs
• All production of solar power supplied to the public electricity grid, settled at 60 øre/kWh(8,1€-ct/kWh) for the first 10 years after the grid connection and 40 øre/kWh (5,4€-ct/kWh) in the subsequent 10 years. This applies both surplus production of solar cells that are connected to their own consumption (net settlement) and for freestanding photovoltaic, which is established to the grid.
• Legislative changes for increased surcharge entered into force on 11 February 2015 and provide increased supplement to certain photovoltaic plant, which is already connected to grid 20 November 2012 to 11 June 2013.
• With the new rules, it’s possible to receive price of 90, 130 or 145 øre/kWh (12-20 €-ct/kWh) if the conditions are met(depend on installation date, scale and type).
• On March 16, 2015 opens up the application to the 60 MW pool. It is also possible to apply for yet-to-be-established facilities with pre-made agreement for the purchase of PV systems. The support scheme operates on First-come first-served –basis.
http://www.energinet.dk/DA/El/Solceller/Har-du-solceller/Sider/default.aspx
http://www.ens.dk/undergrund-forsyning/el-naturgas-varmeforsyning/elforsyning/elproduktion/stotte-vedvarende-energi
Denmark 8

Tariffs table
Technology Level of support , DKK øre/kWh (€-ct/kWh) Duration
(*Balancing forentire lifetime)
Fixed payment(premium +
market price)
Fixed premium *cost of Balancing
Wind onshore 25 (3,3) 2,3 (0,3) 22 000 load hours
Wind offshore 51,8-62,9(6,9-8,4)
1,3 (0,2) 10 TWhwithin 20 years
Household windturbines <25kW
60 (8,1)
Wave, PV etc…
60 / 40(8,1 / 5,4)
First 10/11-20 years
http://www.reshaping-res-policy.eu/Download, D15 Report. Renewable Energy Policy - Country Profiles
Retail electricity price in 2013 from Key World Energy Statistics 2014
For Household 36,7 €-ct/kWh
For Industry 11,1 €-ct/kWh
Denmark 9
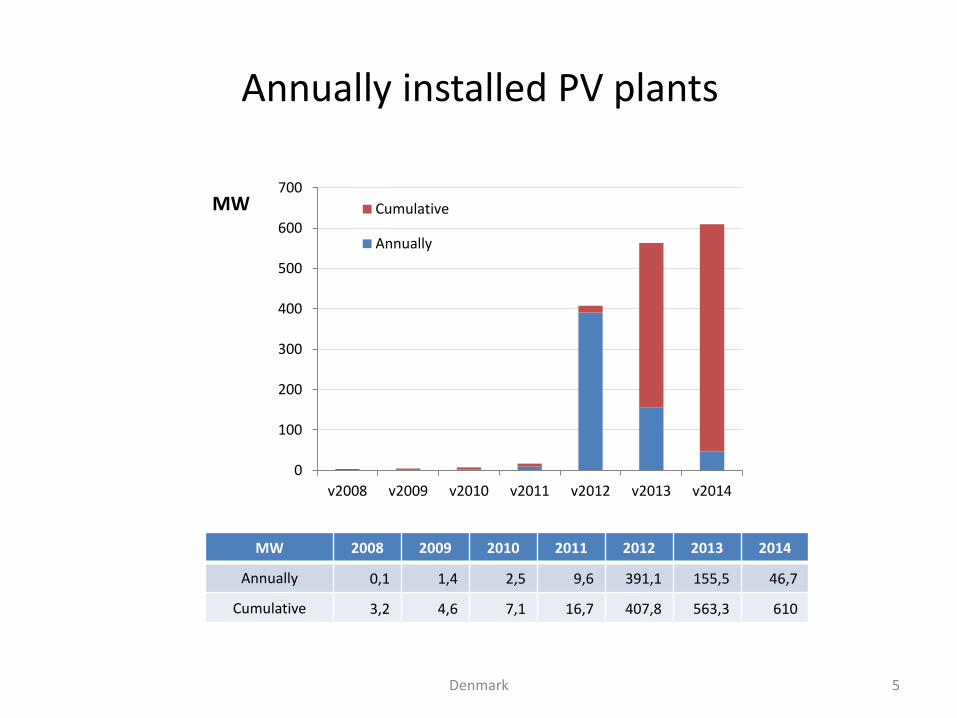
SWEDENSummary ofNational survey report of PV power applications in SWEDEN 2013
10

Power sources Installed capacity (MW) Generated electricity
Period v2012 v2013 v2012 v2013
PV 24 43 21 GWh 38 GWh
Hydro 16 203 16 150 78,4 TWh 60,8 TWh
Wind 3 745 4 470 7,2 TWh 9,9 TWh
Nuclear 9 363 9 531 61,4 TWh 63,6 TWh
All technology 37 353 38 273 162,4 TWh 149,5 TWh
Total electricitydemand(=consumption)
142,9 TWh 139,5 TWh
ELÅRET Verksamheten 2013 (Annual Report of Energy 2013)http://www.svenskenergi.se/Global/Statistik/El%C3%A5ret/Sv%20Energi_el%C3%A5ret2013_versJUNI2014.pdf
Power capacity & Generation of electricity
Sweden 11

Renewable support policy
Programs On going measure
Capital subsidies for equipment or total cost 2009-20132013-2016
A direct capital subsidy for installation of grid connected PV systems open for all. Active in Sweden since 2009.In 2011 the subsidy covered 60 % total cost, 2012 this was lowered to 45 % and new 2013-2016 ordinance to 35 %.
Renewable portfolio standards (RPS)2003-2035
Quota obligation with tradable electricity certificates.Certificate demand is created through a annual quota obligation.In 2015 annual quota is 14,3% of total electricity production.
Joint Norwegian-Swedish electricity certificate market
From 1st January 2012, Sweden and Norway have a common electricity certificate market. The two countries aim at generation of 26,4 TWh (13,2 TWh each) from new renewable plant over period until 2020.
Fiscal measures Biomass and peat used for electricity production are tax-free.Electricity is not taxable if it is produced at plant with capacity < 100 kW by a non-commercial producer. Reduced real estate tax for wind plants
Sweden 12

1. The power producers receive one electricity Certificate for each megawatt hour (1EC/1MWh) of renewable electricity produced, over a maximum 15 years.
2. The electricity certificates are sold in a market where supply and demand determine the price. In this way, the producers receive extra income in addition to the power price.
3. Demand for electricity certificates arises in that power suppliers and certain power customers are obligated to buy electricity certificates corresponding to a certain proportion (annual quota) of their electricity sales or usage.
4. The electricity end users pay for the development of renewable electricity production because the cost of the electricity certificates is included in the electricity bill.
5. Every year, the market participants with quota obligations must cancel electricity certificates in order to fulfil their quota obligation.
6. Penalty fee for shortfall of certificates about 150% of the average certificate price.
Sweden 13
How does Quota Obligation work?

Who has quota obligations in Sweden?
• Power suppliers
• Electricity consumers who use power they have produced themselves, if the quantity of consumed electrical energy exceeds 60 MWh annually and has been produced in a plant with an installed capacity over 50 kW.
• Electricity consumers who have used electricity they have bought on the Nordic power exchange.
• Power-intensive industries that have been registered by the Swedish Energy Agency.
Who has quota obligations In Norway?
• All those who supply electrical energy to end users,
• All those who consume electrical energy that they have produced themselves
• All those who buy electrical energy for their own use on the Nordic power exchange or through bilateral agreements.
Sweden 14
Market participants with quota obligations
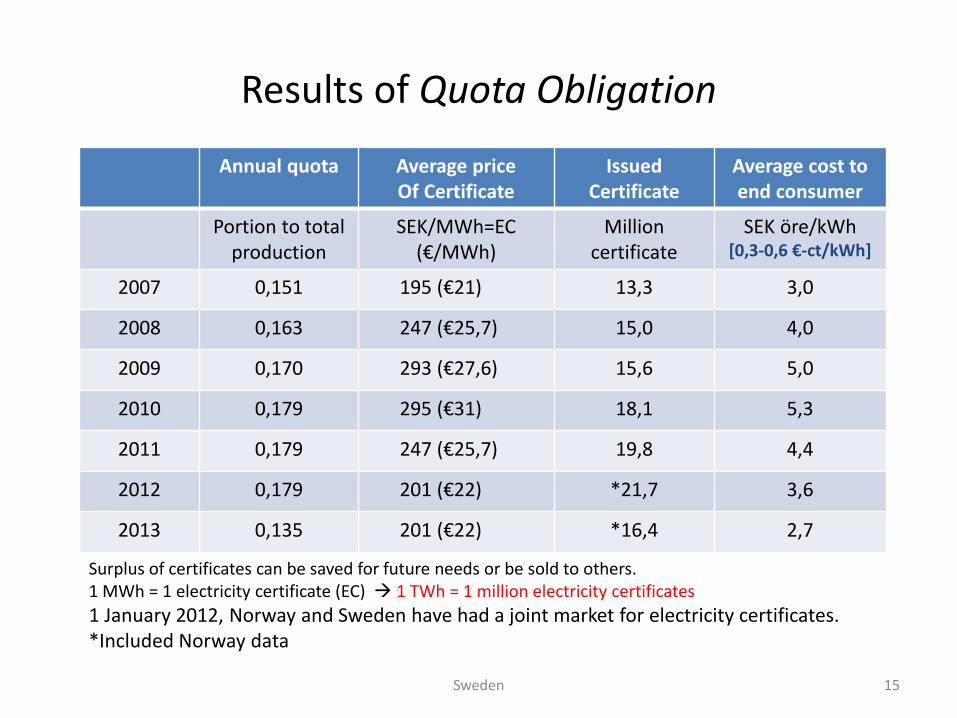
Results of Quota Obligation
Annual quota Average priceOf Certificate
IssuedCertificate
Average cost to end consumer
Portion to totalproduction
SEK/MWh=EC(€/MWh)
Millioncertificate
SEK öre/kWh[0,3-0,6 €-ct/kWh]
2007 0,151 195 (€21) 13,3 3,0
2008 0,163 247 (€25,7) 15,0 4,0
2009 0,170 293 (€27,6) 15,6 5,0
2010 0,179 295 (€31) 18,1 5,3
2011 0,179 247 (€25,7) 19,8 4,4
2012 0,179 201 (€22) *21,7 3,6
2013 0,135 201 (€22) *16,4 2,7
Surplus of certificates can be saved for future needs or be sold to others. 1 MWh = 1 electricity certificate (EC) 1 TWh = 1 million electricity certificates
1 January 2012, Norway and Sweden have had a joint market for electricity certificates.*Included Norway data
Sweden 15
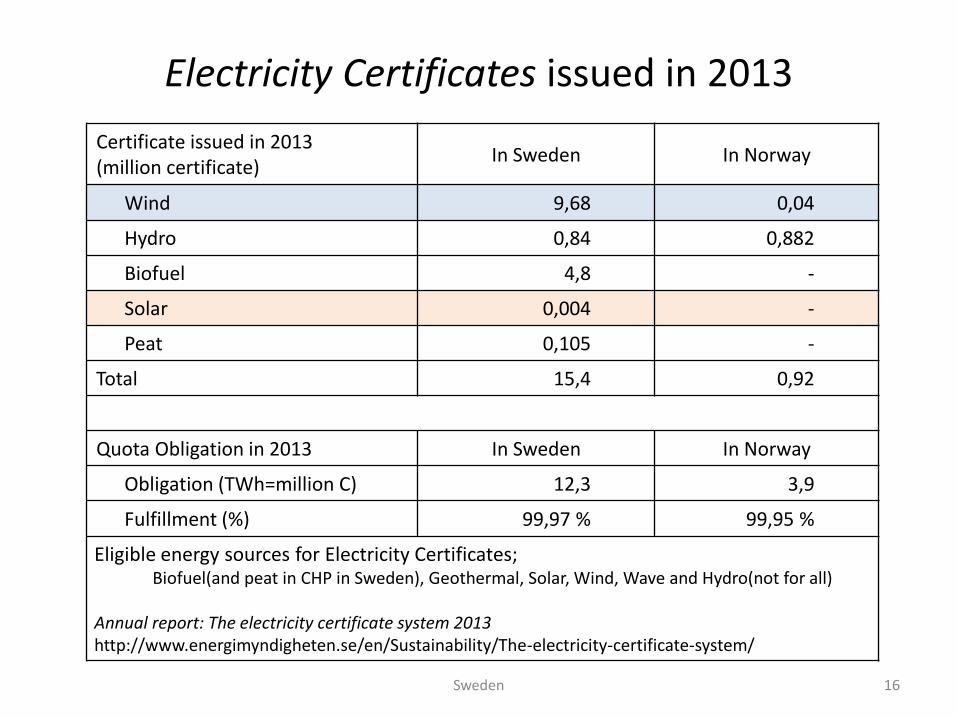
Electricity Certificates issued in 2013
Sweden 16
Certificate issued in 2013(million certificate)
In Sweden In Norway
Wind 9,68 0,04
Hydro 0,84 0,882
Biofuel 4,8 -
Solar 0,004 -
Peat 0,105 -
Total 15,4 0,92
Quota Obligation in 2013 In Sweden In Norway
Obligation (TWh=million C) 12,3 3,9
Fulfillment (%) 99,97 % 99,95 %
Eligible energy sources for Electricity Certificates;Biofuel(and peat in CHP in Sweden), Geothermal, Solar, Wind, Wave and Hydro(not for all)
Annual report: The electricity certificate system 2013 http://www.energimyndigheten.se/en/Sustainability/The-electricity-certificate-system/

NORWAYSummary ofNational survey report of PV power applications in NORWAY 2013
17

Power sources *Installed capacity (MW) **Generated electricity
Period v2012 v2013 v2012 v2013
PV 9,9 10,6 - -
Hydro 30 700 30 960 142,9 TWh 129,0 TWh
Wind 704 811 1,6 TWh 1,9 TWh
All technology 32 512 32 879 147,8 TWh 134,2 TWh
Total electricity demand(=gross consumption)
130 TWh 129 TWh
*Nordic-Market-Report-2014, Development in the Nordic Electricity Market (except PV data)http://www.nordicenergyregulators.org/
**Energy statistics, https://www.ssb.no/energi-og-industri
Power capacity & Generation of electricity
Norway 18

Application of PV
• The market for PV in Norway continues to be related to off-grid applications, primarily the leisure market (cabins, leisure boats) and to a more limited extent, the professional market (mostly lighthouses/lanterns along the coast and telecommunication systems). It is believed that there are about 100 000-150 000 solar installations, mainly in cabins/holiday properties and by the end of 2011 total capacity estimated at 9,1 MW.
• Aside from the leisure market, some new PV installations of significant size were installed in 2013-2014. Installed capacity has increased to nearly 15 MW by the end of 2014, thanks to a number of larger, grid-connected plants.– Asko Vestby, 370 kWp (2014)
– Powerhouse Kjørbo/ Entra Eiendom, 312 kWp (2013)
– Kiwi Auli/ Norgesgruppen, 158 kWp (2014)
– Fornebu S/ KLP, 150 kWp (2014)
– Økern sykehjem/ Omsorgsbygg, 130 kWp (2014)
– Campus Evenstad/ Statsbygg, 70 kWp (2013)
http://www.fornybar.no/solenergi/produksjon-og-marked#sol3.1 (from chapter 3.1.4 Markedet i Norge)
Norway 19
Oslo Solar project
• The city of Oslo wants to help it’s citizens in making green choices
• Climate and Energy Fund has started a Solkampanjen in the capital, with 40% support for the installation of solar cells.
• The price of solar installations in neighboring countries has dropped sharply when the prevalence has increased and Oslo wishes that same happens in Norway. This campaign helps to create a market for solar cells.
• The campaign started 1.1.2015 and it is already pledged over two million NOK(~0,2million€).
• The campaign will continue until the Climate and Energy Fund has pledged 4 million NOK(~0,4million€).
http://www.oslosola.no/stotte.html
Norway 20

Electricity Certificate
• A joint Norwegian-Swedish market for electricity certificates was established 1 January 2012. Norway and Sweden have a combined goal to produce renewable electricity ‘26,4 TWh’ from the new renewable power plant in 2020. Norway and Sweden are each responsible for financing 13,2 TWh regardless of the location of new generators in two countries.
• The electricity certificate market is a technology neutral, market-based support scheme for generation from renewable energy sources. However, the entrance fee for the participation to the el-certificate market is minimum NOK 15 000 (~€1650). This is too high for most owners of small PV-systems.
• Thus the Norwegian EC market remains without any particular public support schemes for PV systems. The main market for PV continues to be related to off-grid applications in addition to a few grid connected systems on buildings.
Norway 21
http://iea-pvps.org/index.php?id=93

Quota for Sweden and Norway
Norway 22
Year
Sweden Norway Cost of certificates to end consumer
øre/kWh (€-ct/kWh)Obligation ratio from renewables to
obligator’s total electricity generation
2011 0,179
2012 0,179 0,030 0,6 (0,07)
2013 0,135 0,049 1,2 (0,14)
2014 0,142 0,069
2015 0,143 0,088
2016 0,144 0,108
2017 0,152 0,127
2018 0,168 0,146
2019 0,181 0,165
2020 0,195 0,183
2021 0,190 0,182
The Norwegian-SwedishElectricity Certificate Market
ANNUAL REPORT 2013
……. ….. ……
2033 0,028 0,037
2034 0,012 0,018
2035 0,008 0,009

Useful Links
• National Survey Reports, IEA-PVPS Annual Report: http://iea-pvps.org/index.php?id=93
• http://www.energinet.dk/EN/Sider/default.aspx
• http://www.energinet.dk/DA/El/Engrosmarked/Udtraek-af-markedsdata/Sider/Statistik.aspx
• http://www.ens.dk/undergrund-forsyning/el-naturgas-varmeforsyning/elforsyning/elproduktion/stotte-vedvarende-energi
• http://www.svenskenergi.se/Elfakta/Elproduktion/
• http://www.svenskenergi.se/Vi-erbjuder/Webbshop/Gratis-publikationer/Statistik/
• http://www.energimyndigheten.se/en/Sustainability/The-electricity-certificate-system/
• http://www.nve.no/no/Energi1/Fornybar-energi/
• http://www.fornybar.no/energipolitikk/energipolitikk
• Statistics: https://www.ssb.no/energi-og-industri
• http://www.nordicenergyregulators.org/
NORDIC 23


![[Nordic Built Challenge 17.12.2013] Trine Pertou Mach, Nordic Built: Nordic Built](https://img.pdfslide.net/doc/110x75/547174dcb4af9f980a8b4ad9/nordic-built-challenge-17122013-trine-pertou-mach-nordic-built-nordic-built.jpg)