Embed Size (px)
Citation preview
Benchmarking Airport Terminal Utility Use in Europe, Americas, and Asia Pacific
Rian Burger, Principal OAA, LEED® AP BD+C

Can we compare?
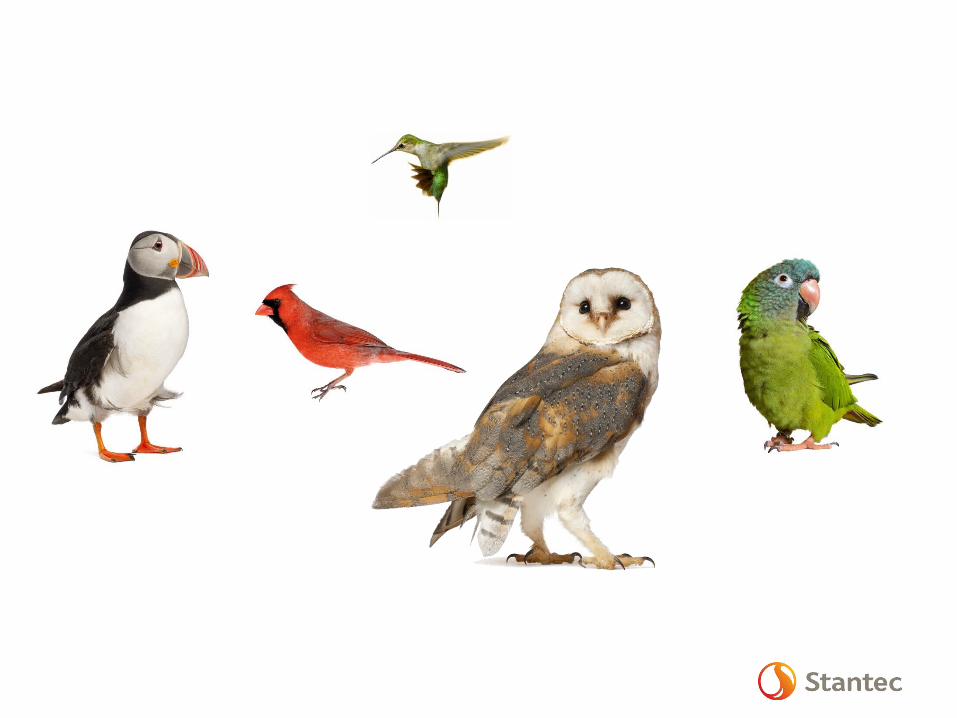
Utility Benchmarking Initiatives
European ResearchNational University of Ireland - Galway
Texas A&M
CBECs
International FacilitiesManagers Association /
National ResearchCouncil Canada
Stantec
The Stantec Approach
1. Gather energy and water consumption data for a calendar year
2. Capture enplanement numbers and building area
3. Categorize airports by number of enplanements and compare small, medium, and large categorization
4. Perform comparisons given size and ASHRAE Climate Region
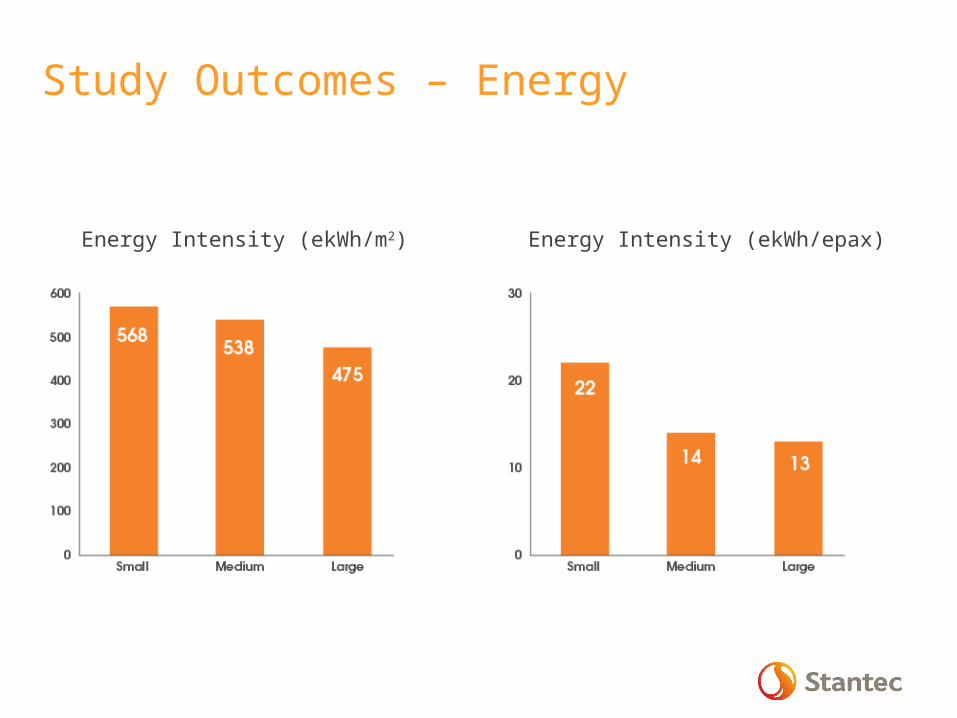
Study Outcomes – Energy
Energy Intensity (ekWh/m2) Energy Intensity (ekWh/epax)
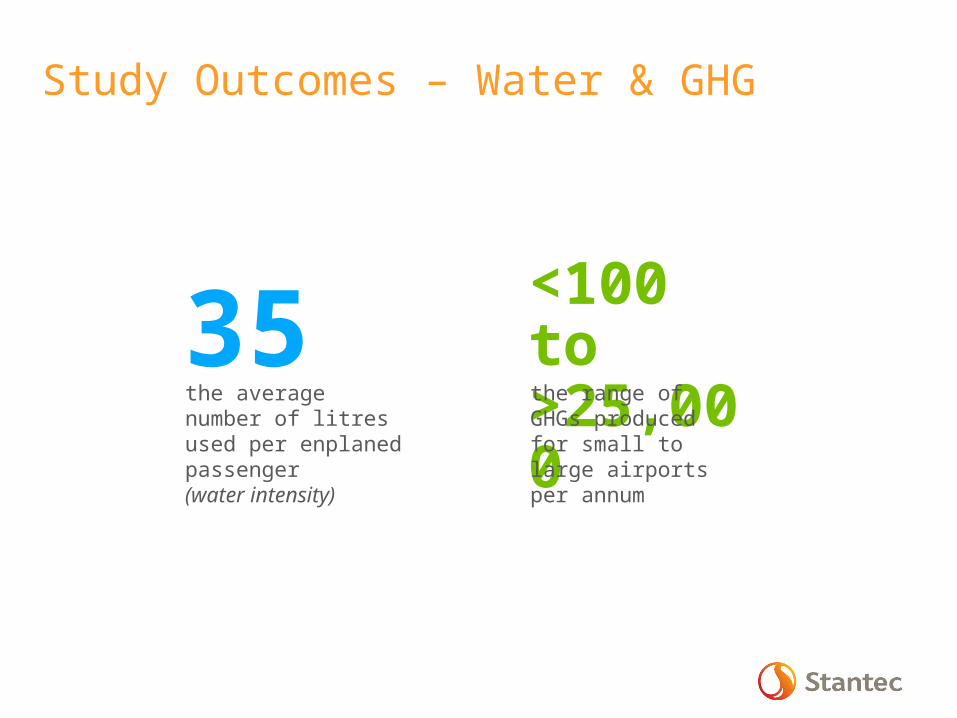
Study Outcomes – Water & GHG
35 the average number of litres used per enplaned passenger (water intensity)
<100 to >25,000
the range of GHGs produced for small to large airports per annum
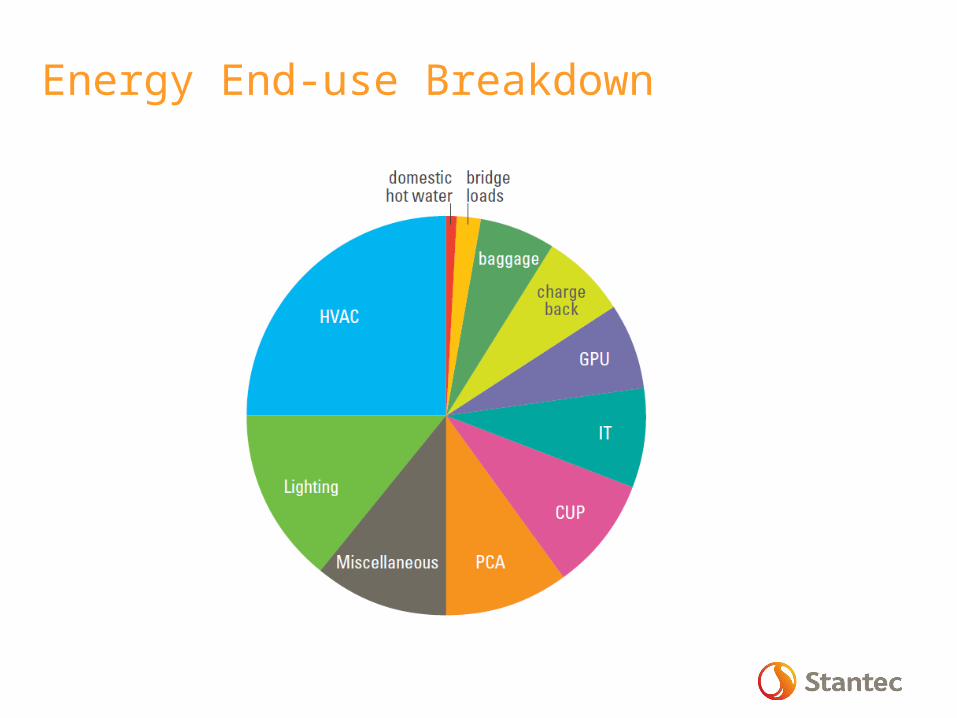
Energy End-use Breakdown
Kenny to providePie chart
Lessons Learned
• Airports incorporate diverse metering strategies
• Climate does not appear to significantly impact energy performance
• Airports are typically the second largest energy consumers by building type
• Airlines have not been engaged in conversation
• Airport owner / operators are engaged in resource reduction strategies
• Lack of standards/regulation
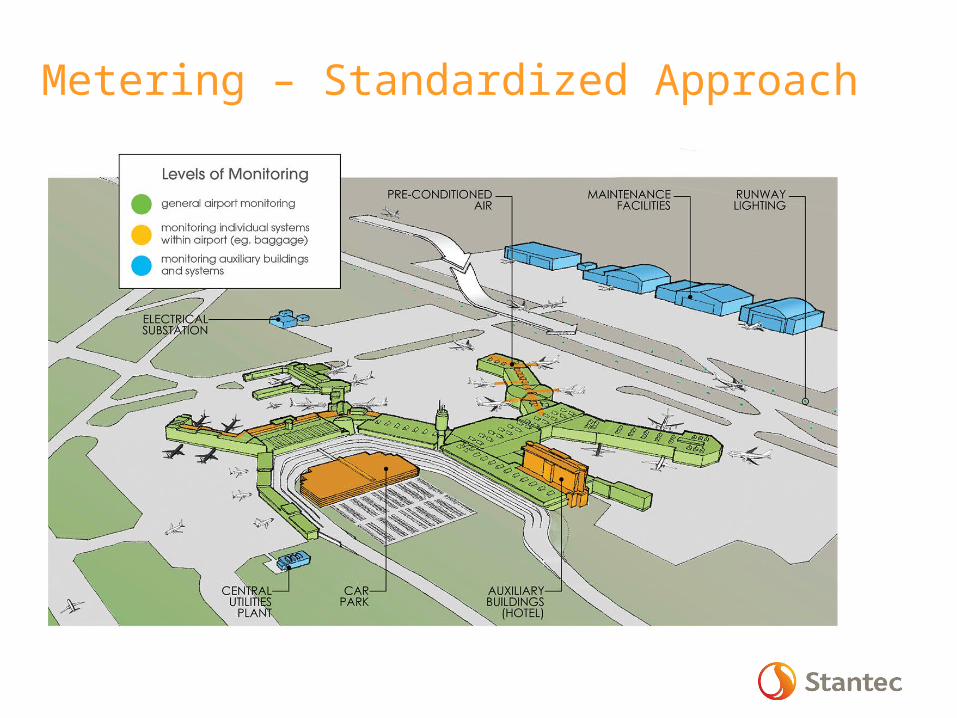
Metering – Standardized Approach

A European Perspective
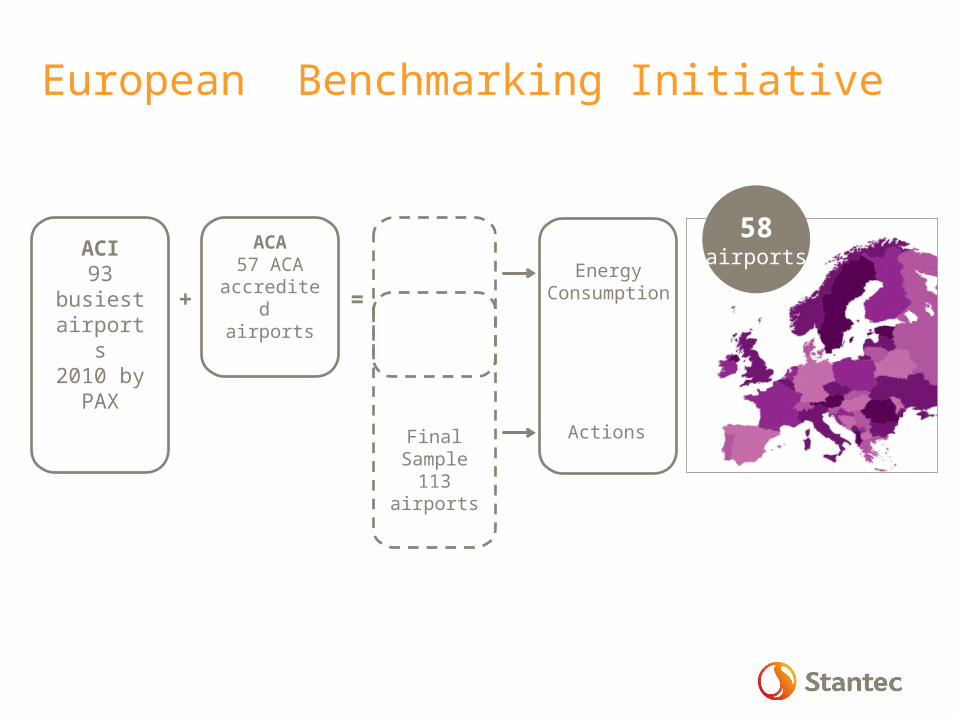
European Benchmarking Initiative
ACI93
busiestairports2010 by
PAX
FinalSample
113 airports
ACA57 ACA
accredited airports+ =
EnergyConsumption
Actions
58airports
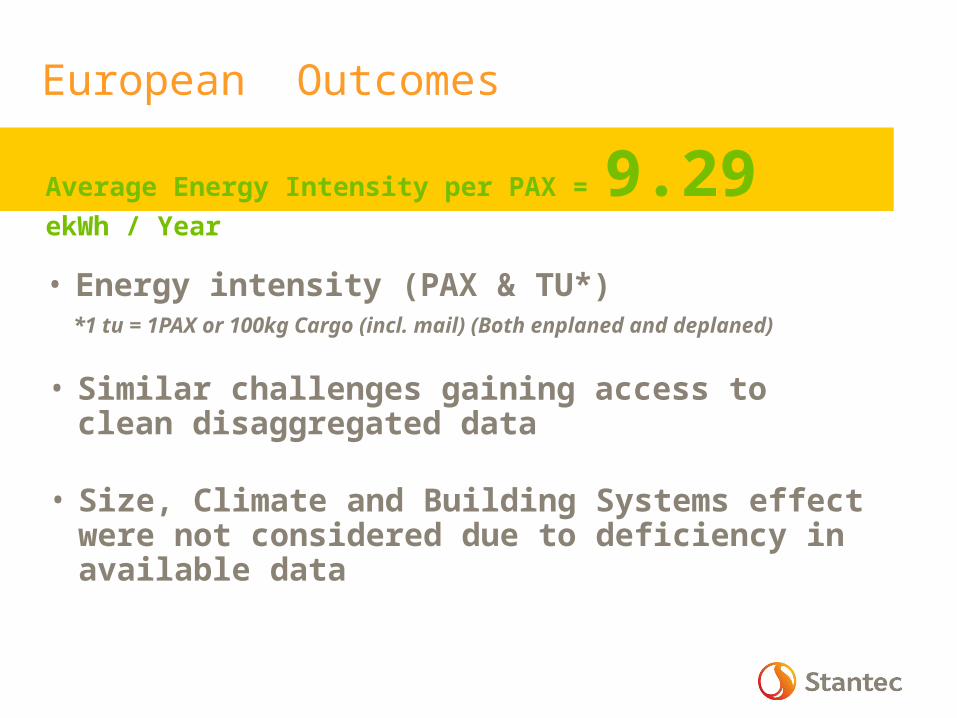
European Outcomes
Average Energy Intensity per PAX = 9.29
ekWh / Year
• Energy intensity (PAX & TU*) *1 tu = 1PAX or 100kg Cargo (incl. mail) (Both enplaned and
deplaned)• Similar challenges gaining access to clean
disaggregated data
• Size, Climate and Building Systems effect were not considered due to deficiency in available data
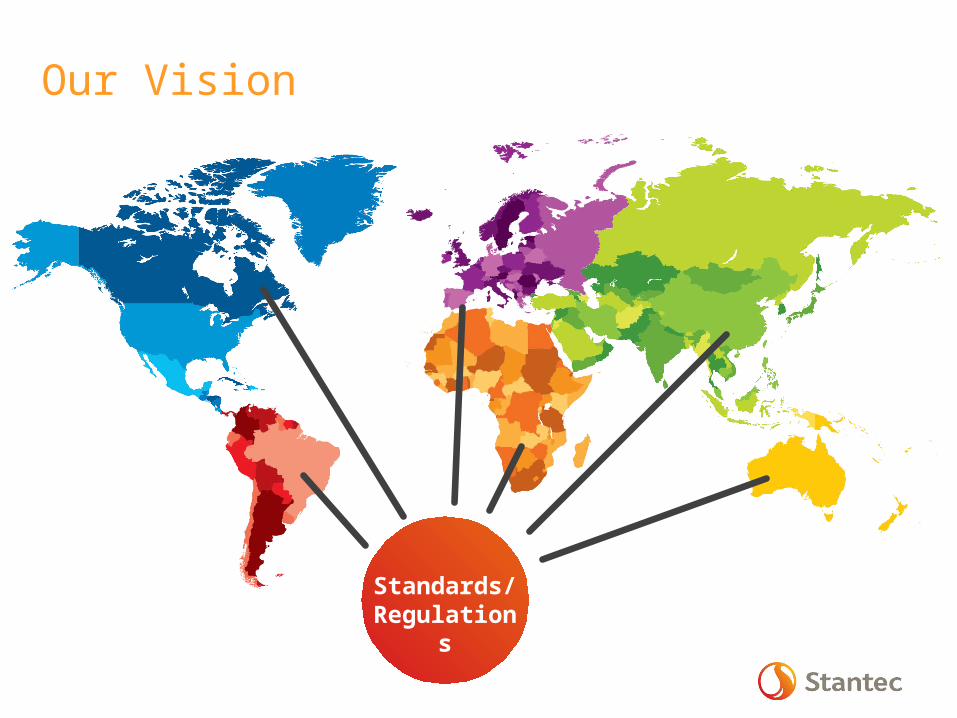
Our Vision
Standards/ Regulation
s


![[OFICIAL®] Hotel Front Air Congress Aeropuerto 4* - Barcelona](https://img.pdfslide.net/doc/110x75/61732aac6558c3234c231276/oficial-hotel-front-air-congress-aeropuerto-4-barcelona.jpg)